Comparative Study of Multi-Delay Pseudo-Continuous Arterial Spin Labeling Perfusion MRI and CT Perfusion in Ischemic Stroke Disease
←
→
Page content transcription
If your browser does not render page correctly, please read the page content below
ORIGINAL RESEARCH
                                                                                                                                              published: 11 August 2021
                                                                                                                                         doi: 10.3389/fninf.2021.719719

                                             Comparative Study of Multi-Delay
                                             Pseudo-Continuous Arterial Spin
                                             Labeling Perfusion MRI and CT
                                             Perfusion in Ischemic Stroke Disease
                                             Xi Xu 1† , Zefeng Tan 2,3† , Meng Fan 1† , Mengjie Ma 1 , Weimin Fang 1 , Jianye Liang 1,4 ,
                                             Zeyu Xiao 1 , Changzheng Shi 1,5* and Liangping Luo 1,5*
                                             1
                                               Medical Imaging Center, The First Affiliated Hospital of Jinan University, Guangzhou, China, 2 Department of Neurology,
                                             The First Affiliated Hospital of Jinan University, Guangzhou, China, 3 Department of Neurology, Shun De Hospital of Jinan
                                             University, Foshan, China, 4 Department of Medical Imaging, Sun Yat-sen University Cancer Center, Guangzhou, China,
                                             5
                                               Engineering Research Center of Medical Imaging Artificial Intelligence for Precision Diagnosis and Treatment, Guangzhou,
                                             China

                                             With the aging population, stroke has gradually become the leading cause of death and
                                             disability among adults. It is necessary to verify whether multi-delay pseudo-continuous
                                             arterial spin labeling (pCASL) MRI can be used as a standard neuroimaging protocol
                                             in the patients with ischemic stroke. We aimed to investigate the clinical utility of multi-
                                             delay pCASL for evaluating cerebral perfusion in ischemic stroke disease. Twenty-one
                                             ischemic stroke patients [18 men and 3 women; median age, 62 years (age range, 37–
                          Edited by:
                                             84 years)] were enrolled in this study. All patients underwent examinations, including
                        Heye Zhang,
         Sun Yat-sen University, China       the multi-delay pCASL protocol (using 6 PLDs between 1,000 and 3,500 ms) and
                      Reviewed by:           computed tomography perfusion (CTP). The cerebral blood flow (CBF) and arterial
             KowsalyaDevi Pavuluri,          transit time (ATT) maps were obtained by the multi-delay pCASL protocol, while CBF
           Mayo Clinic, United States
                              Xin Liu,
                                             and mean transit time (MTT) maps were derived by CTP measurements. Based on
            Foshan University, China         the voxel level analysis, Pearson correlation coefficients were used to estimate the
                   *Correspondence:          associations between the two modalities in the gray matter, white matter, and whole
                       Changzheng Shi
                                             brain of each subject. Moderate to high positive associations between ASL-CBF and
                    tsczcn@jnu.edu.cn
                         Liangping Luo       CTP-CBF were acquired by voxel-level-wise analysis in the gray matter, white matter,
                     tluolp@jnu.edu.cn       and whole brain of the enrolled patients (all P < 0.005), and the average Pearson
     † These   authors have contributed      correlation coefficients were 0.647, 0.585, and 0.646, respectively. Highly significant
                    equally to this work
                                             positive correlations between ASL-ATT and CTP-MTT were obtained by voxel-level-wise
           Received: 02 June 2021            associations in the gray matter, white matter, and whole brain (all P < 0.005), and the
           Accepted: 28 June 2021            average Pearson correlation coefficients were 0.787, 0.707, and 0.799, respectively. In
         Published: 11 August 2021
                                             addition, significant associations between ASL and CT perfusion were obtained in the
                             Citation:
            Xu X, Tan Z, Fan M, Ma M,        gray, white matter and whole brain, according to the subgroup analyses of patient’s age
   Fang W, Liang J, Xiao Z, Shi C and        and disease stage. There is a correlation between perfusion parameters from multi-delay
     Luo L (2021) Comparative Study
                                             pCASL and CT perfusion imaging in patients with ischemic stroke. Multi-delay pCASL
   of Multi-Delay Pseudo-Continuous
  Arterial Spin Labeling Perfusion MRI       is radiation-free and non-invasive, and could be an alternative method to CT scans for
 and CT Perfusion in Ischemic Stroke         assessing perfusion in ischemic stroke disease.
                              Disease.
      Front. Neuroinform. 15:719719.         Keywords: ischemic stroke, pseudo-continuous arterial spin labeling, CT perfusion, cerebral blood flow, arterial
      doi: 10.3389/fninf.2021.719719         transit time, mean transit time

Frontiers in Neuroinformatics | www.frontiersin.org                                 1                                          August 2021 | Volume 15 | Article 719719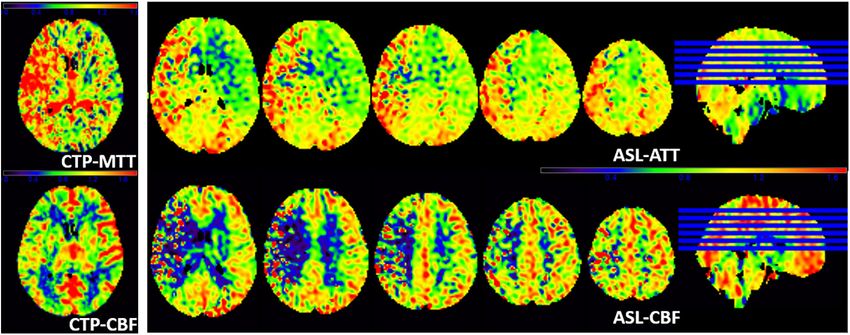
Xu et al.                                                                                                                 pCASL in Ischemic Patients

INTRODUCTION
The Global Burden of Disease Study in 2015 provided a
comprehensive assessment of 249 all-cause and cause-specific
deaths across 195 countries and regions from 1980 to 2015;
stroke was determined to be the second-leading cause of death
worldwide (Wang et al., 2016). The 2019 statistical report from
the American Heart Association on heart disease and stroke
revealed that approximately 795,000 people experience a new or
recurrent stroke each year (Benjamin et al., 2019). With the aging
of the population, stroke has gradually become a leading cause of
death and disability among adults in China. The social burden of
stroke has gradually increased because of the increased morbidity
and mortality (Vilela and Rowley, 2017).
    Stroke is a type of cerebrovascular disease characterized by
the symptoms of cerebral ischemia or cerebral hemorrhage,
and cerebral ischemia is the main cause of stroke (Benjamin
et al., 2019). Early diagnosis and appropriate treatment of the
disease can effectively improve the prognosis of patients. MRI
and CT are routine imaging modalities that play important roles
in evaluating the brain condition of patients. Because of the
pathophysiological changes in stroke patients, the assessment             FIGURE 1 | Flowchart of the comparison between ASL and CT perfusion.
of microcirculation and cerebral perfusion is of great value for
diagnosis and treatment.
    The development of CT image analysis to assess the function          used to investigate the accuracy of multi-delay pCASL perfusion
of different organs (e.g., brain, heart, carotid artery, etc.)           MRI for estimating cerebral perfusion in ischemic stroke patients,
constitutes a promising strategy for evaluating normal and               using CTP as the reference standard. In this study, we aimed to
abnormal physiology (Xu et al., 2018; Zhang et al., 2018).               explore the feasibility and clinical utility of multi-delay pCASL by
As known errors are associated with bolus-based perfusion                comparison with CTP imaging in ischemic stroke.
measurements (Wintermark et al., 2005), CT perfusion (CTP) is
not regarded as the gold standard for calculating hemodynamic
parameters. However, it is routinely used in clinical practice           MATERIALS AND METHODS
for perfusion evaluation, because it provides relatively accurate
hemodynamic parameters, such as cerebral blood flow (CBF) and            Patients
mean transit time (MTT). It’s noting that the radiation damage           The study was conducted in accordance with the principles of
and contrast medium may not be suitable for some individuals.            the Declaration of Helsinki, and the study protocol was approved
Arterial spin labeling (ASL) perfusion MRI has gradually applied         by the institutional review board of our hospital. A total of 21
in the clinic without radiation damage. Previously studies               patients with ischemic stroke [18 men and 3 women; median age,
have generally adopted a single post-labeling delay (PLD) time           62 years (age range, 37–84 years)] were enrolled between June
(Wang et al., 2014), typically between 1.5 and 2 s, which may            2017 and March 2018. All patients underwent multi-delay pCASL
underestimate perfusion due to prolonged arterial transit time           and CTP examinations (Figure 1).
(ATT) in ischemic stroke (MacIntosh et al., 2010). In recent                 The inclusion criteria were as follows: (1) All patients were
years, multi-delay ASL sequences have been used to overcome              confirmed as ischemic stroke according to clinical symptoms and
this limitation. Wang et al. (2014) concluded the correlations           imaging diagnosis (MRI or CT images); (2) To reduce additional
between multi-delay pCASL and CTP in moyamoya disease,                   CT-associated radiation damage, patients who required CTP
and indicated ASL could be a part of neuroimaging protocols              examination based on their condition were enrolled in the study;
in the moyamoya disease. They advised warranted studies of               (3) Both CTP and ASL examinations were performed within 24 h.
ischemic stroke, as the radiation-free and non-invasive ASL can              The exclusion criteria were as follows: (1) Patients complicated
provide perfusion information without the use of contrast agent.         with severe parenchymal organ disease (heart, lung, liver and
MacIntosh et al. (2010) adopted multi-delay pCASL (PLD times             kidney); (2) Patients complicated with brain trauma, brain
were set between 500 ms and 2,500 ms, a total of 9 intervals)            tumor, intracranial hemorrhages, craniocerebral infection and
in patients with acute ischemic stroke in a recent research.             other mixed factors; (3) Patients with a cardiac pacemaker, non-
Wang et al. (2013) made a comparison between multi-delay                 titanium alloy stent or internal plate fixation in vivo; (4) Unable
ASL perfusion MRI and dynamic susceptibility contrast (DSC)              to complete the examination due to claustrophobia.
enhanced perfusion imaging in acute ischemic stroke disease. The
results showed highly correlations between pCASL and DSC CBF             Image Acquisition
measurements. In our study, a wider range of PLD times was               All included patients underwent CTP on a Toshiba Aquilion One
adopted, totally 6 PLD times between 1,000 and 3,500 ms were             scanner, which was set at 112∼187 mA and 80 kV. And the

Frontiers in Neuroinformatics | www.frontiersin.org                  2                                       August 2021 | Volume 15 | Article 719719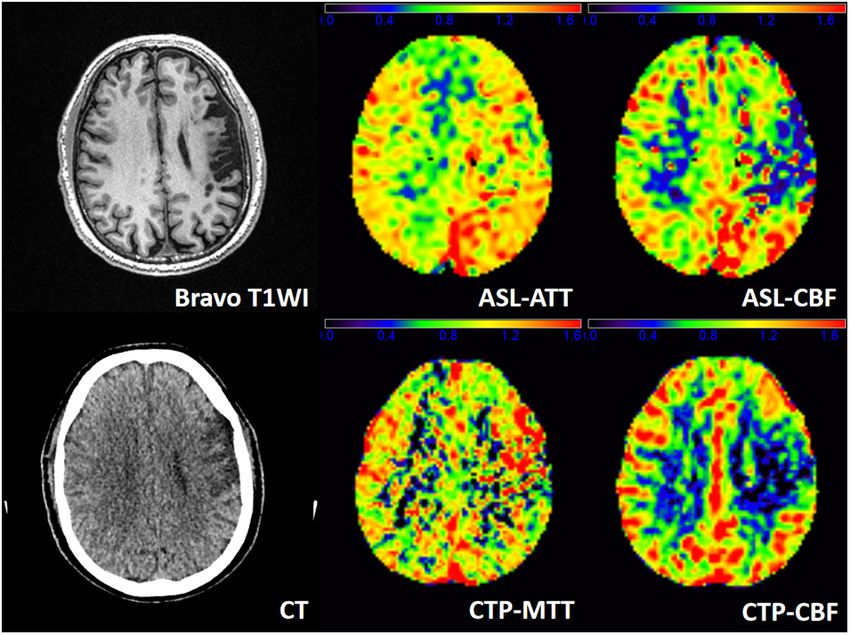
Xu et al.                                                                                                                          pCASL in Ischemic Patients

minimum section thickness was 0.5 mm. CTP scan was initiated               TABLE 1 | clinical characteristics of patients at admission (n = 21).
after injection of non-ionic iodinated contrast agent (Ultravist,
                                                                           Variable                                                          Patients (n = 21)
370 mg I/L; 50 ml at a rate of 6 ml/s) and physiological saline
(30 ml at rate of 6 ml/s), using a power injector. The dynamic             Patient demographics
volume scan mode was turned on immediately after a delay of                Median age, years (range)                                               62 (37–84)
7 s following the intravenous injection of contrast agent. The first       Male (n,%)                                                                18 (86)
period was used as a mask; 11–36 s was used for the arterial phase,        Female (n,%)                                                              3 (14)
and continuous scanning was performed at intervals of 2 s; 40–             Disease stage
60 s was used for the venous phase for continuous scanning at              Acute stage (n,%)                                                         5 (24)
intervals of 5 s. In total, 19 image acquisitions were performed           Subacute stage (n,%)                                                      8 (38)
with a total scan time of 60 s.                                            Chronic stage (n,%)                                                       8 (38)
    All enrolled patients underwent MRI on a GE Discovery                  Laboratory test
MR750 3.0T System, using an 8-channel phased array head coil.              Blood pressure, mmHg
The MRI protocol included T1-weighted imaging (T1WI), T2-                  Median systolic pressure (range)                                    143 (111–160)
weighted imaging (T2WI), fluid attenuated inversion recovery               Median diastolic pressure (range)                                       80 (68–107)
(FLAIR), diffusion weighted imaging (DWI), and multi-delay                 Hypertension (n,%)                                                        15 (71)
pCASL. For multi-delay pCASL, the imaging parameters                       Median fasting glucose, mmol/L (range)                             4.97 (3.96–9.49)
were as follows: the delay time was between 1,000 and                      Diabetes (n,%)                                                            3 (14)
3,500 ms, for a total of 6 PLDs. Filp angle (FA) = 111◦ ,                  Median triglyceride, mmol/L (range)                                1.64 (0.64–4.85)
repetition time (TR) = 5,436 ms, echo time (TE) = 24.2 ms,                 Elevated triglyceride (≥1.70 mmol/L, n,%)                                 10 (48)
slice thickness = 5 mm, spacing between slices = 0 mm,
FOV = 220 mm × 220 mm, acquisition matrix = 550 × 6, number
of excitations (NEX) = 1.                                                  based on age of patient and disease stage were performed to study
                                                                           the associations between ASL and CT perfusion.
Processing of ASL and CTP
The post-processing of CTP data was performed on Vitrea Fx
6.3 image post-processing workstation by a senior radiologist.
                                                                           RESULTS
CTP-CBF and CTP-MTT perfusion maps derived from CT
perfusion images using delay-insensitive blockcirculant singular-          Clinical Characteristics of Enrolled
value decomposition (bSVD) post-processing method referring                Patients
to existing described procedures (Wintermark et al., 2001).                In total, 21 patients [18 men and 3 women; median age, 62 years
   Mean perfusion difference images were generated for each                (age range, 37–84 years)] with confirmed ischemic stroke were
PLD. Both ASL-ATT and ASL-CBF perfusion maps were                          enrolled in this study. Of 21 patients, fifteen (71.4%) had
computed online. The ASL-ATT map was converted using the                   hypertension, 3 (14.3%) patients had diabetes, and 10 (47.6%)
weighted delay method as previously described (Dai et al., 2012;           patients had elevated triglyceride levels (Table 1).
Wang et al., 2014).
   Pre-processing was performed using Data Processing and                  The Correlations Between Multi-Delay
Analysis of Brain Imaging (DPABI_V2.3)1 , which is based                   pCASL and CTP in Patients With
on Statistical Parametric Mapping (SPM8)2 . DPABI was
                                                                           Ischemic Stroke
developed in MATLAB 2013 (The MathWorks Inc., Natick, MA,
                                                                           The Pearson correlation coefficients of hemodynamic parameters
United States). ASL-CBF, ASL-ATT, CTP-CBF, and CTP-MTT
                                                                           between two modalities were obtained based on voxel levels in
images were further normalized into the Montreal Neurological
                                                                           the gray matter, white matter, and whole brain (Table 2; all
Institute template space using SPM8. Based on the registered
                                                                           P < 0.005). Moderate to high positive associations between ASL-
3D T1W images, the gray matter (GM) and white matter (WM)
                                                                           CBF and CTP-CBF were acquired in the gray matter, white matter
masks were extracted. ASL-CBF, ASL-ATT, CTP-CBF, and
                                                                           and whole brain of the enrolled patients, and the mean Pearson
CTP-MTT images were segmented into GM and WM maps
                                                                           correlation coefficients were 0.647, 0.585, and 0.646, respectively.
using the Segment program in SPM8.
                                                                           Highly significant positive correlations between ASL-ATT and
                                                                           CTP-MTT were obtained in the gray matter, white matter and
Statistical Analysis                                                       whole brain, and the mean Pearson correlation coefficients were
Voxel-wise analysis of the gray matter, white matter, and whole            0.787, 0.707, and 0.799, respectively (Table 3). The box plots
brain was conducted by DPABI: Pearson correlation coefficients             showed the same results (Figure 2).
were calculated across voxels between the two modalities in
the gray matter, white matter and whole brain of each subject
                                                                           Subgroup Analyses Based on Patient’s
as previously described (Wang et al., 2014). Subgroup analyses
                                                                           Age and Disease Stage
1
    http://restfmri.net/forum/DPABI                                        We divided the ages into 30–49, 50–69, and over 70 for a
2
    http://www.fil.ion.ucl.ac.uk/spm/                                      subgroup analysis. The Pearson correlation coefficients exceed

Frontiers in Neuroinformatics | www.frontiersin.org                    3                                             August 2021 | Volume 15 | Article 719719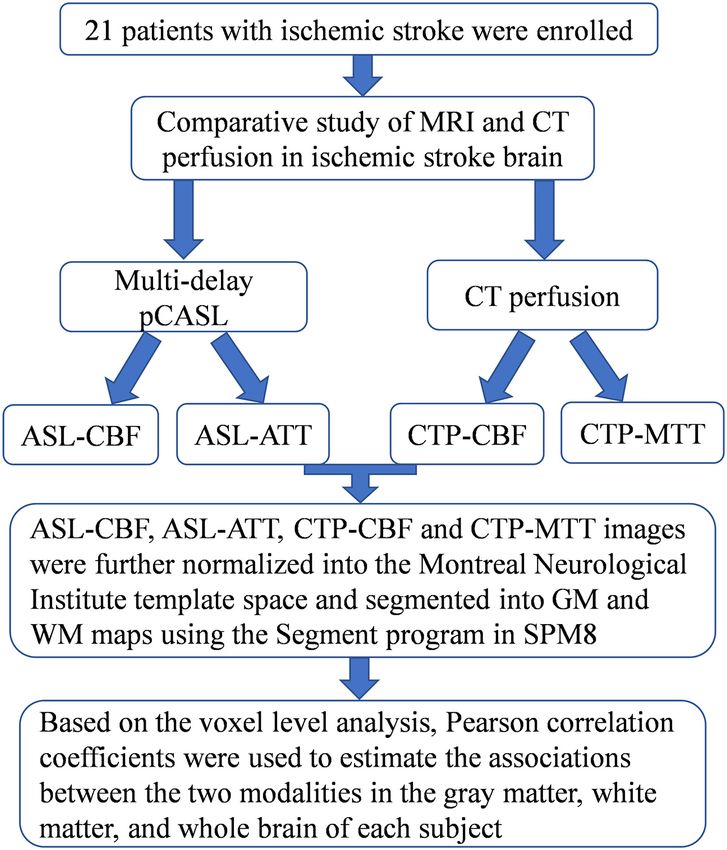
Xu et al.                                                                                                                                    pCASL in Ischemic Patients

TABLE 2 | Pearson correlation coefficients between the two modalities in gray, white matter and whole brain of each subject.

                                              ASL-ATT vs. CTP-MTT                                                        ASL-CBF vs. CTP-CBF

Patient No.              Gray matter                  White matter          Whole brain               Gray matter               White matter              Whole brain

P1                          0.781*                       0.695*                0.806*                    0.604*                     0.581*                   0.589*
P2                          0.803*                       0.683*                0.793*                    0.779*                     0.714*                   0.781*
P3                          0.743*                       0.617*                0.788*                    0.730*                     0.651*                   0.736*
P4                          0.757*                       0.609*                0.750*                    0.736*                     0.721*                   0.737*
P5                          0.767*                       0.710*                0.797*                    0.600*                     0.497*                   0.601*
P6                          0.783*                       0.658*                0.801*                    0.802*                     0.671*                   0.809*
P7                          0.788*                       0.674*                0.790*                    0.569*                     0.513*                   0.566*
P8                          0.792*                       0.727*                0.787*                    0.662*                     0.616*                   0.683*
P9                          0.787*                       0.699*                0.801*                    0.612*                     0.497*                   0.597*
P10                         0.825*                       0.753*                0.812*                    0.705*                     0.641*                   0.705*
P11                         0.801*                       0.723*                0.840*                    0.718*                     0.629*                   0.719*
P12                         0.754*                       0.708*                0.818*                    0.748*                     0.711*                   0.766*
P13                         0.757*                       0.666*                0.770*                    0.475*                     0.391*                   0.493*
P14                         0.742*                       0.700*                0.703*                    0.427*                     0.459*                   0.394*
P15                         0.814*                       0.797*                0.834*                    0.574*                     0.645*                   0.569*
P16                         0.799*                       0.744*                0.811*                    0.650*                     0.655*                   0.646*
P17                         0.789*                       0.691*                0.794*                    0.522*                     0.499*                   0.518*
P18                         0.834*                       0.783*                0.846*                    0.582*                     0.539*                   0.574*
P19                         0.822*                       0.741*                0.829*                    0.637*                     0.453*                   0.623*
P20                         0.790*                       0.722*                0.800*                    0.765*                     0.674*                   0.765*
P21                         0.807*                       0.739*                0.817*                    0.697*                     0.532*                   0.689*

*P
Xu et al. pCASL in Ischemic Patients
TABLE 4 | Mean Pearson correlation coefficients of different subgroups between the two modalities in gray, white matter and whole brain.
ASL-ATT vs. CTP-MTT ASL-CBF vs. CTP-CBF
Gray matter White matter Whole brain Gray matter White matter Whole brain
Age (years)
30–49 (n = 5) 0.799 ± 0.018 0.732 ± 0.041 0.811 ± 0.020 0.618 ± 0.033 0.558 ± 0.081 0.612 ± 0.044
50–69 (n = 9) 0.792 ± 0.030 0.716 ± 0.039 0.802 ± 0.041 0.659 ± 0.126 0.613 ± 0.092 0.657 ± 0.138
>70 (n = 7) 0.773 ± 0.023 0.677 ± 0.051 0.787 ± 0.217 0.653 ± 0.107 0.568 ± 0.117 0.655 ± 0.103
Disease stage
Acute (n = 5) 0.788 ± 0.027 0.703 ± 0.066 0.799 ± 0.020 0.653 ± 0.106 0.625 ± 0.079 0.657 ± 0.111
Subacute (n = 8) 0.784 ± 0.025 0.699 ± 0.046 0.805 ± 0.026 0.701 ± 0.069 0.623 ± 0.081 0.702 ± 0.076
Chronic (n = 8) 0.790 ± 0.030 0.716 ± 0.039 0.794 ± 0.043 0.590 ± 0.105 0.523 ± 0.098 0.582 ± 0.109
occipital lobes and basal ganglia. The ASL-CBF of the infarct
regions decreases and the ASL-ATT increases compare to the
contralateral side. CTP is in concordance with the result of ASL.
DISCUSSION
The correlations between pCASL and CT perfusion were
analyzed in 21 patients with ischemic stroke in this study.
Moderate to high positive associations between ASL-CBF and
CTP-CBF were acquired in the gray matter, white matter, and
whole brain of the enrolled patients. Wang et al. (2014) also
found significant correlations between multi-delay pCASL and
CTP in patients with moyamoya disease. CTP scan was initiated
after injection of non-ionic iodinated contrast agent. The time
concentration curves can be obtained by serially detecting the
dynamic CT values of the interest regions (Konstas et al., 2009).
FIGURE 3 | A patient admitted to the hospital with weakness in the right In addition, a dynamic assessment of capillary level blood flow
upper limb for 1 day, and he had a history of ischemic stroke last year. T1WI through different mathematical models was obtained. ASL adopts
demonstrates an obsolete infarct in the left frontal lobe. ASL-ATT, CTP-MTT,
magnetically labeled arterial blood water as an endogenous
ASL-CBF, and CTP-CBF are normalized images and present consistent
results. CTP shows hypoperfused regions in the left frontal lobe. CTP-CBF of
tracer (Wu et al., 2007). When the labeled blood reaches the
the left frontal lobe is lower than the contralateral side, and ASL shows scanning level, it causes changes in the focal tissue magnetization
decreased ASL-CBF of the left frontal lobe. CTP-MTT is higher in the infarcted vector and longitudinal relaxation time. Although the imaging
area but not in the surrounding regions, whereas the ASL-ATT is decreased mechanisms of the two modalities are different, they can both
(probably no signal) in the infarcted region and increased in the surrounding
reflect blood perfusion of brain. Continuously dynamic scanning
regions/territories (fitting with the atrophy patterns).
is necessary to calculate the CT perfusion parameters; therefore,
the required radiation dose increases. Despite the application
of low-dose CT scans, radiation damage is still inevitable.
regions in the left frontal lobe. By visual appearance, ASL Multi-delay pCASL is non-radiative and non-invasive, and can
images present similar perfusion lesion as CTP. However, CTP- be performed in patients with iodine contrast agent allergies,
MTT is higher in the infarcted area, whereas the ASL-ATT hyperthyroidism, and renal insufficiency.
is decreased (probably no signal) in the infarcted region and The CBF and ATT maps were simultaneously derived using
increased in the surrounding regions/territories (fitting with the multi-delay pCASL protocol in this study. ATT refers to the
atrophy patterns). time needed for the inverted spins to reach the acquisition
Figure 4 shows another representative case with ischemic region (Chen et al., 2012). The blood flow of ischemic stroke
stroke disease, and ASL images are in substantial agreement patients is slowed because of stenosis or the collateral pathway
with the results of CTP. Besides, ASL-CBF shows focal of the cerebral arteries, and the arterial transit time is prolonged
intravascular signals and low tissue perfusion in the right frontal, (Lin et al., 2016). All patients enrolled in this study presented
temporal and occipital lobes, which may indicate the status of increased ATT in the infarct region, which can be used to
collateral perfusion. detect focal cerebral ischemia. MacIntosh et al. (2010) adopted
ASL-CBF, ASL-ATT, CTP-CBF, and CTP-MTT images multi-delay pCASL in patients with acute ischemic stroke. They
were segmented into gray matter maps in Figure 5. ASL reported a representative patient with minor lacunar infarcts, and
shows hypoperfusion area of the left frontal, temporal and the patient showed obviously high signals on ATT images, which
Frontiers in Neuroinformatics | www.frontiersin.org 5 August 2021 | Volume 15 | Article 719719Xu et al. pCASL in Ischemic Patients
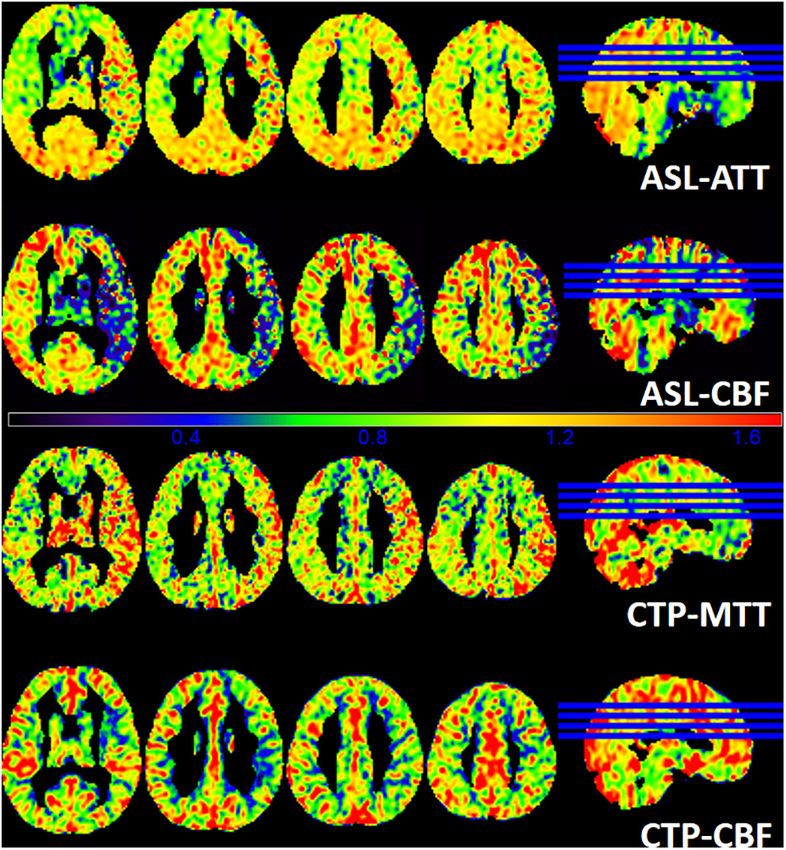
FIGURE 4 | A patient with left limb weakness for 9 days at admission. ASL-ATT, CTP-MTT, ASL-CBF, and CTP-CBF are normalized images and presented
consistent results. CTP shows decreased CTP-CBF and increased CTP-MTT in the right frontal, temporal and occipital lobes; ASL shows decreased ASL-CBF and
increased ASL-ATT of the right frontal, temporal and occipital lobes compare with the contralateral side. However, ASL-CBF shows focal intravascular signals and
low tissue perfusion in the right frontal, temporal and occipital lobes, which may indicate the status of collateral perfusion.
time between blood labeling and image acquisition (van der
Thiel et al., 2018). When the PLD is closer to the ATT, the CBF
value is closer to the cerebral blood flow under physiological
conditions. If the PLD cannot be adjusted in a timely manner,
some of the labeled blood fails to reach the acquisition level
due to delayed arrival, which may lead to underestimation of
the perfusion (Ferré et al., 2013). The International Society for
Magnetic Resonance in Medicine and the European Consortium
ASL in Dementia recommends that the PLD of adults with
cerebrovascular disease should be set to 2 s (Alsop et al.,
2015). When patients have severe cerebrovascular stenosis, the
ATT will be significantly prolonged because of flow deficits.
Therefore, 2 s may still result in underestimation of the CBF.
In recent years, a single PLD was generally employed in
most ASL studies, and the delay time was usually between
1.5 and 2 s (Chen et al., 2018; Jezzard et al., 2018). In
our study, a total of 6 PLDs between 1,000 and 3,500 ms
were adopted to improve the accuracy of cerebral perfusion
quantitative measurement in ischemic patients. However, the
multi-delay pCASL also has some limitations. As the delay
time increases, the scanning time will also increase, as will the
possibility of motion artifacts. Therefore, this imaging protocol
is suitable only for patients in a stable condition and with high
FIGURE 5 | A patient with 6 days of weakness in the right limb at admission.
levels of cooperation.
The images demonstrate the gray matter of ASL-ATT, ASL-CBF, CTP-MTT, In our study, we found a patient that presented focal
and CTP-CBF. ASL shows hypoperfusion area of the left frontal, temporal and intravascular signals and low tissue perfusion in the infarct
occipital lobes and basal ganglia. The ASL-CBF of the infarct regions regions. Recent clinical evaluations of ASL in cerebrovascular
decreases and the ASL-ATT increases compare to the contralateral side. CTP
disease have shown that focal intravascular signals and the
is in concordance with the result of ASL.
delayed arterial transmission of tissue hypoperfusion may
indicate the status of collateral perfusion (Chen et al., 2009;
Zaharchuk, 2011; Lou et al., 2017). Therefore, we speculate
was consistent with our findings. Consequently, we suggest that that another potential ability of multi-delay pCASL could be
the measurement of ATT helps to detect subtle ischemic lesions evaluating collateral flow through dynamic perfusion images.
in patients with stroke. Evaluating cerebral perfusion plays an important role in
In patients with ischemic stroke, ATT can be prolonged due determining treatment options for patients with ischemic stroke.
to intracranial artery stenosis. PLD is defined as the interval Some patients also need regular follow-up brain perfusion
Frontiers in Neuroinformatics | www.frontiersin.org 6 August 2021 | Volume 15 | Article 719719Xu et al. pCASL in Ischemic Patients
examinations to assess the treatment efficacy and make timely stroke. Due to the clinical feasibility and utility of multi-
adjustments. Up to present, few studies on multi-delay ASL have delay pCASL, it could potentially be used as part of a
been reported (Wang et al., 2013). Compared with traditional standard neuroimaging protocol for the management of
single PLD ASL, multi-delay pCASL allows for non-invasive ischemic stroke disease.
perfusion imaging and can provide more relevant clinical
information. Besides, we have increased the comparison of
patients at the acute phase, subacute phase, and chronic phase. DATA AVAILABILITY STATEMENT
The results showed a moderate to high correlation in different
periods of ischemic stroke patients between ASL and CTP, The raw data supporting the conclusions of this article will be
indicating the little effect of disease stage. In addition, a moderate made available by the authors, without undue reservation.
to high correlation of different age groups under the two
modalities was obtained. Therefore, we speculated multi-pCASL
could be used as an alternative imaging method for CTP. ETHICS STATEMENT
In this study, a total of 3 female patients were included,
far fewer than men. However, we calculated the correlation The studies involving human participants were reviewed and
coefficients of each subject under the two modalities. The results approved by the institutional review board of the First Affiliated
of the three ischemic female patients were basically consistent Hospital of Jinan University. The patients/participants provided
with the overall trend. Multi-delay pCASL is non-radiative and their written informed consent to participate in this study.
non-invasive, and can be combined with other MRI sequences,
such as anatomical imaging, vascular imaging, and diffusion
weighted imaging; thus, more imaging information can be
AUTHOR CONTRIBUTIONS
obtained during one examination.
CS and LL designed the study. XX was a major contributor
There are some limitations in our study. First, only 21
in writing the manuscript. ZT and MF contributed to collect
patients were enrolled in this study, but presented a relatively
the imaging and clinical data. XX, ZT, and MF performed
representative cohort of patients with ischemic stroke. Second,
data analysis and interpretation. MM, WF, JL, and ZX revised
gender bias should be excluded, as the female patients were
it critically for important content. All authors have read and
far fewer than male patients. Despite we calculated the
approved the manuscript.
correlation coefficients of each subject under the two modalities,
we will continue to include more female patients to verify
this conclusion. FUNDING
This work was supported by the Key Program of Natural
CONCLUSION Science Foundation of Guangdong Province of China (Grant No.
2018B0303110011), the Guangzhou Key Laboratory of Molecular
In conclusion, the present study showed moderate to high and Functional Imaging for Clinical Translation (Grant No.
significant correlations between perfusion parameters from 201905010003), and the Guangzhou External Science and
multi-delay pCASL and CTP imaging in patients with ischemic Technology Cooperation Program (Grant No. 201807010046).
REFERENCES Dai, W., Robson, P. M., Shankaranarayanan, A., and Alsop, D. C. (2012).
Reduced resolution transit delay prescan for quantitative continuous arterial
Alsop, D. C., Detre, J. A., Golay, X., Günther, M., Hendrikse, J., Hernandez- spin labeling perfusion imaging. Magn. Reson. Med. 67, 1252–1265. doi: 10.
Garcia, L., et al. (2015). Recommended implementation of arterial spin-labeled 1002/mrm.23103
perfusion MRI for clinical applications: a consensus of the ISMRM perfusion Ferré, J. C., Bannier, E., Raoult, H., Mineur, G., Carsin-Nicol, B., and Gauvrit,
study group and the European consortium for ASL in dementia. Magn. Reson. J. Y. (2013). Arterial spin labeling (ASL) perfusion: techniques and clinical use.
Med. 73, 102–116. doi: 10.1002/mrm.25197 Diagn. Interv. Imaging 94, 1211–1223. doi: 10.1016/j.diii.2013.06.010
Benjamin, E. J., Muntner, P., Alonso, A., Bittencourt, M. S., Callaway, C. W., Jezzard, P., Chappell, M. A., and Okell, T. W. (2018). Arterial spin labeling for
Carson, A. P., et al. (2019). Heart disease and stroke statistics—2019 Update: the measurement of cerebral perfusion and angiography. J. Cereb. Blood Flow
a report from the American heart association. Circulation 139:e0056-28. doi: Metab. 38, 603–626. doi: 10.1177/0271678X17743240
10.1161/cir.0000000000000659 Konstas, A. A., Goldmakher, G. V., Lee, T. Y., and Lev, M. H. (2009). Theoretic
Chen, J., Licht, D. J., Smith, S. E., Agner, S. C., Mason, S., Wang, S., et al. (2009). basis and technical implementations of CT perfusion in acute ischemic stroke,
Arterial spin labeling perfusion MRI in pediatric arterial ischemic stroke: initial part 1: theoretic basis. Am. J. Neuroradiol. 30, 662–668. doi: 10.3174/ajnr.A1487
experiences. J. Magn. Reson. Imaging 29, 282–290. doi: 10.1002/jmri.21641 Lin, L., Bivard, A., Krishnamurthy, V., Levi, C. R., and Parsons,
Chen, Y., Wang, D. J., and Detre, J. A. (2012). Comparison of arterial transit times M. W. (2016). Whole-brain CT perfusion to quantify acute ischemic
estimated using arterial spin labeling. Magma 25, 135–144. doi: 10.1007/s10334- penumbra and core. Radiology 279, 876–887. doi: 10.1148/radiol.20151
011-0276-5 50319
Chen, Z., Zhao, X., Zhang, X., Guo, R., Teeuwisse, W. M., Zhang, B., et al. (2018). Lou, X., Yu, S., Scalzo, F., Starkman, S., Ali, L. K., Kim, D., et al. (2017). Multi-
Simultaneous measurement of brain perfusion and labeling efficiency in a delay ASL can identify leptomeningeal collateral perfusion in endovascular
single pseudo-continuous arterial spin labeling scan. Magn. Reson. Med. 79, therapy of ischemic stroke. Oncotarget 8, 2437–2443. doi: 10.18632/oncotarget.
1922–1930. doi: 10.1002/mrm.26842 13898
Frontiers in Neuroinformatics | www.frontiersin.org 7 August 2021 | Volume 15 | Article 719719Xu et al. pCASL in Ischemic Patients MacIntosh, B. J., Lindsay, A. C., Kylintireas, I., Kuker, W., Günther, M., Robson, Wu, W. C., Fernández-Seara, M., Detre, J. A., Wehrli, F. W., and Wang, J. M. D., et al. (2010). Multiple inflow pulsed arterial spin-labeling reveals delays (2007). A theoretical and experimental investigation of the tagging efficiency in the arterial arrival time in minor stroke and transient ischemic attack. Am. J. of pseudocontinuous arterial spin labeling. Magn. Reson. Med. 58, 1020–1027. Neuroradiol. 31, 1892–1894. doi: 10.3174/ajnr.A2008 doi: 10.1002/mrm.21403 van der Thiel, M., Rodriguez, C., Giannakopoulos, P., Burke, M. X., Lebel, R. M., Xu, P., Liu, X., Zhang, H., Ghista, D., Zhang, D., Shi, C., et al. (2018). Assessment Gninenko, N., et al. (2018). Brain perfusion measurements using Multidelay of boundary conditions for CFD simulation in human. Biomech. Model. arterial Spin-labeling are systematically biased by the number of delays. Am. J. Mechanobiol. 17, 1581–1597. doi: 10.1007/s10237-018-1045-4 Neuroradiol. 39, 1432–1438. doi: 10.3174/ajnr.A5717 Zaharchuk, G. (2011). Arterial spin label imaging of acute ischemic stroke and Vilela, P., and Rowley, H. A. (2017). Brain ischemia: CT and MRI techniques in transient ischemic attack. Neuroimag. Clin. N. Am. 21, 285–301. doi: 10.1016/j. acute ischemic stroke. Eur. J. Radiol. 96, 162–172. doi: 10.1016/j.ejrad.2017.08. nic.2011.01.003 014 Zhang, H., Gao, Z., Xu, L., Yu, X., Wong, K., Liu, H., et al. (2018). Wang, D. J., Alger, J. R., Qiao, J. X., Gunther, M., Pope, W. B., Saver, J. L., A meshfree representation for cardiac medical image computing. IEEE et al. (2013). Multi-delay multi-parametric arterial spin-labeled perfusion MRI J. Transl. Eng. Health Med. 6:1800212. doi: 10.1109/JTEHM.2018.279 in acute ischemic stroke - comparison with dynamic susceptibility contrast 5022 enhanced perfusion imaging. Neuroimage Clin. 3, 1–7. doi: 10.1016/j.nicl.2013. 06.017 Conflict of Interest: The authors declare that the research was conducted in the Wang, H., Naghavi, M., Allen, C., Barber, R. M., Bhutta, Z. A., Carter, A., et al. absence of any commercial or financial relationships that could be construed as a (2016). Global, regional, and national life expectancy, all-cause mortality, potential conflict of interest. and cause-specific mortality for 249 causes of death, 1980–2015: a systematic analysis for the Global Burden of Disease Study 2015. Lancet 388, 1459–1544. Publisher’s Note: All claims expressed in this article are solely those of the authors doi: 10.1016/S0140-6736(16)31012-1 and do not necessarily represent those of their affiliated organizations, or those of Wang, R., Yu, S., Alger, J. R., Zuo, Z., Chen, J., Wang, R., et al. (2014). Multi-delay the publisher, the editors and the reviewers. Any product that may be evaluated in arterial spin labeling perfusion MRI in moyamoya disease–comparison with this article, or claim that may be made by its manufacturer, is not guaranteed or CT perfusion imaging. Eur. Radiol. 24, 1135–1144. doi: 10.1007/s00330-014- endorsed by the publisher. 3098-9 Wintermark, M., Maeder, P., Thiran, J. P., Schnyder, P., and Meuli, R. (2001). Copyright © 2021 Xu, Tan, Fan, Ma, Fang, Liang, Xiao, Shi and Luo. This is an Quantitative assessment of regional cerebral blood flows by perfusion CT open-access article distributed under the terms of the Creative Commons Attribution studies at low injection rates: a critical review of the underlying theoretical License (CC BY). The use, distribution or reproduction in other forums is permitted, models. Eur. Radiol. 11, 1220–1230. doi: 10.1007/s003300000707 provided the original author(s) and the copyright owner(s) are credited and that the Wintermark, M., Sesay, M., Barbier, E., Borbély, K., Dillon, W. P., Eastwood, J. D., original publication in this journal is cited, in accordance with accepted academic et al. (2005). Comparative overview of brain perfusion imaging techniques. practice. No use, distribution or reproduction is permitted which does not comply Stroke 36, e83–e99. doi: 10.1161/01.STR.0000177884.72657.8b with these terms. Frontiers in Neuroinformatics | www.frontiersin.org 8 August 2021 | Volume 15 | Article 719719
You can also read