A Country Level Analysis Comparing Hospital Capacity and Utilisation During the First COVID-19 Wave Across Europe
←
→
Page content transcription
If your browser does not render page correctly, please read the page content below
A Country Level Analysis Comparing Hospital
Capacity and Utilisation During the First COVID-19
Wave Across Europe
Elke Berger ( elke.berger@tu-berlin.de )
Technische Universität Berlin https://orcid.org/0000-0002-1932-6217
Juliane Winkelmann
Technische Universität Berlin: Technische Universitat Berlin
Helene Eckhardt
Technische Universität Berlin: Technische Universitat Berlin
Ulrike Nimptsch
Technische Universität Berlin: Technische Universitat Berlin
Dimitra Panteli
Technische Universität Berlin: Technische Universitat Berlin
Christoph Reichebner
Technische Universität Berlin: Technische Universitat Berlin
Tanja Rombey
Technische Universität Berlin: Technische Universitat Berlin
Reinhard Busse
Technische Universität Berlin: Technische Universitat Berlin
Research article
Keywords: COVID-19, hospital capacity, hospital utilisation, intensive care, ICU surge capacity
Posted Date: February 19th, 2021
DOI: https://doi.org/10.21203/rs.3.rs-251815/v1
License: This work is licensed under a Creative Commons Attribution 4.0 International License.
Read Full License
Page 1/18Abstract
Background: The exponential increase of SARS-CoV-2 infections during the first wave of the pandemic
created an extraordinary overload and demand on hospitals, especially on intensive care units (ICUs),
across Europe. European countries have taken different measures to surge ICU capacity, but little is
known on the extent. A country level analysis was conducted to compare hospitalisation rates of COVID-
19 patients in acute and intensive care and the levels of surge capacity for intensive care beds across 16
European countries and Lombardy region during the first wave of the pandemic (28 February to 31 July).
Methods: We used data on infection rates and numbers of current and/or cumulative COVID-19 patients
in acute and intensive care in 16 countries and Lombardy region to analyse the burden on hospitals
during the first wave of the COVID-19 pandemic. Data on COVID-19 hospitalisations was continuously
extracted since 20 March, 2020 from publicly available sources. To evaluate whether hospital capacities
were exceeded, we retrieved information on hospital and ICU surge capacity. Treatment days and mean
length of hospital stay were calculated to assess hospital utilisation by COVID-19 patients during the first
wave.
Results: Pre-pandemic hospital and ICU capacity varied widely across countries. In no studied country did
the utilisation of acute care bed capacity by COVID-19 patients exceed 38.3%. However, the Netherlands,
Sweden, and Lombardy would not have been able to treat all COVID-19 patients during the first wave
without ICU surge capacity. Indicators of hospital utilisation were not consistently related to the numbers
of SARS-CoV-2 infections. The mean number of hospital days associated with one SARS-CoV-2 case
ranged from 1.3 (Norway) to 11.8 (France).
Conclusion: In many countries, the increase of ICU capacity was important to accommodate the high
demand for intensive care during the first COVID-19 wave. Our study indicates that SARS-CoV-2 incidence
is not the only aspect when it comes to the burden of hospital care for COVID-19 but rather the utilisation
of hospital resources as shown by cumulative hospital days and mean length of stay during the first
wave. Indicators presented in this study could inform forecasting models, especially in regard to
necessary surge capacity.
Background
Health systems have faced substantial pressures related to the COVID-19 pandemic. The exponential
increase of SARS-CoV-2 infections in March and April, 2020, created an unprecedented demand on
hospitals in many European countries. On March 11, the bed occupancy in some hospitals in Italy
exceeded existing intensive care unit (ICU) capacities [1]. Shortly after, in late March, many Spanish
hospitals, especially in the capital city of Madrid, reported reaching their capacity limits of acute and/or
intensive care beds to adequately treat all COVID-19 patients requiring inpatient care [2]. Many hospitals
in other European regions (e.g. the Dutch region of Brabant and Grand Est in France) were also
overwhelmed with the influx of COVID-19 patients and transferred critically-ill patients to other hospitals
Page 2/18across the country or even neighbouring countries to free up capacity [3]. During the second wave starting
in autumn 2020, many countries face again rising hospital admission rates and substantial pressure on
hospital wards.
While recognising that many health systems have, at least in part, been overburdened during the first
wave, still little is known on the extent of hospital surge capacity created in acute and intensive care as a
response to COVID-19 accommodated the spike of patients and the actual use of hospital capacities
across European countries. However, to inform pandemic preparedness and contingency planning within
the hospital setting, information on capacities, both in terms of initial and reserve surge capacities, as
well as resource utilisation of COVID-19 patients is key [4]. Until the time of writing, existing studies only
report on hospital surge capacities in single countries [5] or hospitals [6]; to the best of our knowledge
there is no cross-country overview of additional surge capacity for COVID-19 patients. Furthermore,
evidence on COVID-19 patients’ length of stay in acute and intensive care is available only for a few
European countries [7–9].
This paper aims to analyse whether COVID-19 hospitalisations exceeded national ICU surge capacity
across 16 European countries and the Lombardy region during the first wave of the pandemic (28
February to 31 July). We complement this analysis with a comparison of the average length of stay and
the cumulative hospital days of COVID-19 patients across the countries. The latter is additionally
compared to the rate of SARS-CoV-2 infections. The findings aim to support health care decision makers
in refining contingency plans and improving hospital preparedness for future health emergencies.
Methods
Data collection and ethical considerations
This cross-country analysis is based on a broader data collection initiative encompassing data on 18
European countries and two Italian regions. Countries were included in the data collection of hospitalised
COVID-19 patients in acute and intensive care, which was kicked off on 20 March, 2020, once they
reported at least five positive cases per 100,000 population. Data stems from official online sources such
as websites of ministries of health, national research and public health institutes, official dashboards
from national institutions and Our World in Data (OWiD) [10]. The resulting database has been updated
daily since, and is made publicly available on the website of our institution [11] and the Harvard
Dataverse repository [12]. All authors were involved in the daily updates of data. The study only relies on
aggregated data that is publicly available; hence it does not contain individual level data and therefore
ethical considerations are not applicable.
Furthermore, the database was updated regularly to reflect values that some countries corrected
retrospectively (e.g. Norway, United Kingdom [UK]) (see supplemental tables 1–18, appendix pp 1–23).
Over time, some countries adjusted their data collection method, data reporting channel or the style of
reporting (i.e. Norway). If updated data was available retrospectively, we adjusted the collected data in
Page 3/18our database accordingly. The ECDC started to provide similar data on current hospital and ICU
occupancy for COVID-19 in several European countries as of summer 2020 [13].
Moreover, we retrieved information on the numbers of hospital beds prior to the pandemic from OECD [14]
and ICU beds prior to the pandemic from OECD/European Union [15]. Information on surge capacity of
ICU beds during the first wave was obtained from the COVID-19 Health System Response Monitor
(HRSM) [16], with some supplementary information from national sources. The HSRM tool was
established in March, 2020, and designed in response to the COVID-19 outbreak to collect and
disseminate up-to-date information on how countries, mainly in the WHO European Region, are
responding to the crisis, focused primarily on the responses of health systems.
Data description
For the data collected on hospitalised patients and patients in intensive care, definitions and reported
units differ between countries due to different data collection methods (see supplemental tables 1–18,
appendix pp 1–23). For most countries, information whether hospitalised COVID-19 cases represent
confirmed cases only, or confirmed and suspected cases combined is not available. Where both
confirmed and suspected cases were reported, we only retrieved data on confirmed cases. Furthermore,
data collection varies in regard to reason and trajectory of hospital admission, namely whether patients
were admitted only due to COVID-19 (and excluding other pathologies as well as transfers from other
hospitals, i.e. in Belgium) or comprise all hospitalised cases that tested positive for COVID-19 (i.e. in
Denmark and France). Moreover, some countries subsumed ICU patients in the total number of
hospitalised patients, while others did not (e.g. the Netherlands). To calculate the number of all currently
hospitalised patients we added up the numbers of inpatients treated in normal wards and in ICUs. The
definition of ICU cases is unclear in some countries, e.g. regarding the inclusion of patients in surveillance
beds. A detailed description of collected data, including sources, definitions, first or last date of reporting,
and collection method for each country (and region) can be found in the supplemental tables 1–18,
appendix pp 1–23.
Analysis
The presented analysis focuses on a subset of 16 European countries and one Italian region, for which
information on current hospitalisations and/or ICU treatments of COVID-19 patients for the period until 31
July, 2020, was available, i.e. Austria, Belgium, Denmark, Estonia, Finland, France, Germany, Greece,
Ireland, Italy (and the Lombardy region), Luxembourg, Netherlands, Norway, Portugal, Sweden, and UK.
Spain and Switzerland did not report on COVID-19 patients currently treated in acute and intensive care
and were therefore excluded from the analysis. Lombardy region was included as it had the highest
number of cases of COVID-19 in Europe and in the world during the early months of 2020 [17]. To allow
for a comparative analysis also for countries with incomplete daily reporting (e.g. no data on weekends),
single missing values for currently hospitalised patients were imputed linearly.
First, we present and compare hospital and ICU bed capacities prior to COVID-19 in 14 countries and
Lombardy region. In addition, we depict the additional ICU beds that were available during the surge for
Page 4/18the COVID-19 pandemic in 11 countries as reported in the HSRM and national sources.
Second, to analyse whether hospital capacities were exceeded, we plotted the number of currently
hospitalised COVID-19 patients per 100,000 population over time against the hospital bed capacities
before the pandemic and grouped countries with similar capacity levels. We followed the same approach
for ICU bed capacities, with an additional step of illustrating ICU surge capacity against the current
hospitalisation rates of COVID-19 patients in intensive care. Due to limited data availability, 11 countries
and Lombardy region were included in the analysis of acute bed capacities and nine countries and the
Lombardy region in the analysis of ICU surge capacities.
We calculated additional indicators to further illustrate COVID-19 related hospital utilisation. Cumulative
hospital days and cumulative ICU days were calculated by summing up the respective daily numbers of
current inpatients (representing the total number of bed occupancy days until 31 July, 2020). For
intensive care, this was done for all 16 countries plus the Lombardy region. With respect to acute care,
Greece and Sweden were excluded due to lack of data. The relation between bed occupancy days and
burden of SARS-CoV-2 infections was expressed as the mean number of hospital days, and ICU days per
infected case. The mean length of stay was approximated for hospital and ICU treatment by dividing the
number of bed occupancy days by the cumulative number of hospital and ICU treatment cases,
respectively; this could be done for eight countries for acute care and for six countries for intensive care.
Finally, we calculated the proportion of cumulative SARS-CoV-2 cases with hospital treatment and with
ICU treatment for the same countries. Supplemental table 19 (appendix, p 24) provides an overview of
countries included in each analysis.
Results
The pre-pandemic hospital and ICU capacity varied widely across the 14 countries with data available
ranging from 197 acute care beds per 100,000 in Sweden to 602 beds in Germany[14] and from 5.0 ICU
beds per 100,000 in Ireland (2016) and Sweden[15] to 33.4 ICU beds in Germany (2018)[18] (see Table 1).
There is thus a three-fold variation for acute care capacity and even a seven-fold variation for intensive
care bed capacity between the two ends of the spectrum in these countries prior to the COVID-19
pandemic.
Page 5/18Table 1
Pre-pandemic hospital capacity, ICU capacity and ICU surge capacity during the first COVID-19 wave
Country/ Acute care capacity ICU bed capacity Year ICU bed surge capacity
region bed prior to COVID-19 prior to COVID-19 during the first wave of
(2018) [14] COVID-19
in total per in total per in total per
100,000 100,000 100,000
Austria 47,276 535 2500a 28.9 2018 n/a n/a
[15]
Belgium 56,758 497 1993a 17.4 2019 ca. 2750 24 [16]
[15] (early April)a
Denmark 13,659 236 1078b 18.6c 2020 1242 (925 for 21.4c
[19] COVID-19
patients) [19]
Estonia 4444 336 200a 15.0 2019 130 for n/a
[15] COVID-19
patientsd [16]
Finland 15,667 284 300a 5.4 [15] 2019 n/a n/a
France 203,662 304 10,923a 16.3 2018 n/a n/a
[15]
Germany 497,182 602 27,463 33.4c 2018 32,824 (early 39.5c
[18] June) [20]
Greece 39,011 363 565a 5.3[15] 2019 1017 (350 for 9.5c
COVID-19
patients, end
of April) [16]
Ireland 13,560 279 250a 5.0 [15] 2016 489 (end of 10.0/16.3c
May) /up to
800 [21, 22]
Italy 156,216 259 5190a 8.6 [15] 2020 8550 [23] 14.0c
Lombardy 34,756 346 [24] 724 7.2c 2019 1347e [16] 13.4c
[24] [25]
Luxembourg 2251 370 n/a n/a n/a n/a n/a
Netherlands 46,323 269 1150a 6.7 [15] 2018 2400 (1 900 13.9
for COVID-19
patients) [26]
Norway 16,646 313 450 8.5 [15] 2018 up to 925 (or 17.4c
even 1200f) (22.5c)
[16]
Page 6/18Country/ Acute care capacity ICU bed capacity Year ICU bed surge capacity
region bed prior to COVID-19 prior to COVID-19 during the first wave of
(2018) [14] COVID-19
Portugal 33,850 329 587 5.7c n/a n/a n/a
[16]
Sweden 20,019 197 526 5.0c 2020 1064 (mid- 10.4c
[16] April) [16]
UK n/a n/a n/a n/a n/a n/a n/a
Notes: a: Own calculation based on ICU beds prior to COVID-19 per 100,000; b: Including 645 ICU beds
usually reserved for patients with elective surgery; c: Own calculation based on ICU beds prior to COVID-
19 in total; d: It is unclear, whether these beds were created additionally or reserved to patients with
COVID; e: Calculation based on information from HSRM that ICU bed capacity increased by 86%; f: On
April 15th the Regional Health Authorities provided detailed contingency plans on how to increase the ICU
capacity to 1200 beds, but underlined that such a capacity can only be sustained for a short period of
time.
Figure 1 further illustrates the association between acute care and ICU bed capacity for nine countries
and the Lombardy region: countries with high acute bed capacity tend to also have high ICU bed capacity.
Denmark seems to be an exception, with relatively high ICU bed capacities compared to lower acute
hospital bed capacity.
Sources
Acute care and ICU beds prior to COVID-19 pandemic [14] [15] and ICU beds during COVID-19 [16]; see
Table 1 for more information.
Notes
BE – Belgium, DE – Germany, DK – Denmark, GR – Greece, IE – Ireland, IT – Italy, IT-25 – Lombardy, NL—
The Netherlands, NO – Norway.
In response to the rapidly rising numbers of COVID-19 patients, countries have implemented different
strategies such as postponement of elective surgery or the setup of field hospitals to rapidly create
additional acute and ICU beds [27]. Some countries that did not see a critical increase of COVID-19 cases
and hospitalisations, such as Denmark, Estonia, and Norway, had contingency plans in place to reserve
surge capacity for extreme situations.
Figure 1 shows the number of ICU beds per 100,000 additionally created (or planned) during the first
wave, based on information reported in the COVID-19 HSRM and national sources (see also Table 1). In
Italy’s hard-hit Lombardy region (“IT-25” in Fig. 1), intensive care capacity nearly doubled since the start of
the COVID-19 crisis. Numbers of ICU beds were also significantly increased in Belgium, Germany, Greece,
Ireland, Italy, the Netherlands, and Sweden. According to Norway’s contingency plan, ICU capacity could
Page 7/18be more than doubled in an emergency situation. A similar increase of beds likely occurred in acute care,
but data was not consistently reported in the HSRM and country specific sources.
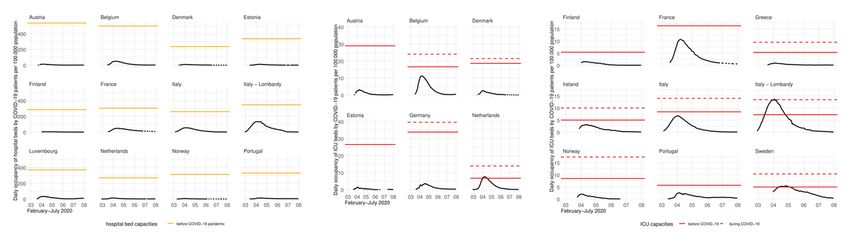
Figure 2A illustrates daily rates of hospitalised COVID-19 patients in regard to total available acute
hospital beds in 11 countries. It shows that pre-pandemic capacity of acute care beds was not exceeded
by COVID-19 hospitalisations in any of the included countries. In Lombardy region, the percentage of
acute care beds occupied by COVID-19 patients peaked at 38.3%, followed by Italy with 21.1%, while in
Austria the maximum was 2.3%.
In contrast, Fig. 2B plotting pre-pandemic capacity and surge capacity of ICU beds against daily rates of
COVID-19 patients in intensive care shows that i intensive care capacity prior to the pandemic was
exceeded by COVID-19-necessitated admissions in the Netherlands, Sweden, and the Lombardy region,
and that capacities were nearly surpassed in Belgium and Italy. In Lombardy and Sweden, for around five
weeks the demand for intensive care by COVID-19 patients exceeded pre-pandemic capacities, while the
shortage lasted around two weeks in the Netherlands. Only in Lombardy region surge capacity was fully
exhausted and even exceeded for one day (on 3 April, 2020).
Sources
OECD [14], among others; see Table 1 for detailed information.
Notes
February to July, 2020; black line – current COVID-19 hospitalisations per 100,000; orange line – rate of
hospital beds per 100,000.
Sources
ICU beds prior to COVID-19 pandemic – OECD/European Union [15], among others; ICU beds during
COVID-19 – COVID-19 HSRM [16], among others; see Table 1 for detailed information.
Notes
black line – current COVID-19 hospitalisations in intensive care per 100,000 (February to July, 2020); red
line – rate of ICU beds per 100,000 before the COVID-19 pandemic; red dashed line – rate of ICU beds per
100,000 during the COVID-19 pandemic.
Figure 3A reports the total number of days COVID-19 patients spent in acute and intensive care per
100,000 population (countries are sorted by cumulative COVID-19 incidence until 31 July, 2020). The
number of days COVID-19 patients were treated in acute and intensive care settings varied widely across
countries; until 31 July, the cumulative number of hospital days per 100,000 inhabitants ranged from 210
in Finland to 7762 in Lombardy (Italy) and the cumulative number of days in intensive care from 38 in
Page 8/18Greece to 678 in Lombardy, followed by France, Italy, and Belgium. For France, high numbers of hospital
and ICU treatment days were observed, while the reported overall SARS-CoV-2 incidence was
comparatively low. Other countries, like Ireland and Portugal, had a higher SARS-CoV-2 incidence but
notably lower numbers of hospital and ICU treatment days. The proportion of cumulative days spent in
intensive care in relation to cumulative days spent in normal wards ranged from 9% in Lombardy and
Estonia up to 38% in the Netherlands.
Notes
The cumulative incidence considers all cases of SARS-CoV-2 up to July 31, 2020. Cumulative hospital
days could not be calculated for Sweden and Greece as they did not report daily numbers of current
hospitalisations. Norwegian data of current ICU treatments were only available until June 19. Cumulative
SARS-CoV-2 incidence in Luxembourg includes cases among the resident and non-resident population.
Notes: 3B: Mean length of stay was approximated for hospital treatment by dividing the daily numbers of
current hospitalisations (representing bed occupancy days) by the cumulative number of hospital cases.
For Germany, actual mean length of stay was obtained from national hospital discharge data. 3C: Mean
length of ICU stay was approximated by dividing the daily numbers of current ICU treatments
(representing ICU bed occupancy days) by the cumulative number of ICU treatment cases. Norwegian
data of current ICU treatments were only available until 19 June, 2020.
Figures 3B and 3C depict the share of COVID-19 patients treated in acute and intensive care settings, the
mean lengths of stay and the mean number of hospital and ICU treatment days per SARS-CoV-2 case,
with the latter determining the order of countries in the figures. The left side displays the number of
COVID-19 patients treated in hospitals and ICUs as a share of all SARS-CoV-2 cases until 31 July and the
right shows the mean lengths of hospital stay of COVID-19 patients.
The mean number of hospital days associated with one SARS-CoV-2 case ranged from 1.3 (Norway) to
11.8 (France). The proportion of all SARS-CoV-2 cases that received inpatient treatment ranged from 11%
(Norway) to 57% (France). The mean length of hospital stay varied from 8 days (UK) to 21 days (France).
The mean number of ICU days associated with one SARS-CoV-2 case ranged from 0.3 (Ireland) to 1.1
(Netherlands). The proportion of SARS-CoV-2 cases with ICU treatment ranged from 1.7% (Ireland) to
5.4% (Germany and the Netherlands). The mean length of ICU stay varied from 13 days (Germany) to 21
days (UK).
Discussion
To the best of our knowledge, this study is the first cross-country overview of hospitalisations associated
with COVID-19 patients, and additionally created intensive care resources. Our results indicate that the
pre-pandemic hospital capacities varied widely between countries included in the analysis. Irrespective of
their starting point, countries have taken several measures to boost ICU capacity during the first wave of
Page 9/18the pandemic to meet the spike in demand for hospital care, although to a different extent. The highest
increase of ICU beds was achieved in Ireland, the Netherlands, and Sweden where capacity doubled
compared to pre-COVID levels. Lombardy region and Greece also increased their initial capacity of ICU
beds by 86% and 80%, and Italy and Belgium by 65% and 38%, respectively. In contrast, Germany
increased its ICU capacity only by 20% which is likely to be linked to its high initial capacity of ICU beds.
While countries faced different numbers of confirmed SARS-CoV-2 infections, available capacities of
acute care beds were not exceeded by COVID-19 patients in the included countries. However, our analysis
shows that the Netherlands and Sweden would not have had sufficient capacity to treat all COVID-19
patients requiring intensive care without ICU surge capacity. In the Lombardy region ICU surge capacity
was even exceeded.
Our calculations of hospital indicators showed that COVID-19-related hospital utilisation varied widely
across the countries included. We observed a large difference of the number of cumulative treatment
days of COVID-19 patients in acute and intensive care settings and could not reveal a consistent relation
to the incidence ofSARS-CoV-2. This suggests that SARS-CoV-2 incidence alone is not the driving force
for the utilisation of acute and intensive hospital care but many other factors such as demographics of
SARS-CoV-2 cases and testing strategies may play an important role. For example, the true number of
persons infected with SARS-CoV-2 might be underestimated, depending on different testing strategies
across countries [28].
Consequently, the mean number of hospital days per SARS-CoV-2 case varied from 1.3 (Norway) to 11.8
(France), and the number of ICU days per infected case varied from 0.3 (Ireland) to 1.1 (Netherlands).
These figures may serve as basic landmarks for forecasting capacity requirements to meet surge
demand. In Belgium, for example, based on the data from March to July, 2020, 1000 additional infections
would cause on average a need of 3800 hospital bed days (mean days per case 3.8) and 800 ICU bed
days (mean days per case 0.80).
The study has several limitations, which should be acknowledged, before discussing its usefulness e.g.
for forecasting hospital capacity requirements. First, information on the timing of surge capacity in a
country, including when it started, how quickly it scaled up, and if/when it scaled down, is uncertain. This
is related to the fact that the level of information reported in the HSRM is not systematically harmonised
across countries. Second, there are some uncertainties regarding data quality and data completeness
within countries, both related to data on hospital utilisation and information reported on HSRM. Third,
non-COVID-19 patients requiring acute or intensive care were not included in our analysis, which should
be taken into consideration to comprehensively esteem the full burden on hospitals during the first wave.
Fourth, with the exception of the Lombardy region, this study is a country-level analysis and does not
consider the geographic distribution of hospital capacity, COVID-19 admissions and patterns of hospital
utilisation; there might have been periods of time where ICUs were overloaded in certain regions within a
country which are not reflected by our data. We show that this was the case for Lombardy, while it was
not the case for Italy as a whole. Along that line our data does not allow to identify whether single
Page 10/18hospitals’ capacities were exceeded. Mateen et al. [29], for example, reported that hospital capacities of
one third of all hospitals in England were exceeded during the first COVID-19 wave. Fifth, the focus of our
study is on hospital bed capacities without considering capacities of health professionals and medical
equipment such as PPE (personal protective equipment) and ventilators that are necessary to keep surge
capacities for COVID-19 patients operational. Any decision on planning capacity should take these
aspects into account [4]. Sixth, there is no disaggregation both on data related to intensive care capacity
and utilisation, i.e. low, high or intermediate care. Hence, there may be differences in the notion of
intensive care influencing the comparability of the data. Further, the informative value of our data in
regard to length of hospital stay of COVID-19 patients is limited, as we could only approximate the mean
length of stay instead of calculating the median which was reported in the majority of existing studies [7,
8]. Last, comparability of data across countries is limited, e.g., due to different data collection methods
and definitions of variables, such as hospitalised COVID-19 patients, which in some countries also
include unconfirmed cases, or the numbers of SARS-CoV-2 cases (in some countries confirmed only by
PCR tests, in others also by antibody tests, see supplemental tables 1–18, appendix pp 1–23).
However, when comparing our data to published literature our findings appear to be plausible. For
example, the Norwegian ICU registry reports an average length of stay of 17 days in October, 2020 [30],
which is similar to our data from 19 June (latest available date in our database) showing that patients
spent on average 16 days in the ICU, with the variation likely related to the different time of measurement.
Further, data from OECD/European Union [15] reported ICU occupancy levels of 78% in Italy at the height
of the outbreak, which is comparable with our data, where this proportion was about 80%. However, they
only relate the number of patients requiring intensive care to the initial number of ICU beds. Taking surge
capacity into account, the number of ICU beds occupied by COVID-19 patients drops to 48%. This shows
the importance of surge capacity, which is highlighted in our analysis.
Further, the observed COVID-19-related hospital utilisation varied widely. Indicators of hospital utilisation,
such as the share of hospitalisations among SARS-CoV-2 cases, or cumulative treatment days revealed
no consistent relation with the number of persons infected with SARS-CoV-2. This suggests that SARS-
CoV-2 incidence alone is not decisive for the utilisation of acute and intensive hospital care. The true
number of persons infected with SARS-CoV-2 might be underestimated to a greater or lesser extent,
depending on different testing strategies across countries [28].
Consequently, the mean number of hospital days per SARS-CoV-2 case varied from 1.3 (Norway) to 11.8
(France), and the number of ICU days per infected case varied from 0.3 (Ireland) to 1.1 (Netherlands).
These figures may serve as basic landmarks for forecasting capacity requirements to meet surge
demand. In Belgium, for example, based on the data from March to July, 2020, 1000 additional infections
would cause on average a need of 3800 hospital bed days (mean days per case 3.8) and 800 ICU bed
days (mean days per case 0.80).
Data on available hospital resources combined with their utilisation is crucial to inform health care
decision makers [31] over the course of the COVID-19 pandemic, but also for upcoming public health
Page 11/18crises, e.g. by integrating indicators presented in this study into forecasting models. Finland, Norway, and
Sweden [32], as well as the Netherlands and the UK (England, Wales, Northern Ireland) have a long
tradition of ICU registries [33] and were therefore able to strictly monitor the daily situation during the
pandemic, which is key for reacting in a timely manner. Other countries, such as Germany [20], set up ICU
registries only after the pandemic had emerged.
Overall, European countries experienced hospital capacity utilisation differently. This underlines the
importance of data collection and monitoring for planning authorities. Generally, being overprepared in
extreme situations might be preferable over risking overwhelmed capacities. This is substantiated by
recent work that indicates a higher mortality of COVID-19 patients in an area without access to intensive
care [34].
Conclusion
Our study indicates that SARS-CoV-2 incidence is not the only aspect during the first COVID-19 wave
when it comes to the burden of hospital care for COVID-19 but rather the utilisation of hospital resources
as shown by cumulative hospital days and mean length of stay. Hospital resource utilisation also
depends on demographics of infected population groups, treatment pathways, service delivery patterns
including reimbursement policies, public health strategies and the number of hospital beds and ICU beds
within a health system. The presented data might contribute to preparedness activities, such as
forecasting surge capacity demand for the ongoing or a coming pandemic. In countries with low ICU
capacities where pre-pandemic ICU capacities were exceeded, it might be useful to consider strategies for
reserving ICU beds for future health emergencies. Upcoming studies on hospital utilisation during the
second wave of the pandemic might add additional findings that will further contribute to preparedness
activities, aiming to cope with future occurrences of unpredicted large-scale needs in acute health care.
Abbreveations
BE Belgium
DE Germany
DK Denmark
GR Greece
HSRM Health System Response Monitor
ICU Intensive Care Unit
IE Ireland
IT Italy
Page 12/18IT-25 Lombardy
NL The Netherlands
NO Norway
OWiD Our World in Data
PPE Personal Protective Equipment
UK United Kingdom
Declarations
Ethics approval and consent to participate: The study only relies on aggregated data that is publicly
available; hence it does not contain individual level data and therefore ethical considerations are not
applicable.
Consent for publication: Not applicable.
Availability of data and materials: The data that support this study was collected by the authors of the
manuscript from multiple sources that are publicly available. The dataset generated and analysed during
the current study are available in the Harvard Dataverse repository, accessible at
https://doi.org/10.7910/DVN/02CFBB.
Competing interests: EB, JW, HE, UN, CR, TR, DP and RB report grants from Ministry of Education and
Research (BMBF) and the federal state of Berlin, during the conduct of the study. UN receives funding
from the German Research Foundation. DP started working for the European Observatory on Health
Systems and Policies on 1 October, 2020, a partnership hosted by the World Health Organization. The
submitted work has been independent from this relationship. RB reports grants from Federal Ministry of
Research and Education, grants from World Health Organization, grants and other from Federal Ministry
of Health, grants from Innovation Fund, outside the submitted work.
Funding: The study was part of a project of the Berlin University Alliance, funded by the Ministry of
Education and Research (BMBF) and the federal state of Berlin (112_PreEP_Corona). The funders of the
study had no role in study design, data collection, data analysis, data interpretation, writing of the report,
or the decision to submit the paper for publication.
Authorsʼ contributions: EB, JW and RB conceived the study and its design. UN, HE, DP, CR and TR
contributed ideas and feedback to the conceptualisation of the study. EB, JW, HE and UN contributed to
data analysis and wrote the main draft of the manuscript. EB, JW, HE UN, CR, TR and DP contributed to
acquisition and curation of data. RB and DP contributed to critical revision of the report and study
supervision. All authors critically revised and approved the manuscript.
Page 13/18Acknowledgments: Institutional support and physical resources were provided by the Technische
Universität Berlin. Erin Webb was responsible for language editing and proof-reading.
References
1. Verelst F, Kuylen E, Beutels P. Indications for healthcare surge capacity in European countries facing
an exponential increase in coronavirus disease (COVID-19) cases, March 2020. Euro Surveill 2020.
doi:10.2807/1560-7917.ES.2020.25.13.2000323.
2. Jones S. Spanish minister says older people found 'dead and abandoned'. 23 March, 2020.
https://www.theguardian.com/world/2020/mar/23/spain-distributes-650000-testing-kits-as-
coronavirus-deaths-rise-steeply. Accessed 24 Nov 2020.
3. Winkelmann J, Scarpetti G, Hernandez-Quevedo C, van Ginneken E. How do the worst-hit regions
manage COVID-19 patients when they have no spare capacity left? 2020.
https://analysis.covid19healthsystem.org/index.php/2020/04/24/how-do-the-worst-hit-regions-
manage-covid-19-patients-when-they-have-no-spare-capacity-left/. Accessed 8 Dec 2020.
4. World Health Organization. Beyond Containment: Health systems responses to COVID-19 in the
OECD; 2020.
5. McCabe R, Schmit N, Christen P, D'Aeth JC, Løchen A, Rizmie D, et al. Adapting hospital capacity to
meet changing demands during the COVID-19 pandemic. BMC Med. 2020;18:329.
doi:10.1186/s12916-020-01781-w.
6. Carenzo L, Costantini E, Greco M, Barra FL, Rendiniello V, Mainetti M, et al. Hospital surge capacity in
a tertiary emergency referralcentre during the COVID-19 outbreak in Italy. Anaesthesia. 2020:928–34.
doi:10.1111/anae.15072.
7. Lane EA, Barrett DJ, Casey M, McAloon CG, Collins ÁB, Hunt K, et al. Country differences in
hospitalisation, length of stay and admission to Intensive Care Units due to SARS-CoV-2 infection: a
rapid review of available literature (preprint). medRxiv 2020. doi:10.1101/2020.05.12.20099473.
8. Rees EM, Nightingale ES, Jafari Y, Waterlow NR, Clifford S, Pearson B. CA, et al. COVID-19 length of
hospital stay: a systematic review and data synthesis. BMC Med. 2020;18:270. doi:10.1186/s12916-
020-01726-3.
9. Karagiannidis C, Mostert C, Hentschker C, Voshaar T, Malzahn J, Schillinger G, et al. Case
characteristics, resource use, and outcomes of 10 021 patients with COVID-19 admitted to 920
German hospitals: an observational study. The Lancet Respiratory Medicine. 2020.
doi:10.1016/S2213-2600(20)30316-7.
10. Our World in Data (OWiD). Coronavirus Pandemic (COVID-19). 2020.
https://ourworldindata.org/coronavirus. Accessed 18 Dec 2020.
11. Department of Health Care Management (MiG). COVID-19-STATS. 2020. https://www.mig.tu-
berlin.de/fileadmin/a38331600/sonstiges/COVID-19-STATS_2007_22.pdf. Accessed 18 Dec 2020.
Page 14/1812. Winkelmann J, Berger E, Busse R, Nimptsch U, Reichebner C, Eckhardt H, et al. COVID-19
Hospitalisation, cases and tests in 18 European countries. 2021.
https://dataverse.harvard.edu/dataset.xhtml?persistentId=doi:10.7910/DVN/02CFBB. Accessed 28
Jan 2021.
13. European Centre for Disease Prevention and Control (ECDC). Data on hospital and ICU admission
rates and current occupancy for COVID-19. 2021. https://www.ecdc.europa.eu/en/publications-
data/download-data-hospital-and-icu-admission-rates-and-current-occupancy-covid-19. Accessed 26
Jan 2021.
14. OECD. Hospital beds; Curative (acute) care beds. 2020. https://stats.oecd.org/Index.aspx?
ThemeTreeId=9#. Accessed 26 Nov 2020.
15. OECD/European Union. Health at a Glance: Europe 2020: State of Health in the EU Cycle. Paris:
OECD; 2020.
16. COVID-19 Health System Response Monitor (HSRM). COVID-19 Health System Response Monitor.
2020. https://www.covid19healthsystem.org/mainpage.aspx. Accessed 26 Nov 2020.
17. Cereda D, Tirani M, Rovida F, Demicheli V, Ajelli M, Poletti P, et al. The early phase of the COVID-19
outbreak in Lombardy, Italy. The Lancet. 2020;396:e86–7. doi:10.1016/S0140-6736(20)32154-1.
18. Statistisches Bundesamt. Grunddaten der Krankenhäuser: 2018; 2020.
19. Sundhedsstyrelsen. Håndtering af COVID-19: Prognose og kapacitet i Danmark for intensiv terapi;
2020.
20. Intensivregister DIVI. 2020. https://www.intensivregister.de/#/index. Accessed 8 Dec 2020.
21. HSE. COVID19 Daily Operations Update. 2020.
https://www.hse.ie/eng/services/news/newsfeatures/covid19-updates/covid19-daily-operations-
update-2000-29-may-2020.pdf. Accessed 9 Dec 2020.
22. HSE. COVID-19 Committee Meeting Tuesday 2 June 2020. 2020.
https://www.hse.ie/eng/services/news/media/pressrel/covid-19-committee-meeting-tuesday-2-june-
2020.html. Accessed 9 Dec 2020.
23. Piantoni V. After years of cuts, Italy is set to double the number of ICU beds in response to Covid-19.
2020. https://www.lastampa.it/esteri/la-stampa-in-english/2020/05/07/news/after-years-of-cuts-
italy-is-set-to-double-the-number-of-icu-beds-in-response-to-covid-19-1.38815375. Accessed 9 Dec
2020.
24. Eurostat. Hospital bed by NUTS2 regions. 2020.
https://ec.europa.eu/eurostat/databrowser/view/hlth_rs_bdsrg/default/table?lang=en. Accessed 18
Dec 2020.
25. Ministero della Salute. Open data. 2019.
http://www.dati.salute.gov.it/imgs/C_17_dataset_96_0_upFile.csv. Accessed 26 Nov 2020.
26. Lailor A. Number of ICU beds needed will decrease to normal levels by 1 May, OMT expects. 2020.
https://dutchreview.com/news/number-of-icu-beds-needed-will-decrease-to-normal-levels-by-1-may-
omt-expects/. Accessed 9 Dec 2020.
Page 15/1827. Phua J, Weng L, Ling L, Egi M, Lim C-M, Divatia JV, et al. Intensive care management of coronavirus
disease 2019 (COVID-19): challenges and recommendations. The Lancet Respiratory Medicine.
2020;8:506–17. doi:10.1016/S2213-2600(20)30161-2.
28. Raftery AE, Currie J, Bassett MT, Groves R. Evaluating Data Types: A Guide for Decision Makers using
Data to Understand the Extent and Spread of COVID-19. Washington, D.C.: National Academies
Press; 2020.
29. Mateen BA, Wilde H, Dennis Jm, Duncan A, Thomas NJM, McGovern AP, et al. A geotemporal survey
of hospital bed saturation across England during the first wave of the COVID-19 Pandemic (preprint).
medRxiv 2020. doi:10.1101/2020.06.24.20139048.
30. Borgan E. Norwegian COVID-19 patients: Physicians surprised by length of stay on ventilators. 2020.
https://sciencenorway.no/covid19-epidemic-medical-procedures/norwegian-covid-19-patients-
physicians-surprised-by-length-of-stay-on-ventilators/1753844. Accessed 25 Nov 2020.
31. World Health Organization. Critical preparedness, readiness and response actions for COVID-19.
2020. https://apps.who.int/iris/rest/bitstreams/1283590/retrieve. Accessed 9 Dec 2020.
32. Strand K, Walther SM, Reinikainen M, Ala-Kokko T, Nolin T, Martner J, et al. Variations in the length of
stay of intensive care unit nonsurvivors in three Scandinavian countries. Crit Care. 2010;14:R175.
doi:10.1186/cc9279.
33. Walther SM, Karlström G. National ICU registries. In: Guidet B, Valentin A, Flaatten H, editors. Quality
Management in Intensive Care: A Practical Guide: Cambridge University Press; 2016. p. 195–203.
34. Bauer J, Brüggmann D, Klingelhöfer D, Maier W, Schwettmann L, Weiss DJ, Groneberg DA. Access to
intensive care in 14 European countries: a spatial analysis of intensive care need and capacity in the
light of COVID-19. Intensive Care Med 2020. doi:10.1007/s00134-020-06229-6.
Figures
Page 16/18Figure 1
Hospital and ICU capacity before COVID-19 and ICU surge capacity created for COVID-19 (per 100,000)
Figure 2
A Occupancy of hospitalised COVID-19 patients and pre-pandemic hospital bed capacity (per 100,000) B
Occupancy of COVID-19 patients in ICU and pre-pandemic and surge ICU capacity created for COVID-19
(per 100,000)
Page 17/18Figure 3
A Cumulative hospital days and ICU days of COVID-19 patients (per 100,000) B and Figure 3C Indicators
on hospital utilisation of COVID-19 patients in acute and intensive
Supplementary Files
This is a list of supplementary files associated with this preprint. Click to download.
SupplementalTable119.pdf
Page 18/18You can also read