AI @ Edge IEEE CIC 2018 Tutorial - Mudhakar Srivatsa Distinguished Research Staff Member IBM TJ Watson Research Center
←
→
Page content transcription
If your browser does not render page correctly, please read the page content below

AI @ Edge
IEEE CIC 2018 Tutorial

Mudhakar Srivatsa
Distinguished Research Staff Member
IBM TJ Watson Research Center
Data at the edge is causing us to rethink data

                               20 EB per day of data generated at
                                            the edge
                                                            Page – 2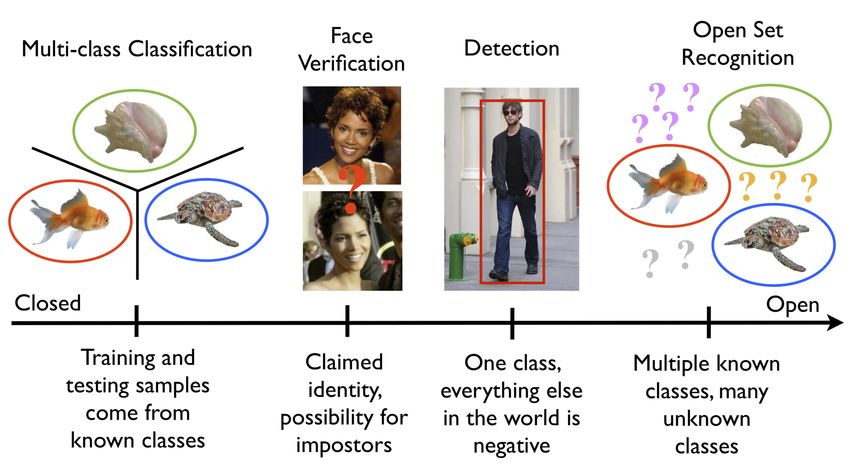
Data at the edge is causing us to rethink data

    90%                                   2x
    Of data created over the              Rate of data creation compared
    last 10 years was never               to the expansion of bandwidth
    captured or analyzed                  over the past decade

    60%                                   in 2017
    Of valuable sensory data loses        The collective compute and
    value in milliseconds                 storage capacity of smartphones
                                          surpassed all worldwide servers

                                                                            Page – 3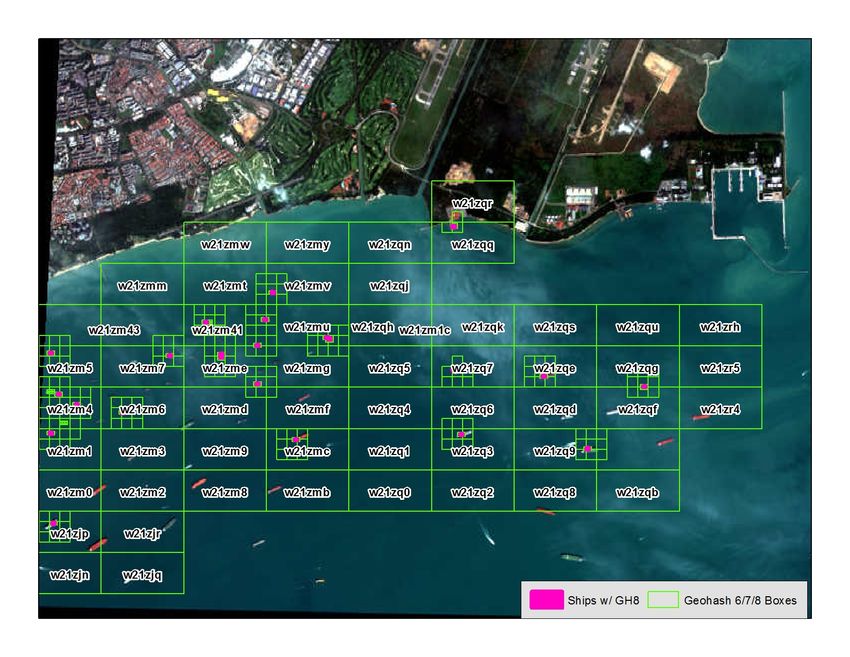
Collective compute and storage at the edge
exceeds that in the cloud

Compute Capacity in Trillion CPU Marks                  Storage Capacity in Exabytes (1018)

6                                                 800
5                                                 700
                                                  600
4
                                                  500
3                                                 400
2                                                 300
                                                  200
1
                                                  100
0                                                   0
    2013 2014 2015 2016 2017 2018                       2014       2016   2018     2020

                                    Smartphones          Servers
A new IT paradigm is emerging at the edge

                                            Page – 5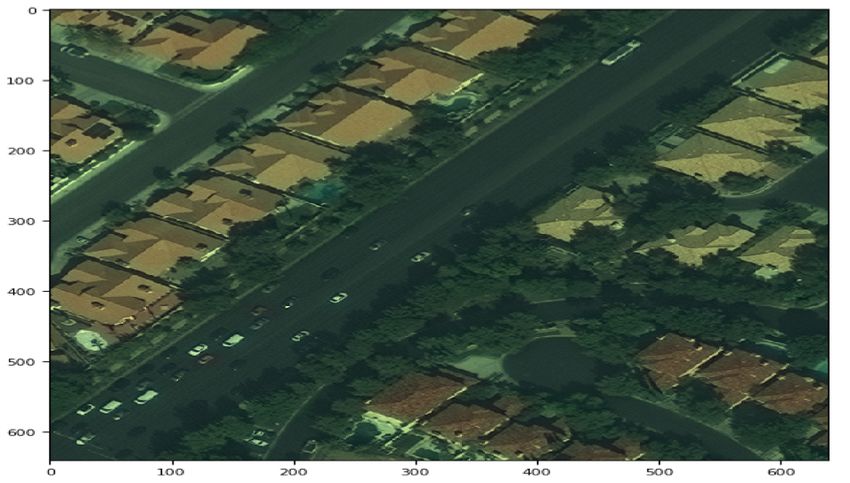
But many
IoT       IT and faces
    environment   IoT environments have a challenge
                       some key challenges

Bandwidth                                 Regulations
Connectivity to cloud is too slow         Some data is restricted
or intermittent

Cost                                      Privacy
Sending data to cloud is expensive        Some data is too sensitive
                                                                       Page – 6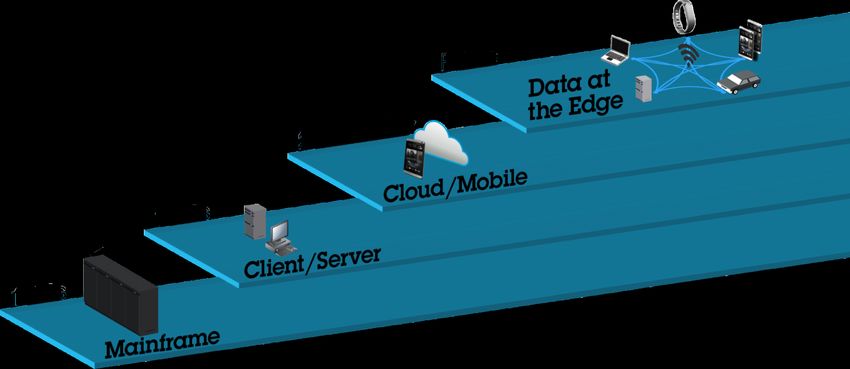
Drivers for edge computing in IoT

      Reduced Latency & Increased Local Control
      • e.g. Vehicle-to-vehicle navigation and collision                                     An independent research shows Edge + Cloud computing can
        avoidance; make instant adjustments                                                  significantly reduce costs over the Cloud-only option

      Optimization for Lower Costs
      • e.g. large volume of data from oil rigs or video
        cams that’s requires significant bandwidth and
        storage

      Improved Security or Privacy
      • e.g. Distributed risk in edge versus single point
        of failure in Cloud
      • e.g. Localized scanning for early detection &
        mitigation of potential data breaches
      • e.g. video surveillance data that cannot be
        saved

 Source: Frost & Sullivan, “Reaching out to the Edge: Defining distributed intelligence in IoT. Dec. 2015
 http://wikibon.com/the-vital-role-of-edge-computing-in-the-internet-of-things/                                                            Page – 7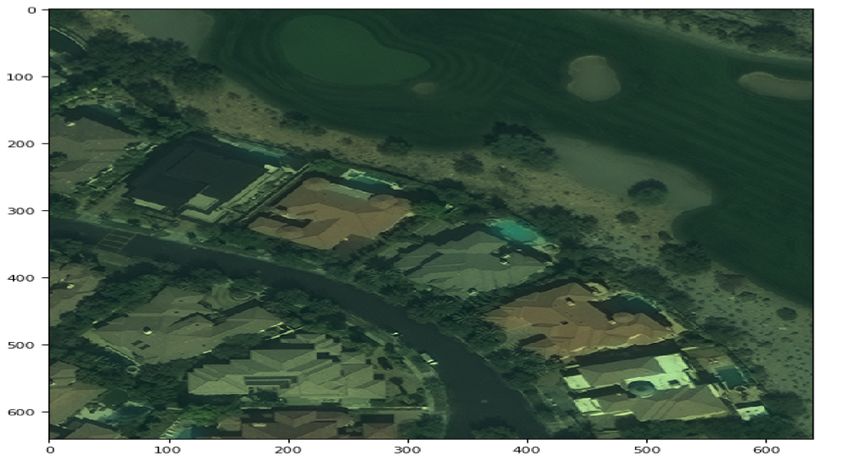
Top Edge Computing Use Cases – Methodology for Selection

                                           CRITERIA                      Requires Edge
        SOURCE DATA                                                      (11 use cases)
                              1. Require real time decision
                                 without latency, e.g. Act on
                                 vehicles or planes in motion
      46 IoT use cases*                                                 Some dependency
                              2. Large requiring significant                 on Edge
     Source: IDC Worldwide       bandwidth or too costly to               (11 use cases)
     Semiannual Internet of      transmit back to cloud, e.g.
                                 Intelligent Oil field / drilling rig
     Things Spending Guide
                              3. Security or privacy
                                 requirements on the edge
                                                                        Edge not required
                                                                         (24 use cases)

About half of IoT market-size requires edge or has a dependency on edge
                                                                                          Page – 8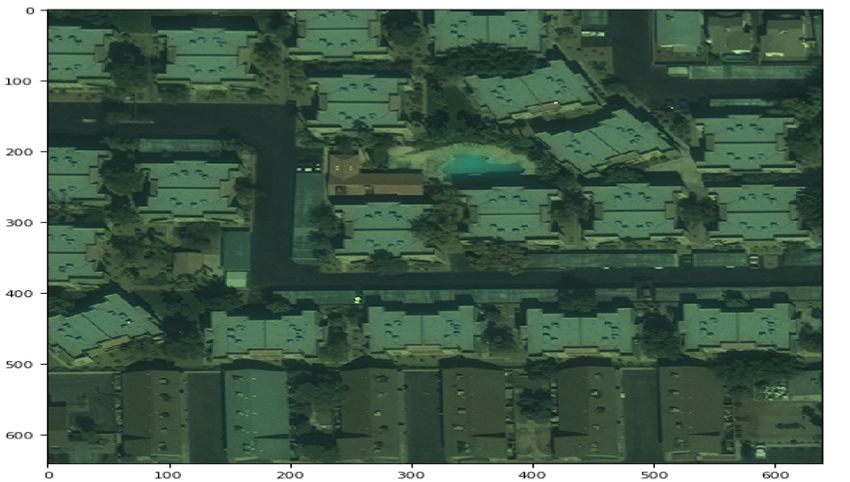
AI @ Edge: Research Challenges
“Despite the power to process massive volumes of data and derive insightful insights,
artificial intelligence applications have one major drawback - the brains are located
thousands of miles away”

                                                                                Page – 9
The current prevalent model for creating AI based solution

          A Central Location (Cloud/Data Center)                   Enterprise Edge:
                                                                 Data Sources/Sensors
       Da
         ta

                                               Data
                    Learn
                                                                      Act
                         h                     Da
                       Model

                                                 ta

                     Infer
                                                                      Act

                                                                        Enterprise Edge
                                                                     Data Sources/Sensors
Regulations, Privacy Concerns, Network costs, Latency, Bandwidth Constraints are a hurdle for AI
Solutions in many contexts.                                                                Page – 10
AI @ Edge: Semi-distributed Model
A Central Location (Cloud/Data Center) Enterprise Edge
Data
Da
ta
Infer Act
Data
Learn
Infer Act
As an intermediate stage, use the cloud to train the AI models, but move models out to the edge
for inferences and action.
Page – 11AI @ Edge: Fully Distributed Model
A Central Location (Cloud/Data Center) Enterprise Edge
Data
Da Learn
ta
Infer Act
Learn
Coordi Coordinate
Data
Learn
Infer Act
Learning happens at many different locations, and different locations coordinate the models they
learn with each other
Page – 12AI @ Edge Challenge I – Search Engine
• Deep learning models require large labeled training datasets: “small data” problem at the edge!
• Given a dataset, the first step is to bootstrap with a pre-trained model and customize this
model for the given application: often manual, error prone and cumbersome
• There is no “search engine” for searching and ranking machine learning models for a given
input dataset!
• Ranking needs to capture partial match (match up to ith layer), estimated cost of
retraining (compute resources and labelled data requirement)
• Deep hash codes: a reduces the dimensionality of high-dimensional data by inducing hash
collisions on similar inputs; use deep hash codes to fingerprint output (activations) from each
layer in a trained network
Hash Code Method Data Domain Supervised
Latent Semantic Hashing [SH2009] Text No
Autoencoder [VLLBM2010] Text, Images No
Restricted Boltzmann Machine [TFW2008] Text, Images No
Tailored Feed-Forward Neural Network Text, Images Yes
[MBBPS2014]
Deep Hashing [LLWMZ2015] Image No
Convolutional autoencoders [XPLLY2014] Image Yes
Deep Semantic Ranking Hash [ZHWT2015] Image Yes
Deep Neural Network Hashing [LPLY2015] Image Yes
Word2Vec [MCCD2013] Text No
Node2Vec [GL2016] Graph No
Page – 13Ranking Machine Learning Models
1. Compute a compact layer-by-layer setch of the trained model
• For every training data x, compute clusters over h(x) (e.g., using k-means++ clustering)
• Sketch: (ci, wi) where ci is the ith cluster head and wi is its silhouette coefficient
• Store the sketch and the hash function h along with the pre-trained model
2. Compute the sketch of the testing/input data
• Same as (1) but seed the clustering algorithm with cluster heads obtained from (1)
3. For every pre-trained model in the catalog compute its rank using distance(wi, wi’)
• Sum of (wi - wi’)2 over all i (does not account for cluster size)
• Wasserstein distance (Earth Mover Distance) to account for cluster sizes
4. Combine this score with a page-rank like score over the dependency graph of
trained models
• Edge (a à b): model b was retrained from model a, and the weight of this directed edge is
obtained from step 3
Page – 14Process Flow
5. Use a highly ranked
1. Catalog a model model as the seed
Cloud with a sketch of model for
training data and customization and re-
the hash function training
Hash function
Sketch
2. Use the cloud
3. Compute distance 4. Rank models from
provided hash code
between training the catalog using the
function to compute
data’s sketch and computed distance
User a sketch of testing
testing data’s sketch measure
data
Multiple realizations of the process flow are possible: above shows a workflow where the
training data is never released to the user (only its sketch is shared) and the testing data is
held private until a suitable model is discovered in the catalog Page – 15AI @ Edge Challenge I – Open Sets Problem
• Typical setting: model is trained at the cloud using labeled dataset; the trained model is
scored at an (unattended) edge
• Adapt and customize a pre-trained model at an edge
• Anomaly detection: check is an unseen unlabeled input at the edge is anomalous
• Open set problem: detect a novel class at this edge
Courtesy: https://www.wjscheirer.com/projects/openset-recognition/
Page – 16Anomaly and Open Sets Detection
• During model training phase on labeled data
(at cloud), compute a model sketch
• Class-wise centroids with normalized inertia
measures at each layer of the network
• Normalized inertia:
0
+ ∗ -./ 0
• ! ", $ = ∑*
'() *
,
• where " ∗ = 123456+ " − $' 8
• During model scoring phase on unlabeled data
(at edge) compute distance between data at
every layer and the model sketch
• Anomaly scores and open set characterization
using: silhouette coefficients and
Wasserstein metric (Earth mover distance)
Page – 17Illustration on MNIST dataset
Data is partitioned into two classes: (0-4) for training and (0-9) testing classes
Training and validation Normalized inertia at Normalized inertia at layer
accuracy over epochs different layers for 12 with novel classes (It:
training data training; I: testing)
Page – 18Anomaly Detection and Open Set Recognition
Centroids over anomalous
inputs (shows high
confusion for 5 and 9)
Anomaly detection Anomaly detection
accuracy on open set accuracy on training data
inputs (closed set inputs)
https://dataplatform.cloud.ibm.com/analytics/notebooks/v2/1c9fa74e-55bb-4407-
9045-4f0f5a12b47d/view?projectid=6b12966f-3621-4f15-bbfe-
1f79fb5659fe&context=analytics
Page – 19Application I: Customizing speech-to-text models at edge
• Typical speech-to-text models are trained on news corpus and lack customization to specific
industry domain
• On noisy input the output had lot of low confidence transcriptions to Saddam Hussein, Iraq,
etc.
• Customization process involves identifying errors in the output and correcting the models.
Error correction typically happens through manual feedback
• Apply deep hash codes to the output of speech-to-text and obtain anomalous clusters (e.g.,
why, fly – which are both incorrect transcriptions of WiFi)
• The novel word “WiFi” can now be added to the speech-to-text model à example of model
customization with limited supervision at the cloud/edge
• Result: output accuracy improves from a baseline of 71% to 89%
Page – 20Application II: Fingerprinting IoT Devices
• Examine DNS (Domain Name Service) requests from a device to classify it as IoT vs. non-IoT;
if IoT identify a more specific device type (e.g., camera, LIFX bulb, Wemo switch, etc.)
• Reduce error rate to 0.21% from 4.22% (20x improvement)
Hash codes similarity on DNS requests from non-IoT devices
Hash codes similarity on DNS requests from IoT devices Page – 21Case Study I: Maritime Piracy
and Drug Trafficking
Page – 22AI @ Edge: Maritime Piracy and Drug Trafficking
Diesel Fuel Fertilizer Moving Truck Terrorist on
Purchase Purchase Rental Watch List
Channel SeparationAI @ Edge: Maritime Piracy and Drug Trafficking
Billy the Kid
Diesel Fuel Fertilizer Moving Truck Terrorist on
Purchase Purchase Rental Watch List
Channel ConsolidationEntity Resolution is Essential for Prediction
• Is it 5 people each with 1 account or is it 1
person with 5 accounts?
• Is it 20 cases of Ebola in 20 cities or one case
reported 20 times?Re-thinking Entity Resolution
People Cars Router
Name License Plate No. Serial Number
Address VIN MAC Address
Date of Birth Make IP Address
Phone Model Make
Passport Year Model
Nationality Color Firmware Vers
Biometric Etc. Etc.
Etc.Consider Lying Identical Twins
PASSPORT #123
Sue PASSPORT #123
3/3/84 Sue
Uberstan 3/3/84
Exp 2011 Uberstan
Exp 2011
“Same
person –
trust
Fingerprint me.”
DNA
Most Trusted
AuthorityD’oh!
The same thing cannot be in two places
at the same timeD’oh!
People Cars Router
Name
When License Plate No.
When Serial Number
When
Address
Where VIN
Where MAC Address
Where
Date of Birth Make IP Address
Phone Model Make
Passport Year Model
Nationality Color Firmware Vers
Biometric Etc. Etc.
Etc.Life Arcs are Telling
Bill Smith Bill Smith
4/13/67 4/13/67
Salem, Oregon Seattle, Washington
Address History Address History
Tampa, FL 2008-2014 San Diego, CA 2005-2014
Biloxi, MS 2005-2008 San Fran, CA 2005-2005
NY, NY 1996-2005 Phoenix, AZ 1990-2005
Tampa, FL 1984-1996 San Jose, CA 1982-1990Multi-Resolution Life Arcs for Anomaly Detection
• Efficiency gains with increasing cost ($$$)
• 2x in software
• 20-50x with FPGA/GPUs
• 1000x with TCAMsWhen Life Arcs are Missing…
§ Deep Learning models over low-orbit satellite imagery
§ Convolutional autoencoder-decoder pipeline to obtain a binary segmented 1-channel image
from a 3-channel input image
§ A modified U-Net pipeline (proposed initially for biomedical image segmentation)
§ Modifications: loss function optimized for improving IOU (Intersection Over Union)
metrics, number of levels, convolution kernel sizes
U-Net ArchitectureBuilding Rooftop Extraction Results § Training Data: SpaceNet Buildings Dataset, containing data from Paris, Shanghai, Las Vegas, Khartoum and Rio de Janeiro (~10K images) § IOU: 0.81; Accuracy: 0.98
Asteroid Hunting

                   © 2009 IBM Corporation
From Orphans to Orbits
Named entity: S100ZUtza
Anticipation
Forecasting Orbit
Track
Tracklette
Single Detection
(orphan)
Single
Detections
(trash)Asteroid-Asteroid Encounters
"We have directly observed a
collision between asteroids for
the first time, instead of
having to infer that they
happened from million-year-old
remains."
Colin Snodgrass
Planetary Scientist
Max Planck Institute for Solar System ResearchTwo-body Problems are easy to solve
Isaac NewtonN-body Problems are hard!
Pierre-Simon Laplace3D Life Arcs
U
5A
00
0.
1 hour
Determine
AU
05
encounter
1 day
0.
distance and
TIME time600K Asteroids x 25 years
Encounters by Proximity
Encounter Distance Asteroid 1 Size Asteroid Size
2
May 1, 2032 299km 00A9170 2-4km 0008758 4-9km
63353.9318 (MJD) 0.000002 (AU) 15.8 (H) 13.9 (H)
Orders of magnitude
Nov 24, 2016
57716.07911 (MJD)
449km
0.000003 (AU)
00P5634 1-2km
17.4 (H)
0055711 2-5km
15.5 (H) improvement in performance
Jan 11, 2018 449km K08E88J 530-1200m 00N0062 2-4km
58129.29692 (MJD) 0.000003 (AU) 18.3 (H) 15.8 (H)
Supports incremental addition of
Encounters by Size newly discovered asteroids
Encounter Distance Asteroid 1 Size Asteroid Size
2
Feb 18, 2028 70K km 0000346 110-240km 00A4356 2-5km
61819.1561 (MJD) 0.000469 (AU) 7.13 (H) 15.5 (H)
A few predictions validated by
Univ of Hawaii telescope
Feb 28, 2031 54K km 0000348 35-75km 00G7226 2-4km
62925.12725 (MJD) 0.000359 (AU) 9.4 (H) 16.1 (H)
Oct 25, 2036 43K km 0000690 65-150km 0083174 3-7km
64991.01073 (MJD) 0.000289 (AU) 8.02 (H) 14.3 (H)Case Study II: Protecting Rhinos at
Welgevonden Game Reserve, South Africa
Page – 41AI @ Edge: Protecting Rhinos at Welgevonden Game Reserve, South Africa
Tag is applied to non-endangered
species (applying them on Rhinos will
allow them to be triangulated by
poachers)
Learn predator vs. poacher pattern
from sensor data:
• Per-animal models identify
anomalies (but cannot distinguish
between predator and poacher)
• Group models (scatter patterns)
distinguish between predators and
poachers
IBM press release: https://www.ibm.com/thought-leadership/smart/
Bloomberg: https://www.bloomberg.com/news/articles/2017-09-19/mtn-ibm-to-combat-rhino-poaching-with-collars-for-prey-animals
Economist: https://www.economist.com/special-report/2017/11/09/electronic-surveillance-may-save-the-rhino
Youtube video: https://www.youtube.com/watch?v=E9olFUDD_2M
42 Page – 42Coarse Grained Patterns
§ Data collected from
animal collars stored in
DashDB
§ Data from 112 collars
fitted on: Impalas,
Zebras, Wildebeests,
Elands
§ Data types:
• Latitude/Longitude
(GPS)
• Accelerometer
• Magnetometer
• Temperature
Approach:
Spatiotemporal
clustering Heatmap Activity for Different Animal Species During Morning Hours (Single DaUnsupervised Pattern Learning
Impala Clusters Wildebeest Clusters
15 15
# Accelerometer peaks
# Accelerometer peaks
10 10 § Mechanism:
5 5
• Unsupervised multi-
level clustering of
0
0 5 10 15
0
0 5 10 15
location and
Speed (m/s) Speed (m/s) accelerometer data
Zebra Clusters Eland Clusters § Identified (per animal)
15 15 patterns
• Resting
# Accelerometer peaks
# Accelerometer peaks
10 10
• Grazing
5 5 • Walking
0 0
• Running
0 5 10 15 0 5 10 15
Speed (m/s) Speed (m/s)
K-means Clustering, k = 15Unsupervised Group Pattern Learning
Representative of possible poacher attack Representative of a possible predator attack
Approach: Spatiotemporal aggregation to obtain averaged group feature
vectors (speed, accelerometer, direction) followed by clusteringEvaluation
§ Simulated experiments
(5 types) were
conducted over a 90 day
Distribution of Pattern Frequencies Over Weeks Number of Anomalies Detected on Experiment Days period
§ Experiment anomalies
detected with 90 %
accuracy
Average Number of Anomalies by Experiment Type Average Group Angular Spread by Experiment TypeCase Study III: Air Traffic Control
Page – 47Air Traffic Control
• Sensing modality
• GPS and RADAR
• Typically under 20Km from
Earth’s surface
• Data model
• Latitude, longitude, altitude,
azimuth, ground speed, daltitude
• Altitude is wrt mean sea level
• Azimuth between (0, 2π) starting
with 0 = north, π/2 = east, π = • Short term tracks modeled as great
south, 3π/2 = west arcs
• Ground speed typically 0.9 mach • Not unusual for tracks to fly over a
• daltitude is rate of change of pole (typically a point of singularity
altitude for common planar projections)Air Traffic Control
• Automatic Dependent Surveillance Broadcast (ADS-B) is a
surveillance technology in which an aircraft determines its
position via satellite navigation and periodically broadcasts it,
enabling it to be tracked
• Fact Sheet
• Worldwide # flights in air
• US day time: 9000-10000
• US night time: 6000
• Data gathered every minute (sometimes
every 10 seconds – especially during
takeoff/landing)
• Data is neither authenticated nor encrypted
and sent on a 1090 MHz channel (and thus
requires RADAR based validation)Deep Q-Learning
• Identify close approaches (encounters) between two flying objects
• Predict encounter distance: closest distance of approach between the two flying objects
• Predict encounter time: time at which the two flying objects are at their closest distance from
each other
• Model trajectory of each flying object as a great arc/elliptic arc
• Great arc is the shortest path between two points on a sphere
• Unlike straight lines in Euclidean spaces, great arcs can have inflection points
• Generally a N x N problem (N: # flying objects)
• But can be easily simplified into a m x m problem using a spatial index and altitude zones (mSneak Peek into other Case Studies
Page – 51AI @ Edge: 3D SLAM
Simultaneous object localization and Our Approach State-of-the-art
size estimation
Support for capturing point cloud
data from IR and LIDAR sensors
on Lenovo tango phones (Android)
Ground Truth: 167cm
Computed: 162cm
Error: 3%
Ground Truth: 107cm
Computed: 111cm
Error: 4cms
Page – 52AI @ Edge: Autonomous Washer
ADEPT: Implementation of
a decentralized blockchain
based open source
framework for smart
devices by using Ethereum
smart contracts
• Using ADEPT, an ordinary
washing machine can
become a semiautonomous
device capable of managing
its own consumables
supply, performing self-
service and maintenance,
and even negotiating with
other peer devices both in
the home and outside to
optimize its environment
https://www-935.ibm.com/services/multimedia/GBE03662USEN.pdf
Page – 53AI @ Edge: Worker Safety
Workplace safety for remote
areas with minimal infrastructure,
private data
OIL RIGS FACTORIES
COAL MINES CARE@HOME
Analytics for detecting hazardous
workplace conditions
Sharing safety sensors,
smartphones as needed
Near real-time response via co-
workers, local alerting
Page – 54AI @ Edge: Sensitive Healthcare Data
Privacy Library Analysis Library
Hospital Data At Edge Watson IoT on Cloud Analyst at Research Facility
Privacy Analytics at Edge of hospital can Encode
obfuscate data so that analyst can get (Online)
their analysis performed without seeing Learn Verify Metrics
raw data/ Encode
(Batched)
“Mary Phillips is a 45-year-old woman with a history of “Patient is a 42-year-old woman with a history of
diabetes. She arrived at New Hope Medical Center on diabetes. She arrived at Medical Facility on August xx
August 5 complaining of abdominal pain. Dr. Gertrude complaining of abdominal pain. Doctor diagnosed her
Philippoussis diagnosed her with appendicitis and with appendicitis and admitted her at yy PM.”
admitted her at 10 PM”
Data captured from speech-to-text interface à anonymized à delivered via text-to-speech interface (350 ms delay)
Page – 55Questions
Page – 56You can also read


