A European lightning density analysis using 6 years of ATDnet data
←
→
Page content transcription
If your browser does not render page correctly, please read the page content below
A European lightning density analysis using 6 years
                   of ATDnet data
                                                Graeme Anderson, Dirk Klugmann
                                                    Observations, Upper Air R&D
                                                             Met Office
                                                          United Kingdom
                                                 graeme.anderson@metoffice.gov.uk

    Abstract— The Met Office has operated a VLF lightning                The benefit of longer range relative to higher frequency
location network since 1987. The long-range capabilities of this     networks is obtained with lower location accuracy than some
network, referred to in its current form as ATDnet, allow for        other LLSs: ATDnet location uncertainties within the region
relatively continuous detection efficiency across Europe with only   enclosed by the network of sensors are on the order of a few
a limited number of sensors. The wide coverage and continuous        kilometres, as opposed to a few hundred metres possible with
data obtained by ATDnet are here used to create datasets of          LF/VHF and VLF/LF systems. The location uncertainty of
lightning density across Europe. Results of a recent study into 5    ATDnet makes it suitable for identifying electrically active
years (2008 – 2012) of lightning density data covering Europe are    cells.
extended here to include data from 2013. The data is used to
analyse the characteristics of lightning activity in Europe.             One key advantage of the ATDnet approach, however, is
                                                                     the ability to provide relatively continuous coverage over much
   Keywords—flash density, Europe                                    of Europe, using only a very limited number of sensors. The
                                                                     ATDnet network consists of 11 sensors (referred to as
                       I.   INTRODUCTION                             outstations) that regularly contribute to the ‘operational
A. Lightning Detection at the Met Office                             network’, plus sensors distributed further afield, designated
    The use of lightning location systems (LLS) across Europe        ‘development outstations’. The locations and statuses of these
and the wider world for operational meteorology and research         sensors, as of May 2013, are shown in Fig. 1. Coverage
purposes is well established. Lightning data is used daily for       extends over regions of open water (e.g. the North Sea, the
observing the development and progression of storms, and also        Mediterranean), where the use of short-range networks is
in research projects (such as the HyMeX project [Ducrocq,            limited by the lack of available sensor sites.
2013]) in order to gain a better understanding of the processes
taking place within storms.
   The Met Office has operated its own Very Low Frequency
(VLF, 3-30 kHz) lightning location network since 1987 [Lee,
1986]. The system has developed considerably during its
operational life, and the most recent version - ATDnet (Arrival
Time Differencing NETwork) - was introduced in 2007
[Gaffard et al., 2007].
   ATDnet takes advantage of the long propagation paths of
the VLF sferics emitted by lightning discharges, which
propagate over the horizon via interactions with the
ionosphere. ATDnet predominantly detects sferics created by
cloud-to-ground (CG) discharges, as the energy and
polarisation of sferics created by CG return strokes mean that
they can travel more efficiently in the Earth-ionosphere             Fig. 1. Locations of ATDnet outstations, as of May 2013.
waveguide, and so are more likely to be detected at longer
ranges than typical inter-/intracloud (IC) discharges.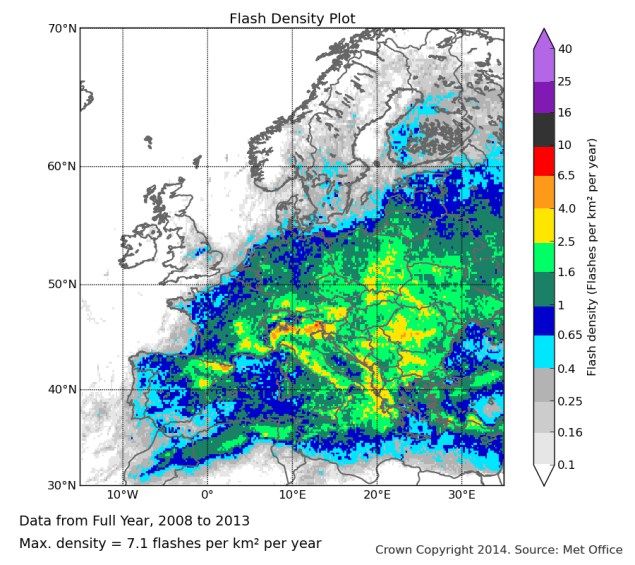
B. ATDnet detection of flashes                                                      The first fix (at approximately 17:41:14.8) was not
    During September – November 2012, a Lightning Mapping                       associated with any channels connecting to the ground
Array (LMA) system from New Mexico Tech was set up in the                       apparent in the LMA. Within this storm, ATDnet fixes were
south of France as part of the HyMeX project Special                            often detected without indication of a CG channel at any point
Observation Period One (SOP1) [Ducrocq, 2013]. Part of the                      in the flash. This has been interpreted as evidence that ATDnet
aim of this observation period was to obtain data in order to                   detected cloud-to-cloud discharges.
better characterize the performance of operational lightning                       The later fix detected by ATDnet (at approximately
location systems like ATDnet, and understand which                              17:41:15.5) is associated with a channel developing westward
components of lightning discharges they detect.                                 before descending towards the ground, indicating the
    Figure 2 shows an example of data obtained during a period                  development of a CG channel.
when a storm passed within the region enclosed by the LMA                           The data associated with this particular storm was analyzed
sensors. A CG flash is detected, that lasted for approximately                  by eye, and detection efficiencies for IC and CG flashes were
one second. The three dimensional extent of the flash can be                    estimated at approximately 30% and 80%, respectively. The
determined by the LMA by detecting VHF sources in                               discrimination of flash type was based only on the height of the
developing channels of the flash.                                               VHF sources detected by the LMA. To determine a more
    This flash covered an extensive region, travelling several                  reliable and representative measure of the detection efficiency
kilometres from the location of the initiation of the flash before              of ATDnet would require an automated approach to
connecting with the ground. ATDnet detected fixes at two                        determining flash type, as complex storms systems with higher
points in the flash: one at initiation and one when the flash                   flash rates were observed near to the LMA during SOP1, for
connected with the ground.                                                      which the by eye approach would be unreasonably labour
                                                                                intensive.
                                                                                    The analysis of the wealth of data from the HyMeX Special
                                                                                Observation Period One deserves its own paper, and only a
                                                                                summary is provided here. This provides an indication of the
                                                                                performance of ATDnet and the features of flashes that it
                                                                                detects.
                                                                                C. European Lightning Density
                                                                                    For continental regions with few large bodies of open
                                                                                water, the use of short-range systems allows for continuous
                                                                                coverage. This has been used to provide good quality lightning
                                                                                data across the entire contiguous United States using the
                                                                                National Lightning Detection Network (NLDN) for many
                                                                                years. An interesting use for this data has been to provide
                                                                                continent-wide maps of lightning density, so that annual or
                                                                                monthly characteristics of the distribution of lightning can be
                                                                                analysed, as shown by Holle et al. [2010].
                                                                                     Due to the more fragmented nature of landmasses within
                                                                                Europe, the use of short-range networks to provide continuous
                                                                                Europe-wide lightning data density maps is less feasible, as
                                                                                European seas would lead to decreased detection efficiency
                                                                                and inhomogeneous coverage that would be difficult to account
                                                                                for.
                                                                                    Lightning density has previously been measured over the
                                                                                entirety of Europe using the satellite-borne Optical Transient
                                                                                Detector, or OTD [Christian et al., 2003], onboard the
                                                                                Orbview-1/Microlab satellite. This instrument operated
                                                                                between 1995 and 2000, and was the predecessor to the
                                                                                Lightning Imaging Sensor, or LIS [Christian et al., 1999], of
Fig. 2. Example of a flash detected by the LMA, along with two                  the Tropical Rainfall Measuring Mission (TRMM) satellite.
corresponding ATDnet fixes. Black squares represent LMA sensor locations.
Filled hexagons/triangles represent ATDnet fixes. Coloured points indicate           One key difference between the two systems was that the
LMA-detected VHF source locations. a: time series versus altitude. b:
                                                                                OTD’s orbit allowed it to detect lightning at higher latitudes:
longitude versus altitude. c: plan view – coloured ellipses indicate location
uncertainty of each ATDnet fix. d: latitude versus altitude.                    the OTD could detect lightning between 75°N and 75°S
                                                                                latitude, whereas the LIS can only detect as far north as the
                                                                                southern Mediterranean (approximately 38°N).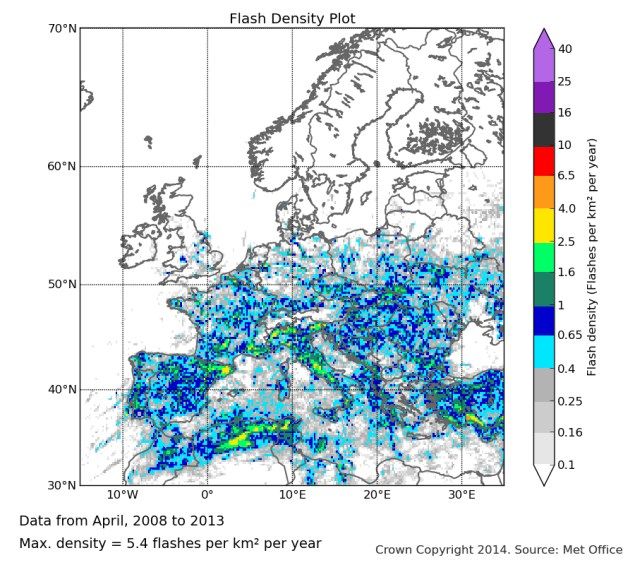
The length of the data period is suitable for smoothing out
                                                                    the effect of individual storms in most regions, particularly
                                                                    during the summer months, when the majority of storms occur.
                                                                    The effects of unusually strong winter storms, or particularly
                                                                    early/late storms in the usual storm season, are still noticeable
                                                                    in some plots. These effects do not detract from the overall
                                                                    usefulness of the plots themselves, but are an interesting effect
                                                                    that will be discussed later. No spatial smoothing (beyond
                                                                    gridding the data) was carried out on the data.
                                                                        As mentioned in the introduction, the long-range nature of
                                                                    ATDnet is such that it predominantly detects CG strokes, as the
                                                                    VLF sferics emitted by CG strokes are generally more intense
                                                                    than the sferics emitted by cloud discharges. ATDnet does
                                                                    however detect some more powerful IC discharges, but does
                                                                    not distinguish between IC and CG events. As such, the
                                                                    lightning density plots produced here will be similar to the CG
                                                                    flash distribution of Europe, but the effect of IC discharges in
                                                                    the density could potentially lead to densities in the data
                                                                    presented that are higher than the true CG flash density.
Fig. 3. Lightning density in Europe, estimated from OTD data.           Because of the inability to distinguish between IC and CG
                                                                    discharges, the data presented here can be interpreted as
    The orbital characteristics of the OTD only allowed for         ‘lightning density’, as opposed to ‘flash density’, a term which
observations at any point on the Earth’s surface for a few          in the past has been used to specifically refer to CG-only
minutes per day. This meant that by using data obtained over        density. It is, however, useful to refer to the fix data correlated
long periods of time, the lightning density could be estimated      together into events using time and space criteria as ‘flashes’,
by assuming that the observed flash rate during a number of         to indicate the fact that these are merged events, despite the
satellite overpasses was representative of the average rate for     fact that this ‘flash’ data may include IC discharges.
that location. Figure 3 shows the flash density estimation
obtained using this technique. The lack of continual                    The flash density values obtained would be expected to be
observations, and the variable nature of storms, would however      lower than the values detected by OTD (Fig. 3). The satellite
mean that the lightning densities estimated from this approach      detector would be expected to have a high IC detection
would be unlikely to accurately match the true lightning            efficiency, while also being capable of detecting CG flashes
density.                                                            with sufficient vertical extent that the cloud top would be
                                                                    visibly illuminated.
    This paper aims to provide an analysis of Europe-wide
lightning data using relatively continuous coverage provided        B. Flash Density
by the ATDnet network. The approach of Holle et al. [2010] in          The key component of this study was to process the data
using data from the NLDN to analyse lightning density in the        from its original format into grids of lightning flash density.
US for each month in turn has been used as a template.              The first step was to convert ATDnet ‘fixes’ into ‘flashes’.
                             II.    METHOD
A. ATDnet data
    In order to create plots that represent the true average
distribution of monthly lightning density as closely as possible,
several years’ worth of continuous data were required. ATDnet
is suitable for this purpose, since it runs as an operational
network with very little downtime. Due to modifications to the
network when it was re-launched as ATDnet (as opposed to the
previous system, simply known as ‘ATD’), data prior to 2008
was not included. As such, 6 years of lightning data from the
period 2008-2013 was used to create the density plots. A more
detailed analysis, using data from only 2008-2012, can be
found in Anderson and Klugmann [2013].
    Note that occasional sensor or network outages would
affect the density data; however, such outages are rare, and the    Fig. 4. Total numbers of flashes created when passing ATDnet fix data from
                                                                    Europe in 2012 to a flash creation algorithm, using a variety of space
density of ATDnet sensors is high enough to provide some
                                                                    matching criteria.
level of redundancy. Further, it should be noted that no
adjustment has been made to the data to account for detection
efficiency of flashes.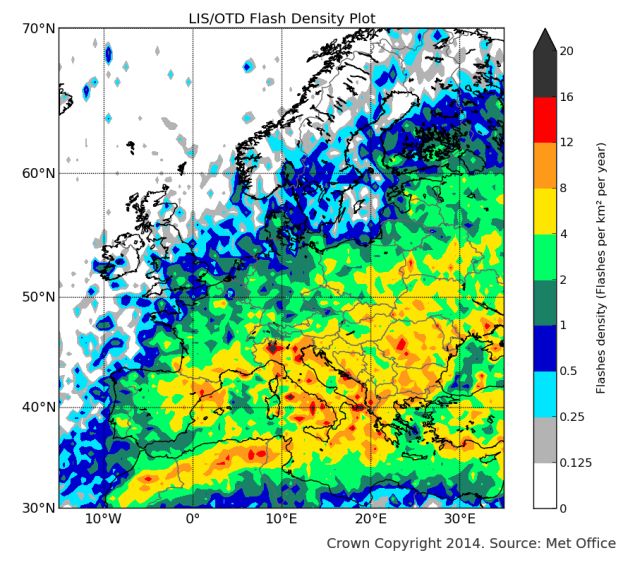
ATDnet strokes were converted into flashes using the The numbers of flashes in each box for each month over
approach derived from that presented by Drüe et al. [2007]. the six year period were counted. This value was then divided
Individual fixes were compared against each other using spatial by the number of days counted over, and the area of each
and temporal criteria. Fixes could then be matched together latitude/longitude box, and then multiplied by 365.25 to give
into a single flash if these criteria were met. In this flash consistent units of flashes per square kilometre per year.
correlation algorithm, no maximum inter-stroke separation Strictly, as the units take the form of events per unit area per
time was used. unit time, this gives the presented data in units of density rate;
to be correct then, the reader should keep in mind that this is
Figure 4 shows the effect of using correlation ranges average flash density per year.
between 5 km and 75 km between flashes, using a constant
maximum flash duration of one second. The initial drop in the No correction has been made to the data for spatial
number of flashes at low ranges would be due to fixes from the variations in the detection efficiency of ATDnet. Although the
same flash being correctly correlated together. At larger ranges, detection efficiency will vary slightly due to differences in the
the continuing decrease would be more likely to be caused by distance from a stroke to the nearest four ATDnet sensors
incorrect correlations of fixes from discharges that were required to locate a fix, as of yet no model has been created to
detected within a second of each other, but were not part of the quantitatively account for this effect. No published, peer-
same flash. reviewed, Europe-wide assessment of ATDnet detection
efficiency has yet been made, although assessments of
When creating the flash density plots for this study, detection efficiency within France using data from a VHF
ATDnet fixes that occurred within 20 km of and within one Lightning Mapping Array are in progress. An internal report on
second after another fix (dt = 1 second, dx = 20 km) were the capabilities of ATDnet in Finland (towards the limits of
grouped together as a single flash. The range criteria used is ATDnet detection capabilities in Europe) suggests a diurnally
more relaxed than was used by some other networks, e.g. the averaged flash detection efficiency of 50 %, which can be used
US NLDN [Cummins et al., 1998]. These criteria should an approximate lower limit for ATDnet flash DE across
capture the majority of fixes that occur within spatially Europe.
extensive flashes or strokes within the same flash where the
error on one or more of the strokes was mislocated by a few A logarithmic scale was used for plotting, as the lightning
kilometres. This range should however be less than the flash density varies widely across Europe. Some regions,
separation between storm clouds, meaning that it would be rare particularly in central Europe and around the Mediterranean,
that coincident flashes from separate storms would be are well known to experience significant numbers of storms
correlated together by chance. each year. On the other hand, the cold seas to the north of the
UK experience very little lightning compared with the rest of
Figure 2 of Drüe et al. [2007] indicates that although the Europe. The logarithmic scale allowed for lightning data from
majority of fixes are within a flash are likely to be within 10 across the whole of Europe to be visualised in a single plot.
km of each other, sources in excess of 20 km are still possible
from the same flash. Given the 5 km average location III. ANALYSIS
uncertainty of ATDnet at the limits of Europe, these time and
space correlation criteria seem justified. The location and time The analysis of the density plots will be divided into
of the first fix in the group of fixes was used as the location and sections for the whole year and then each calendar month.
time of the flash. A. Annual lightning data
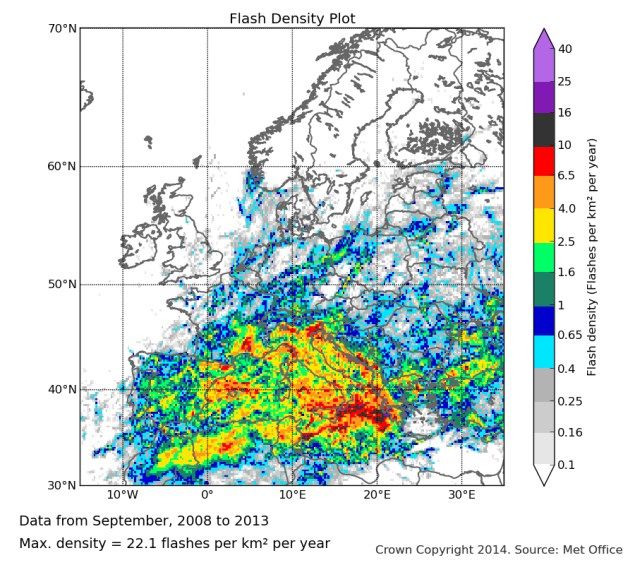
Having created a new dataset of flashes, density arrays A total of 110,084,786 fixes were detected by ATDnet
could be created. The density in each point of the array across the defined region of Europe from January 2008 to
corresponds to the lightning density within a box of set December 2013. Using the flash correlation algorithm, these
latitude/longitude dimensions. The domain used covers 30°N were grouped into 71,433,559 flashes, giving an average
to 70°N, and 15°W to 35°E. After some testing, a resolution of multiplicity of 1.54. The average flash densities observed
5 boxes per degree of latitude/longitude was chosen. This between 1 January 2008 and 31 December 2013 are shown in
corresponds to box dimensions of approximately 22 km by 14 Fig. 5.
km at 50°N. This allowed for the resolving of features such as
The annual flash densities detected across Europe are
mountain ranges, large valleys and coastal effects, without the
generally of the order of 0.1 - 4 flashes per km2 per year, a
plots becoming too ‘noisy’ due to the effects of individual,
broadly similar range to that observed by Holle et al. [2010]
localised storms. The box size is also much larger than the
for the northern and western contiguous United States. Peak
anticipated location uncertainty of ATDnet within Europe.
densities in Europe of less than 8 flashes per km2 per year are
Diendorfer [2008] suggests that, in order for measured less than the peak values observed in Florida (over 14 flashes
lightning density to reflect the true lightning density within a per km2 per year), however larger sources of heat and moisture,
grid box to an uncertainty of at most 20 %, the number of and the physical arrangement of the Florida peninsula itself,
events per grid box should be 80 or more. Using 5 boxes per make it particularly susceptible to lightning activity.
degree leads to a box area in the range of approximately 419
km2 in the south of the domain to 166 km2 in the north. This
means that densities in the annual data of greater than
approximately 0.1 flashes per km2 per year are likely to be
accurate to within 20 %.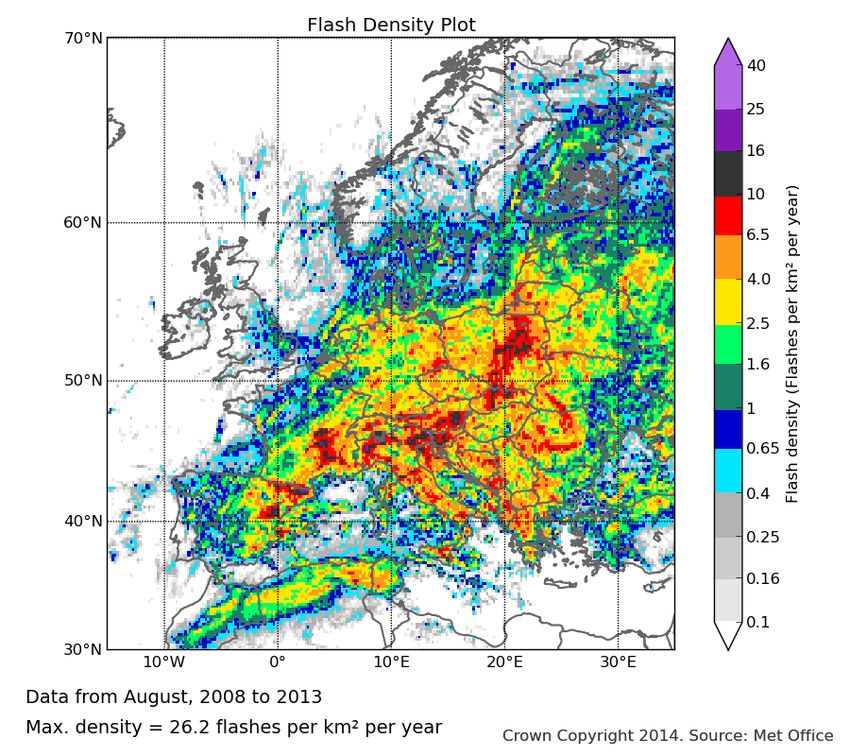
Fig. 5. Average annual lighting density in Europe, based on 6 years of   Fig. 6. Average January lighting density in Europe, based on 6 years of
ATDnet data.                                                             ATDnet data.

    There is a clear preference for higher flash densities over              3) March
land compared to over open water. The monthly analysis                       March sees the early signs of the resurgence of convection
shows that lightning in Europe peaks during the summer                   from solar heating (Fig. 8). Coastline lightning density in the
months, where land surface heating becomes the main source               Mediterranean is further reduced from February, but activity
of the instability that leads to thunderstorms.                          increases slightly across central Europe. The form of the Atlas
    The distribution of lightning is similar to that observed by         Mountains in northern Algeria and Morocco and the Apennine
the OTD (Fig. 3). As predicted in the introduction, the flash            Mountains in Italy are revealed by an increase in lightning
densities observed by ATDnet are lower than those observed               density. Northern regions of Europe such as the UK and
by OTD (widely greater than 4 flashes per km2 per year), most            Scandinavia see little change in lightning between February
likely due to the superior IC detection efficiency of the OTD.           and March. Despite early signs of increasing activity, the
As ATDnet predominantly detects CG flashes, this is not a                maximum flash density in Europe in March is the lowest of all
comparison of like-with-like; however, assuming that the                 12 months.
distribution of IC and CG events are closely related, this is a
good check of the reliability of the ATDnet flash density
dataset.
B. Analysis by month
    1) January
    Lightning occurrence throughout Europe is at a minimum
in winter, as displayed in Fig. 6, as the lack of solar heating and
available atmospheric water vapour reduce the amount of
energy available for storms to develop.
    Lightning activity over continental Europe is very low. The
regions with the highest lightning activity are around the
coastlines of the Eastern Mediterranean, along the coasts of
Turkey, Greece and the Balkans. Residual heat from the
previous summer in the Mediterranean itself provides a source
of energy and water vapour for generating convection.
   2) February
   The distribution of lightning in February (Fig. 7) is very
similar to that of January. The occurrence of lightning in the
Mediterranean becomes slightly more concentrated along                   Fig. 7. Average February lighting density in Europe, based on 6 years of
coastlines relative to January, as the instability is only released      ATDnet data.
with the additional forcing of coastal convergence and
orographic effects.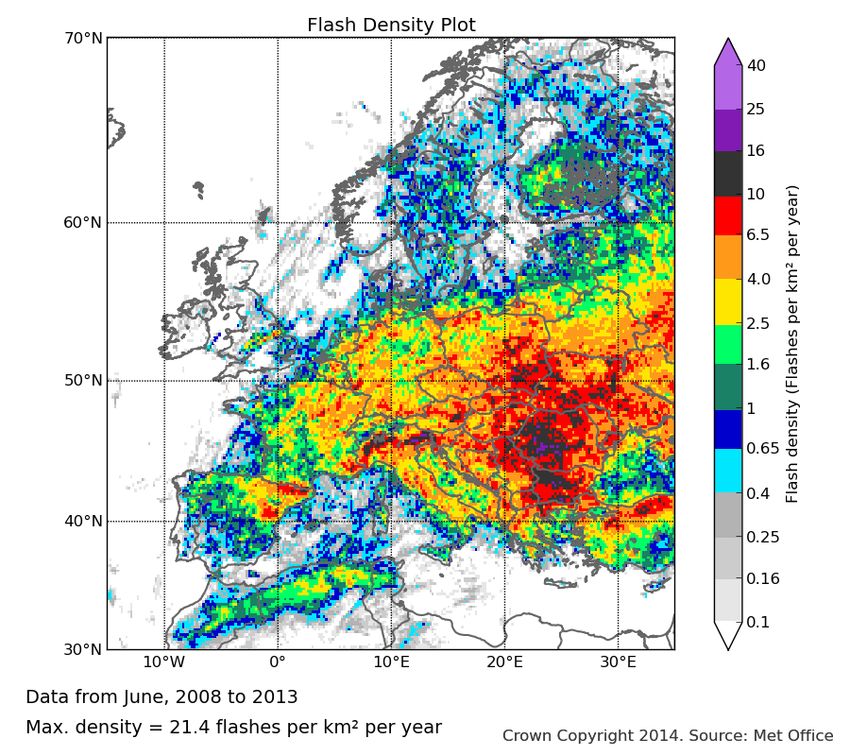
Fig. 8. Average March lighting density in Europe, based on 6 years of   Fig. 10. Average May lighting density in Europe, based on 6 years of ATDnet
ATDnet data.                                                            data.

    4) April                                                               The first noticeable increases of lightning occur in
    The distribution of lightning across Europe takes a                 Scotland, Finland, Norway and Sweden. The central Alps still
noticeable turn between March and April, with the greatest              remain relatively lightning free, however.
flash densities now occurring over land (Fig. 9). Lightning
                                                                            6) June
density over the southern European seas is now reaching a
minimum, as residual heat from the previous summer has now                  By June, Romania, Bulgaria and Northern Italy
been exhausted, and the air begins to warm, reducing                    demonstrate some of the highest lightning densities in Europe
instability.                                                            (Fig. 11). Lightning activity along coastlines and over open
                                                                        water is generally low, as the relatively cold water acts as a
    5) May                                                              stabilising influence on the atmosphere.
    The increase in lightning density observed in April                    Individual storm tracks are noticeable in the UK, Sweden
continues into May (Fig. 10), with the increase covering almost         and Norway. For example, the relatively well-defined stripe of
all of continental Europe. Many regions see lightning activity          high lightning density in central England was caused by storms
jump by an order of magnitude.                                          on only one day, on the 28 June 2012.

Fig. 9. Average April lighting density in Europe, based on 6 years of
                                                                        Fig. 11. Average June lighting density in Europe, based on 6 years of ATDnet
ATDnet data.
                                                                        data.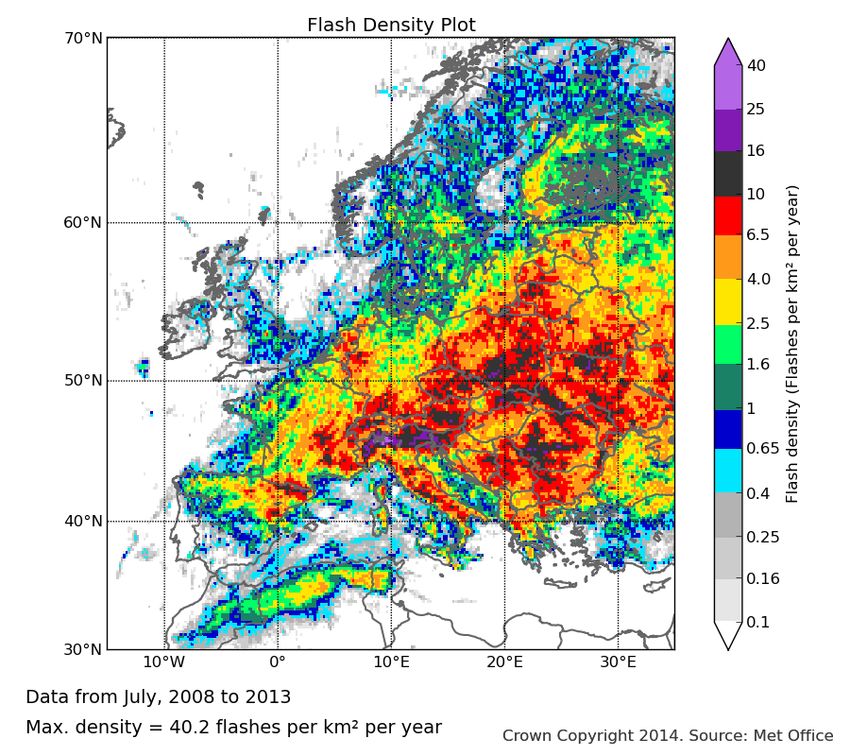
Fig. 12. Average July lighting density in Europe, based on 6 years of ATDnet   Fig. 14. Average September lighting density in Europe, based on 6 years of
data.                                                                          ATDnet data.

    These storms were uncharacteristically intense for the UK,                    8) August
as can be seen by the way they are still easily distinguishable,                  Lightning densities begin to drop across continental Europe
despite the density plot consisting of five years worth of June                in August (Fig. 13), as the air temperatures reach their peak
data.                                                                          and solar heating decreases, generating less instability.
    7) July                                                                    Lightning activity is still generally restricted to landmasses.
    Lightning densities across Europe peak during July (Fig.                      9) September
12), with the highest density box averaging almost 4 lightning                    September sees a dramatic switch in the distribution of
flashes per km2 during the month. The spread of high lightning                 European lightning, as can be seen in Fig. 14. Northern Europe
density generally moves north, with some of the highest                        sees a sharp drop in observed lightning, whereas the western
European lightning densities now observed in Poland and the                    Mediterranean sees a sharp increase, particularly along
Ukraine.                                                                       coastlines. Cooler air moving over the now warm waters of the
                                                                               Mediterranean leads to the generation of storms.

Fig. 13. Average August lighting density in Europe, based on 6 years of        Fig. 15. Average October lighting density in Europe, based on 6 years of
ATDnet data.                                                                   ATDnet data.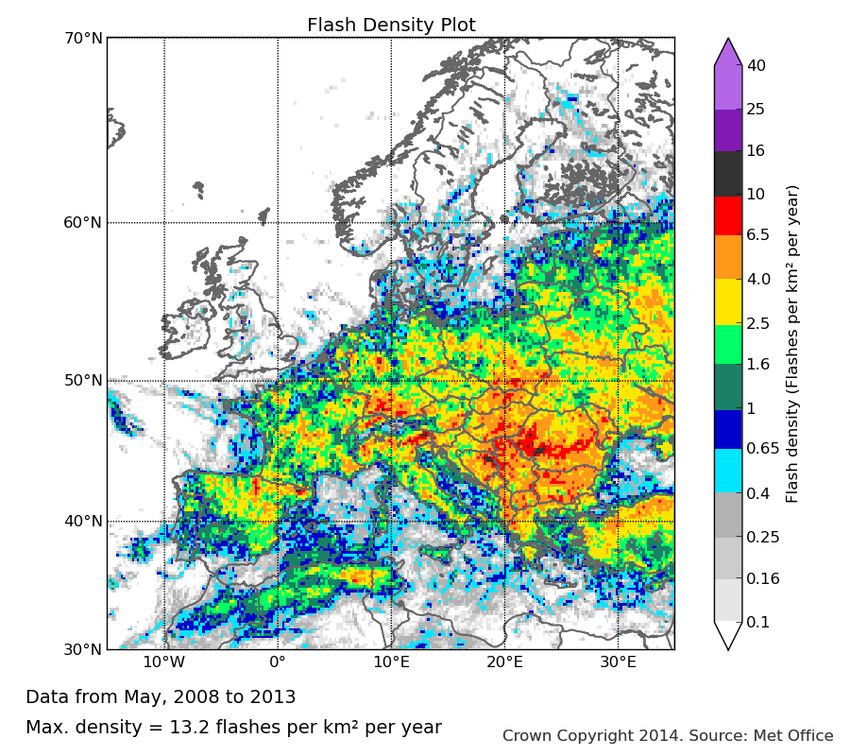
11) November
                                                                                The lightning distribution over Europe in November (Fig.
                                                                            16) is similar to that of October, but with generally reduced
                                                                            flash densities. The last remnants of notable flash densities
                                                                            over land in October, such as storms over Spain and the Atlas
                                                                            Mountains, are no longer observed.
                                                                                12) December
                                                                                Flash densities in December (Fig. 17) are now returned to
                                                                            the winter pattern observed in January and February. The
                                                                            distribution of the higher flash densities in the Mediterranean
                                                                            now shift towards the east, with peak densities observed along
                                                                            the coastlines of Greece, Turkey and Cyprus.
                                                                                13) Summary
                                                                                The annual pattern of the distribution of lightning across
                                                                            Europe can be summarised as follows. During the winter
                                                                            months at the start of the year, lightning is predominantly
                                                                            restricted to the Mediterranean, where warm waters provide the
                                                                            driver for storm development. In early spring, the land begins
                                                                            to warm, and switch from mainly sea-based to land-based
Fig. 16. Average November lighting density in Europe, based on 6 years of   convection begins in southern parts of the continent. By early
ATDnet data.
                                                                            summer, the majority of lightning is over land, and land-based
    Lightning densities in the Eastern Mediterranean remain                 convection now extends to the north of Europe. The peak
relatively low, however. Lightning densities are still higher               month for European lightning is July. Following a slight
over the Alps, Pyrenees and Atlas Mountains than the                        decrease in lightning occurrence in August, sea-based
surrounding regions. Tracks of individual storms are noticeable             convection returns extensively to the western Mediterranean in
across Germany, Poland and the Czech Republic,                              September. In the remainder of the year, land-based lightning
predominantly from storms in 2011.                                          density continues to decrease and the regions of highest
                                                                            lightning densities in the Mediterranean spread from west to
    10) October                                                             east.
    Lightning densities across all land regions become low in
October (Fig. 15), as lightning activity over the Mediterranean                                     IV.    DISCUSSION
dominates. Lightning activity in the eastern Mediterranean                      Although the general information presented in this paper
increases in October, leading to more uniform lightning density             may not be of particular surprise to most readers (i.e. that
between Gibraltar and Cyprus than is observed in September.                 lightning in Europe is most intense over the continent during
                                                                            summer, that higher latitudes experience less lightning than
                                                                            lower latitudes), the ability to analyse the relative intensities of
                                                                            lightning over the European region using continuous and
                                                                            consistent data has not previously been presented.
                                                                                The ability to carry out seasonal analysis allows for better
                                                                            understanding of processes such as the timing of the mode
                                                                            switch from predominantly land-based to sea-based convection
                                                                            in the autumn. The use of continuous Europe-wide data also
                                                                            means that variations in different regions can be put into a
                                                                            wider context.
                                                                                The effects of unusually intense storms are visible in most
                                                                            months of data. Had the data from ATDnet been available for
                                                                            a longer period, such effects could be reduced in the flash
                                                                            density analysis. However, data was only used from a period
                                                                            where the performance of ATDnet could be assumed to be
                                                                            relatively homogeneous. Similar analysis could again be
                                                                            carried out in future, in order to repeat the analysis with
                                                                            reduced ‘noise’; however the key results would still be likely to
                                                                            remain unchanged.
                                                                                It is desirable that, following the calculations of Diendorfer
Fig. 17. Average December lighting density in Europe, based on 6 years of
                                                                            [2008], the number of events per grid cell should exceed 80, in
ATDnet data.                                                                order to provide an estimated uncertainty of the density value
                                                                            of 20% or less. This is achievable for much of Europe in the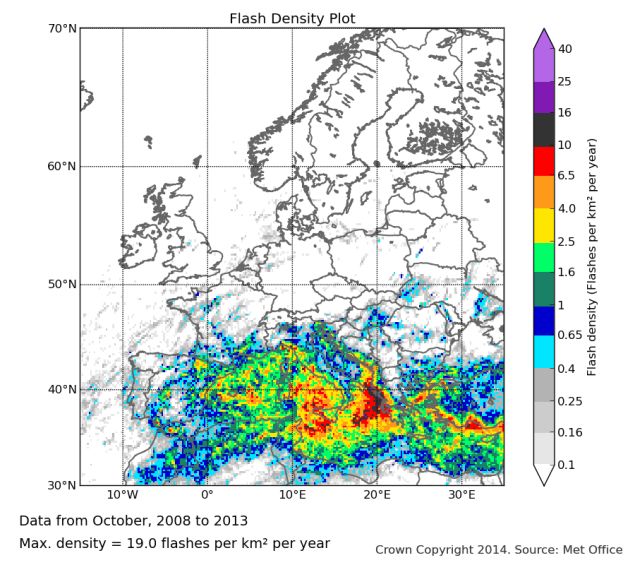
annual data, except in the very low lightning activity regions in   would be required for risks for specific sites, due to variations
the Northwest of Europe. In the monthly analysis, however,          in density shorter than the size of a grid box.
lightning densities in excess of 1 flash per km2 per month are
required in the northern limits of the region to achieve this                                   V.      CONCLUSION
criterion.                                                              Lightning density data from across Europe detected using
     Care should be taken then in interpreting the monthly data:    the ATDnet long-range lightning detection network operated
it is suitable for observing overall trends; however the actual     by the UK Met Office have been presented. The information
values in individual grid boxes will be subject to a high degree    provided by the density plots in this paper can be used to gain a
of uncertainty. The grid box dimensions used (i.e. based on         greater understanding of the characteristics lightning across
latitude/longitude limits) were chosen based on their simplicity    Europe. The continual operation of ATDnet will allow for
to understand, however the effect that the area reduces with        further refinement in future, which can be used to gain a better
increasing latitude, where the lightning density also decreases,    understanding of the average seasonal activity of
is unfortunate. The fact that lightning density varies by orders    thunderstorms in Europe.
of magnitude across Europe makes it difficult to select a grid                               ACKNOWLEDGEMENTS
scheme that both shows sufficient detail in high density
regions, that also prevents high uncertainties in low density          The Lightning Imaging Sensor (LIS)/Optical Transient
regions.                                                            Detector (OTD) Science data were obtained from the NASA
                                                                    EOSDIS Global Hydrology Resource Center (GHRC) DAAC,
    Readers should be aware that while the data provides a          Huntsville, AL. (http://thunder.nsstc.nasa.gov/).
good representation of lightning density across Europe, there
are still factors in the methodology of the way the data is                                        REFERENCES
obtained that will mean it does not exactly represent the true      Anderson, G., and D. Klugmann (2013), A European lightning density
European CG flash density, as is true with any observation               analysis using 5 yr of ATDnet data, Natural Hazards and Earth System
system. For example, the design of ATDnet means that it will             Sciences Discussions 1(6), 6877-6922.
predominantly detect the emissions from CG return strokes.          Bennett, A. J., C. Gaffard, J. Nash, G. Callaghan, and N. C. Atkinson (2011),
However, VLF systems have been shown to detect a proportion              The effect of modal interference on VLF long-range lightning location
                                                                         networks using the waveform correlation technique, J. Atmos. Ocean.
of IC discharges, as observed in data obtained by the WWLLN              Tech., 28(8), 993–1006.
[Jacobson et al., 2006]. As yet unpublished results obtained by     Christian, H. J., et al., (2003), Global frequency and distribution of lightning
analysing ATDnet data appear to confirm that ATDnet also                 as observed from space by the Optical Transient Detector, J. Geophys.
picks up a proportion of IC discharges, but with reduced                 Res., 108(D1), 4005.
detection efficiency relative to CG flashes. The difference in      Cummins, K. L., M. J. Murphy, E. A. Bardo, W. L. Hiscox, R. B. Pyle, and A.
detection efficiency between IC and CG discharges is thought             E. Pifer (1998), A combined TOA/MDF technology upgrade of the US
to predominantly be caused by the fact that CG return strokes            National Lightning Detection Network, J. Geophys. Res., 103(D8),
                                                                         9035–9044.
are generally more powerful than IC discharges, and so are
more easily detected at long ranges.                                Diendorfer, G. (2008), Some comments on the achievable accuracy of local
                                                                         ground flash density values, paper presented at 29th International
    It should also be noted that the detection efficiency of             Conference on Lightning Protection, Uppsala, Sweden.
ATDnet has a diurnal variability, attributed to variations in the   Drüe, C., T. Hauf, U. Finke, S. Keyn, and O. Kreyer (2007), Comparison of a
ionosphere leading to differences in propagation paths of VLF            SAFIR lightning detection network in northern Germany to the
                                                                         operational BLIDS network, J. Geophys. Res., 112(D18), D18114, doi:
sky waves between the day and night [Bennett et al., 2011].              10.1029/2006JD007680.
The difference in path length between the ground wave and           Ducrocq, V. (2013), HyMeX-SOP1, the field campaign dedicated to heavy
successive sky waves leads to bands of reduced sferic signal             precipitation and flash-flooding in Northwestern Mediterranean, EGU
strength caused by interference between signals with paths               General Assembly Conference Abstracts, 7–12 April 2013, Vienna,
differing by n+1/2 wavelengths, where n is an integer. The               Austria, EGU2013-2539.
effect is more noticeable at night, due to the height of the        EUMETSAT (2013), Meteosat Third Generation – EUMETSAT,
ionosphere leading to a greater degree of destructive                    http://www.eumetsat.int/website/home/Satellites/FutureSatellites/Meteo
                                                                         satThirdGeneration/index.html (last access: 8 August 2013).
interference.
                                                                    Gaffard, C., J. Nash, N. Atkinson, A. Bennett, G. Callaghan, E. Hibbett, P.
   The information presented here may be useful in assessing             Taylor, M. Turp, W. and Schulz (2008), Observing lightning around the
the initial performance of the MTG-LI after its predicted                globe from the surface, paper presented at 20th International Lightning
                                                                         Detection Conference, Tucson, Arizona.
launch in 2018 [EUMETSAT, 2013]. Current plans for the
                                                                    Holle, R., K. Cummins, and N. Demetriades (2010), Monthly distributions of
device include introducing a lightning density product, but the          NLDN and GLD360 cloud-to-ground lightning, paper presented at 21st
accuracy of such a product will need to be assessed against              International Lightning Detection Conference, Orlando, Florida, USA.
what is currently understood of lightning density in Europe.        Jacobson, A. R., R. Holzworth, J. Harlin, R. Dowden, and E. Lay (2006),
                                                                         Performance assessment of the world wide lightning location network
    Other parties that might also be interested in such                  (WWLLN), using the Los Alamos sferic array (LASA) as ground truth,
information would be insurance providers, and also energy and            J. Atmos. Ocean. Tech., 23(8), 1082–1092.
utilities companies, who might be better able to assess risks       Lee, A. C. (1986), An operational system for the remote location of lightning
associated with storms over broad regions. Due to averaging              flashes using a VLF arrival time difference technique, J. Atmos. Ocean.
process used in the paper, however, higher resolution data               Tech., 3, 630–642.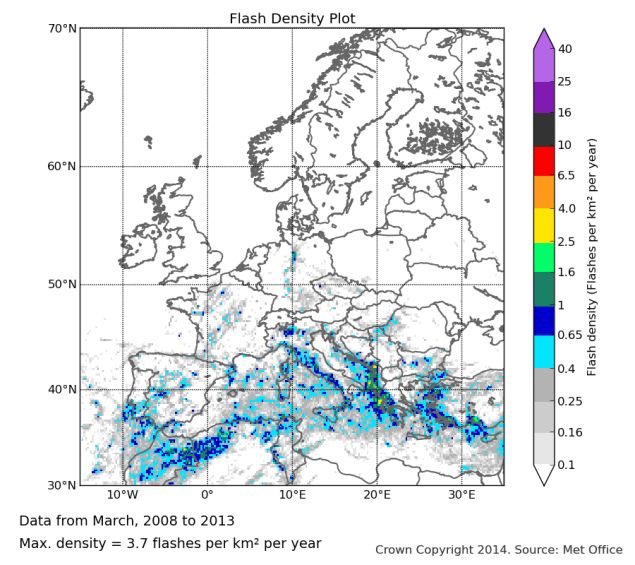
You can also read