Observing Responses to the COVID-19 Pandemic using Worldwide Network Cameras - arXiv
←
→
Page content transcription
If your browser does not render page correctly, please read the page content below
Observing Responses to the COVID-19 Pandemic
using Worldwide Network Cameras
Isha Ghodgaonkar, Abhinav Goel, Fischer Bordwell, Caleb Tung, Sara Aghajanzadeh,
Noah Curran, Ryan Chen, Kaiwen Yu, Sneha Mahapatra, Vishnu Banna, Gore Kao,
Kate Lee, Xiao Hu, Nick Eliopolous, Akhil Chinnakotla, Damini Rijhwani, Ashley Kim,
Aditya Chakraborty, Mark Daniel Ward, Yung-Hsiang Lu, George K. Thiruvathukal†
Purdue University, West Lafayette, IN, USA
† Loyola University Chicago, IL, USA
arXiv:2005.09091v1 [cs.CY] 18 May 2020
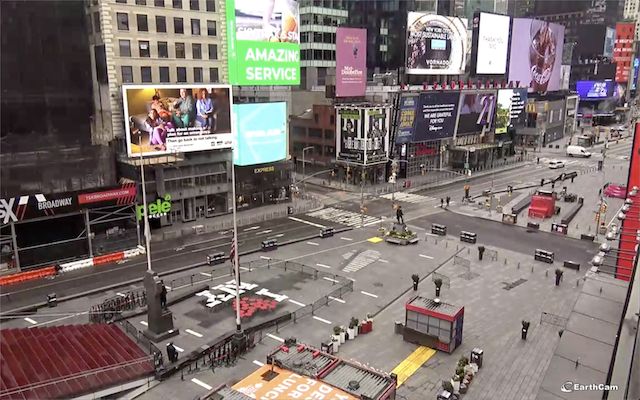
Fig. 1: Times Square, New York. Left: 2019/08/07 (before social distancing). Right: 2020/03/01 (during social distancing).
Source: Earthcam.com
Fig. 2: Another View of the Times Square. Left: 2019/06/23. Right: 2020/03/01. Source: Earthcam.com
Abstract—COVID-19 has resulted in a worldwide pandemic, data from network cameras continuously during the pandemic.
leading to “lockdown” policies and social distancing. The This paper describes the methods to discover network cameras
pandemic has profoundly changed the world. Traditional meth- on the Internet, the methods to collect and manage data, and
ods for observing these historical events are difficult because preliminary results of data analysis. This project can be the
sending reporters to areas with many infected people can put foundation for observing the possible “second wave” in fall
the reporters’ lives in danger. New technologies are needed for 2020. The data may be used for post-pandemic analysis by
safely observing responses to these policies. This paper reports sociologists, public health experts, and meteorologists.
using thousands of network cameras deployed worldwide for
the purpose of witnessing activities in response to the policies. I. I NTRODUCTION
The network cameras can continuously provide real-time visual
data (image and video) without human efforts. Thus, network Figures 1 and 2 show the Times Square in New York
cameras can be utilized to observe activities without risking City before and after the onset of the COVID-19 pandemic.
the lives of reporters. This paper describes a project that uses Such a dramatic change is a result of social distancing, the
network cameras to observe responses to governments’ policies response to this deadly pandemic. However, this change did
during the COVID-19 pandemic (March to April in 2020). The not occur overnight. On 2019/11/17, the first known case
project discovers over 30,000 network cameras deployed in 110
countries. A set of computer tools are created to collect visual of COVID-19 was reported in China [1]. In January 2020,
the World Health Organization (WHO) warned that the fast-
spreading virus could reach other parts of the globe [2].        computer tools is created to handle streaming video. The
News media soon began to compare the coronavirus with the        project started recording data in early March at the rate of
H1N1 influenza pandemic of 1918 [3], [4], [5]. The 1918          0.5TB per week.
influenza infected 500 million people, about a third of the         This paper has the following major contributions: (1)
world’s population at the time, and cause tens of millions of    This paper reports methods to discover network cameras
deaths. By March 2020, COVID-19 cases had spread around          on the Internet. (2) The team creates computer tools that
the world and had been officially labeled as a pandemic [6].     can collect visual data (image and video) periodically from
With China racing to contain the outbreak [7], and with          the thousands of network cameras. (3) This paper reports
no vaccine available, other governments took drastic action      preliminary analysis showing how people respond to the
to slow the spread of the virus. Countries near China, like      policies of social distancing.
South Korea [8] and Taiwan [9], restricted travel to the Chi-
nese mainland, tracked and flagged citizens via healthcare                        II. C AMERA D ISCOVERY
records, and enforced quarantines as deemed necessary. Italy
                                                                    Network cameras are connected to the Internet and can
instituted a nationwide lockdown [10]. Public travel was
                                                                 provide live visual data (image and video) without human
severely limited. Non-essential businesses were closed, and
                                                                 efforts. In order to observe the worldwide responses to
the remaining businesses ran on restricted business hours.
                                                                 COVID-19, thousands of network cameras are needed. Even
The United States published nationwide social distancing
                                                                 though governments, universities, tourist attractions have
recommendations [11]; many states [12], [13] and local gov-
                                                                 deployed network cameras and made the data available to the
ernments [14] imposed stricter regulations. As a result, many
                                                                 public, the data is organized in different styles and retrieval
businesses closed down; layoffs rocked the economy [15],
                                                                 needs different protocols.
and travel dwindled away as many Americans quarantined
                                                                    This research team has created solutions for discovering
themselves in their homes.
                                                                 network cameras automatically. The process is composed
   Due to social distancing, the world has changed dramat-
                                                                 of two modules as shown in Figure 3. The first module
ically. With over three million confirmed cases worldwide
                                                                 discovers websites that may contain live visual data. This
at the end of April 2020 [16], the COVID-19 pandemic is
                                                                 is achieved by a web crawler that receives a set of seed
already a significant entry in the annals of world history.
                                                                 URLs (Uniform Resource Locators) and tabulates a list of
However, documenting and observing the effects of social
                                                                 the links found from crawling the seed URLs. The module
distancing is difficult by traditional methods of journalism
                                                                 identifies the links that may contain live data and sends the
and observation. Dispatching photographers to a location
                                                                 those URLs to the second module. This module determines
could impose health risks. Moreover, some countries have
                                                                 whether visual data is live or not by checking whether the
strict travel restrictions and sending photographers is simply
                                                                 data changes over time. Different methods are needed for
not possible. It is extremely difficult for a person to take
                                                                 handling images and videos as explained below.
photographs at the same locations everyday for comparison
during the month-long lockdown. Therefore, it is necessary       A. Discovery of Image Data
to develop methods of observation that do not require
physical human presence.
   Thousands of network cameras have already been de-
ployed worldwide monitoring traffic, observing national
parks, or for other purposes [17]. These cameras can be used
for observing responses of the lockdown policies. Unfortu-
nately, network cameras are scattered over many websites         Fig. 3: Automatic Network Camera Discovery System [18].
on the Internet. Each website is somewhat different and uses     The system has 2 main parts: (1) Web Crawler module and
unique methods of camera data storage and retrieval. This        (2) Network Camera Identification module.
heterogeneity makes it difficult to find network cameras and
to use them for observing responses to COVID-19.                    After the web crawler discovers a URL (by following
   We have developed a solution to discover network cam-         links from a seed URL), the crawler parses the website
eras and retrieve data from them [18]. The process of            for image formats, such as JPEG and PNG. For any visual
automatic camera discovery is composed of a web crawler          data link found on a web page, the web crawler module
and a module for identifying network cameras. This module        downloads and parses the HTML. The pages are displayed in
distinguishes live data from unchanged images posted on          a web browser environment [18] to ensure all web assets are
websites. The team has discovered over 30,000 cameras            properly loaded to avoid any potential losses of information.
in 110 countries across 6 continents. An image archiver is       The crawler parses the HTML response and searches for data
created in order to retrieve the most recent snapshot from       links common to network cameras such as image-specific
each camera. This archiver can collect images at specified       visual links (e.g. baseURL /camera id.jpg) and video stream
intervals. The archiver can run in parallel and capture images   links (e.g. starting with rtmp::// and rtsp::// or ending with
from multiple cameras simultaneously. A different set of         .mjpg).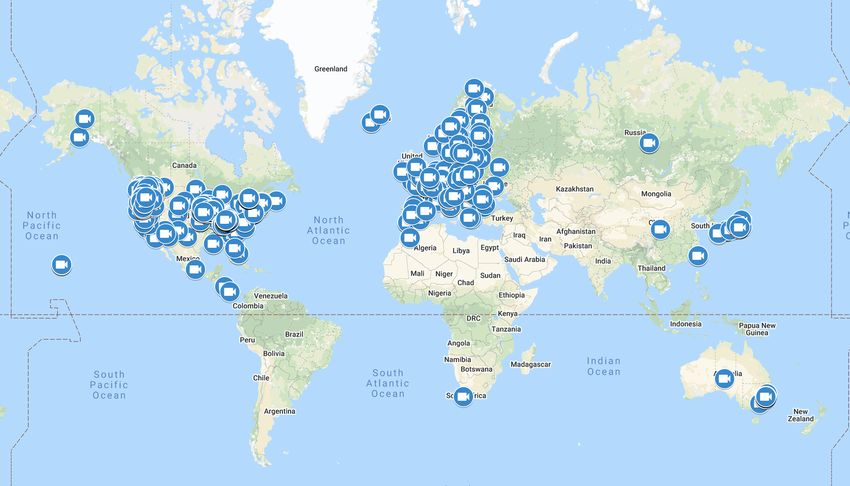
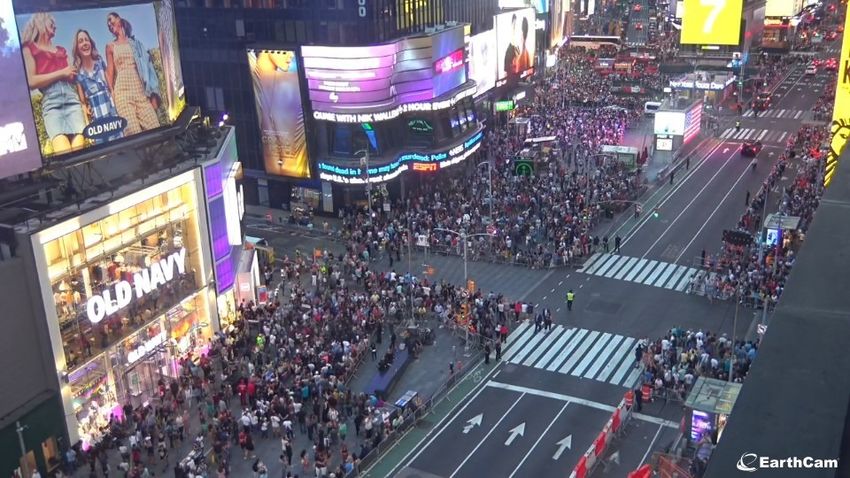
Fig. 4: Map of automatically discovered live image cameras.            Fig. 5: Map of discovered live video cameras.

   After the web crawler aggregates potential links for image
data, the next step involves the network camera identification
module to determine whether such data links connect to
network cameras that update the data frequently. The identi-
fication distinguishes between active camera data (frequently
changing) and web assets (rarely changing). The module
retrieves several images from the data links at different        Fig. 6: Flowchart of the process of extracting a frame from
times, and after each retrieval, compares the images to          a camera using the Image Archiver.
determine the change or lack thereof. The module uses three
different comparison methods: (1) checksum: compare the
file checksum of the images, (2) percent difference: compare     This section explains how to retrieve and save the image or
the percentage of pixels changed between images, and (3)         video data from network cameras. Figure 6 shows the flow
luminance difference: compare the mean pixel luminance           of saving data.
change between images. If the images change over time, the          After the network cameras are discovered, a computer
link is considered as connected to a live network camera.        program saves image data from each camera at defined
                                                                 time intervals (such as every 10 minutes). The program is
B. Discovery of Video Data                                       capable of handling several data formats, including JPEG,
   Video data has different formats from image data. Thus,       or snapshots from MJPEG or H.264 video data.
different methods are needed. This section further distin-          Video data is downloaded at regular intervals using one
guishes two methods for discovery of video data: using web       of several APIs for developers to access video live stream
crawler or using search engines.                                 data. These APIs are built upon a video plugin system. The
   The first approach is based on the same method for dis-       compatible plugin link for each video link was obtained
covering image data by replacing the identification module       before the relevant API methods were invoked to download
for recognizing live video streams. Instead of considering       data.
image formats (JPG or PNG), the crawler considers video
formats: HLS, RTMP, RTSP, and MPEG. The identification                      IV. DATA M ANAGEMENT AT S CALE
module uses Selenium (a web browser that can simulate user
interactions) to load the video stream into a Selenium Web          Capturing visual data from over 30,000 cameras poses two
Driver instance. Using the Selenium API, a screenshot of the     distinct challenges. The first challenge is obtaining enough
video stream is taken to obtain an image. Following the same     computational power to collect visual data. The second
procedure as before, several screenshots are taken and com-      challenge is running the retrieving program in parallel so that
pared to determine whether the stream’s content changes and      data from multiple cameras can be obtained simultaneously.
is likely to be a live video stream. Another method of finding   This is particularly important for video because capturing
live video streams uses an Internet search engine. More          streaming video requires dedicated CPU cores. Being able
specifically, some websites, such as skylinewebcams.com,         to overcome these two challenges is crucial to capturing
earthcam.com, and youtube.com, provide multiple live video       visual data at scale and will become even more important
streams discoverable by search engines, observing beaches,       as we are continuously adding cameras to our list of known
tourist attractions, or city streets. Approximately 400 video    cameras.
cameras were discovered this way. Figures 4 and 5 show the          We address scalability in this work by using Cooley, a
locations of the discovered cameras.                             mid-sized and powerful computational cluster at Argonne
                                                                 Leadership Computing Facility. Through the Director’s Dis-
                   III. DATA C OLLECTION                         cretionary program at Argonne, we have a renewable six-
   In order to compare people’s responses to policy changes,     month allocation of 20,000 node-hours and 300TB of
it is necessary to record the data from the network cameras.     persistent storage. Cooley is primarily targeted to high-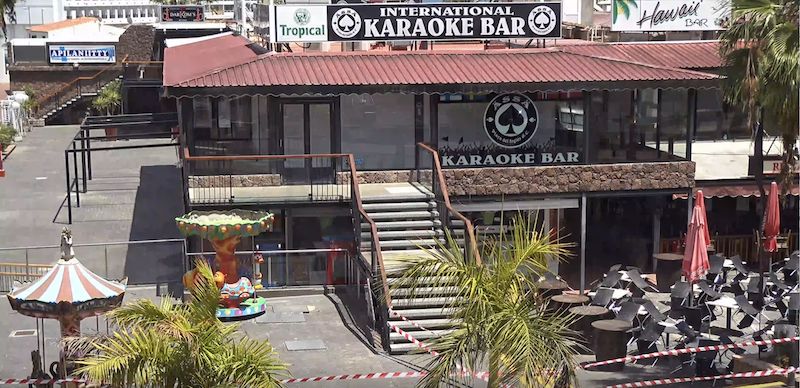
(a) Canada. 7:21 AM on 2020/04/22         (b) Thailand. 3:20 PM on 2020/04/21       (c) Netherlands. 3:29 PM on 2020/04/24

                (d) Las Vegas, USA. 11:09 AM on 2020/04/24                         (e) Netherlands. 3:48 PM on 2020/04/24

Fig. 7: Snapshots from selected network cameras around the world. All times are local time. Sources: (a) DELATECH Calgary,
(b) Teleport.camera, (c) Strandweer.nu, (d) AE Signage, (e) Gran Canaria Live.

                              (a) 2019/05/27                                                   (b) 2020/04/07

                                  Fig. 8: Barry, Wales, United Kingdom. Source: EarthCam.com

performance data visualization workloads, which also makes               simultaneously. As more cameras are discovered, this will
it ideal for capturing video capture and performing analysis.            allow us to take advantage of addtional nodes without having
    Cooley has a total of 126 compute nodes. Each node                   to make any changes to how the jobs are actually submitted.
has two 2.4 GHz Intel Haswell E5-2620 v3 processors
(6 cores per CPU, 12 cores total), with 384GB RAM.                                                 V. R ESULTS
This system uses FDR Infiniband interconnect. Each of the                   We show selected results from many popular locations
compute nodes also has an NVIDIA Tesla K80 dual-GPU                      around the world. We select the images shown in Figures
card. A notable feature of our high-performance computing                1, 2, and 8-11 based on two factors: (1) These locations are
environment is the enormous amount of networked storage                  popular tourist attractions. (2) It is possible to obtain visual
available to store data sets. At the time of writing, over 2             data before COVID-19 for comparison (this project started
PB of storage is available to cluster users. Based on our                recording data in early March 2020). Figure 7 shows the
current data collection rates, we will be able to collect still          diversity of the data among the discovered network cameras,
and video image data for more than one year.                             including karaoke bars and beaches.
    The current focus is on using the image archiver to                     Among the data captured by more than 30,000 cameras,
retrieve data from well over 30,000 cameras via a set of                 we choose these images as samples based on a set of criteria.
short jobs that run on Cooley. The image archiver itself is              All selected images observe locations where large crowds
designed to use all available cores to fetch still image data            are expected because they are popular tourist attractions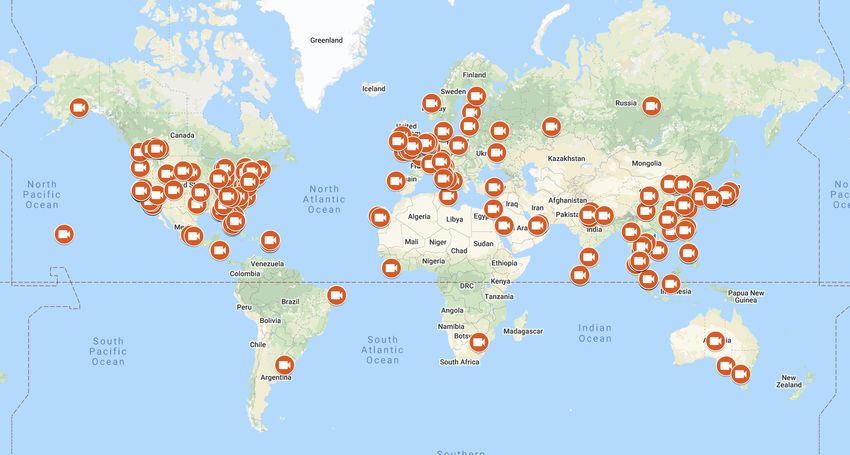
(a) 2019/12/29 (b) 2020/05/09
Fig. 9: Oxford, England, United Kingdom. Source: Oxford Martin School
(a) 2015/03/17 (b) 2020/03/17
Fig. 10: Dublin, Ireland on Saint Patrick’s Day. Source: EarthCam.com
(a) 2019 (b) 2020/04/24
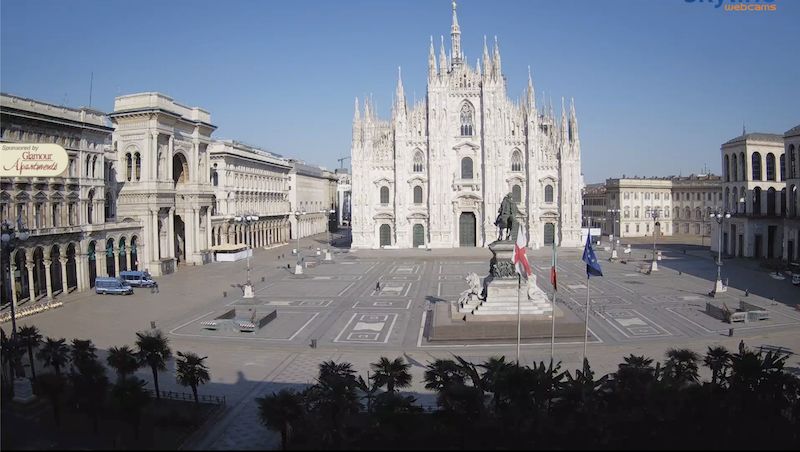
Fig. 11: Milan, Italy. Source: shutterstock.com.
(such as beaches) or places where gathering is expected in 2020 show empty streets and sidewalks because of the
(such as restaurants). Also, the large number of network enforced social distancing guidelines. A similar observation
cameras suggests that some may be disconnected occasion- can be made outside the Milan Cathedral in Milan, Italy, in
ally. For comparison in March and April 2020, we select figure 11. An image from 2019 shows that the cathedral at-
the network cameras which reliably obtain data every day tracted large crowds of people. In 2020, due to the lockdown
because they can provide insight for conducting analysis of in Italy, there are no people visible.
social distancing. The criteria narrow down the number of Figure 8 shows a network camera overlooking a cafe
network cameras to around 100 cameras. Then, we select in Barry, Wales. The beach in Barry is a popular tourist
cameras in different geographical locations and types of attraction in the months of April and May. Figure 8(a)
location (such as beaches and restaurants). is an image taken in April 2019 and shows a crowded
Figure 1(a) and 2(a) show images of the Times Square beach. Figure 8(b) is taken in April 2020: all activity on the
in New York City, USA in 2019. It can be seen that the beach has been disallowed because of the enforced social
sidewalks were filled with people. Figure 1(b) and 2(b) taken distancing guidelines in Wales. A similar observation can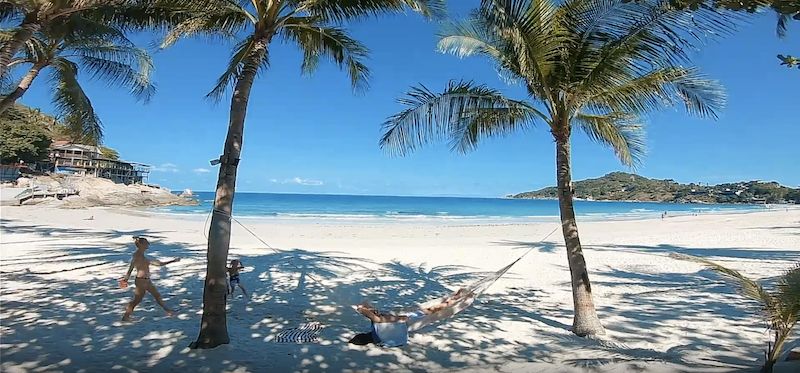
be made in Figure 9 in Oxford, England. Here, a camera                                    VII. C ONCLUSION
overlooking a popular city center shows the difference in           This paper presents the collection of live visual data
the activities between April 2019 and 2020.                      from worldwide network cameras for monitoring responses
   Saint Patrick’s Day is a holiday in Ireland which is widely   to social distancing policies. By comparing the crowds
celebrated in the city of Dublin. Figure 10(a) shows an          before and during COVID-19, the data reveals how people
image from a network camera taken on Saint Patrick’s Day         around the world respond. This research team continuously
2015. The streets were crowded and bustling with activity.       accumulates data and plans to observe the responses when
On Saint Patrick’s Day in 2020, social distancing measures       the policies are lifted. Readers interested obtaining the data
were enforced and significantly fewer people celebrated the      may contact the project’s principal investigator, Dr. Yung-
holiday. Additional results are shown in figure 7. Figure 7(a)   Hsiang Lu (yunglu@purdue.edu).
shows a beach in Calgary, where on the sand, there can
be seen a few people at varying distances from the camera                          VIII. ACKNOWLEDGEMENTS
and from each other. In Figure 7(b), there appears to be            The snapshots shown in this paper are attributed to the
a family walking past a beach goer in a hammock. In              following sources: Earthcam.com, YouTube.com, Skyline
Figure 7(c), there are quite a few people walking along the      Webcams, O’Shea’s Cafe at Barry Island, Shuttershock.com,
beach. In Figure 7(d) and (e) there are no people, although      AE Signage, Gran Canaria Live, Strandweer.nu, DELTAT-
the images show a Shake Shack, which is a popular burger         ECH Calgary, Umbria Webcam, Teleport.camera, and Ox-
joint, and a Karaoke Bar, both during the day. In each of        ford Martin School.
the snapshots, there are no visible crowds. These are some          This research uses resources of the Argonne Leadership
of the comparisons that are made possible with the use of        Computing Facility, which is a DOE Office of Science User
network cameras. These examples are representative of our        Facility supported under Contract DE-AC02-06CH11357.
data set. We observe a dramatic decrease in the number of        We thank the Argonne Leadership Computing Facility for
people on the streets in most countries around the world.        access to the Cooley supercomputer that was used in this
                                                                 study.
                                                                    This project is supported in part by the National Science
                     VI. D ISCUSSION                             Foundation OAC-1535108. Any opinions, findings, conclu-
                                                                 sions or recommendations presented in this material are
                                                                 those of the authors and do not necessarily reflect the views
   These image comparisons are made possible with the use
                                                                 of the National Science Foundation.
of network cameras. We observe a dramatic decrease in the
number of people on the streets in most countries around                                     R EFERENCES
the world from Spring 2019 and earlier, to Spring 2020. We        [1] Josephine Ma. China’s first confirmed Covid-19 case traced back to
continue observing what may happen in these locations over            November 17. South China Morning Post, March 13, 2020.
time after social distancing policies are lifted.                 [2] Stephanie Nebehay. WHO says new China coronavirus could spread,
                                                                      warns hospitals worldwide. Reuters, January 14, 2020.
   Network cameras can be useful to analyze changes of            [3] Rebecca Grant. Rebecca Grant: Coronavirus lessons from 1918
behavior due to COVID-19, or provide valuable data for                Spanish flu – here’s what worked to save lives. Fox News, March
                                                                      22, 2020.
sociologists and health experts for post-pandemic analysis.       [4] Berkeley Lovelace Jr. The coronavirus may be deadlier than the 1918
For example, do people keep longer distances in crowds?               flu: Here’s how it stacks up to other pandemics. CNBC, March 26,
Moreover, a study cross-referencing social media and public           2020.
surveillance camera data can be used in emergencies [19].         [5] John M. Barry. Opinion: The Single Most Important Lesson From
                                                                      the 1918 Influenza. The New York Times, March 17, 2020.
The data set collected for this paper can be useful for           [6] Ryan Saavedra. Global Emergency Declared Over Coronavirus; First
researchers for a variety of analyses. The data may also be           Transmission Confirmed In U.S. The Daily Wire, January 30, 2020.
used to evaluate whether existing technologies of computer        [7] Emily Feng. With Thousands Sick, China Tries To Contain Coron-
                                                                      avirus. NPR, January 28, 2020.
vision are ready to analyze the vast amounts of data for          [8] Fred Lucas. 5 Things to Know About South Korea’s Response to
future pandemics. In the near future, we wish to answer               Coronavirus. The Daily Signal, March 27, 2020.
the following question: Is computer vision ready to analyze       [9] James Griffiths. Taiwan’s coronavirus response is among the best
                                                                      globally. CNN, April 5, 2020.
crowd behavior such as walking speeds, crowd density, and        [10] Danielle Wallace. Italy faces first day of nationwide coronavirus
mask usage? Data from network cameras is significantly                lockdown, Europe to discuss spread of epidemic. Fox News, March
different from commonly used data sets due to ambient                 10, 2020.
                                                                 [11] Rochard Harris. White House Announces New Social Distancing
lighting; the data usually contains many objects, each with           Guidelines Around Coronavirus. NPR, March 16, 2020.
a few pixels [20].                                               [12] Ryan Saavedra. Virginia Governor Ralph Northam Announces Stay-
                                                                      At-Home Order Till June 10. The Daily Wire, March 30, 2020.
   This research project follows the guidelines set by Purdue    [13] Paul Bois. Illinois Issues Stay-At-Home Order Following California
University for protecting privacy, approved by Purdue’s               And New York. The Daily Wire, March 20, 2020.
Institutional Review Board Protocol 2020-460. This study         [14] Brad Johnson. Joint Shelter Order Issued by the City of Austin, Travis
                                                                      County, Williamson County. The Texan, March 24, 2020.
analyzes only the aggregate information about crowd density      [15] Eric Guilford. A Second Round of Coronavirus Layoffs Has Begun.
and does not identify any individuals.                                Few Are Safe. The Wall Street Journal, April 14, 2020.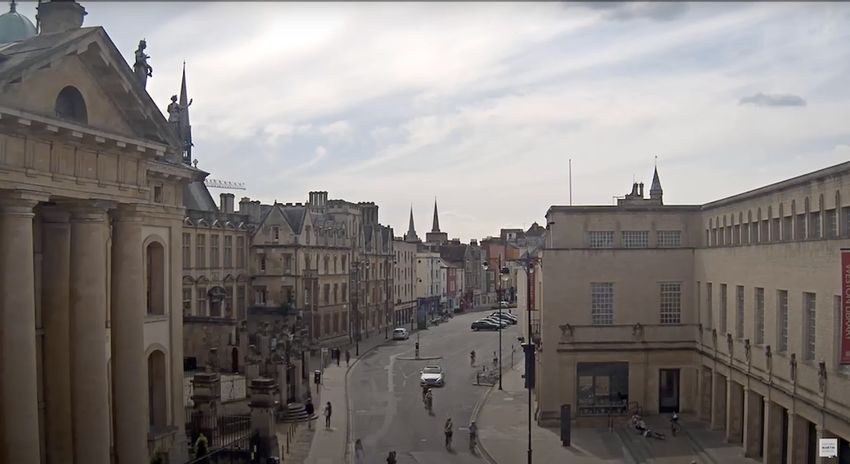
[16] Jez Azner. Worldwide Confirmed Coronavirus Cases Top 2 Million.
     The New York Times, April 14, 2020.
[17] Yung-Hsiang Lu, George K. Thiruvathukal, Ahmed S. Kaseb, Kent
     Gauen, Damini Rijhwani, Ryan Dailey, Deeptanshu Malik, Yutong
     Huang, Sarah Aghajanzadeh, and Minghao Guo. See the world
     through network cameras. IEEE Computer pages 30-40, Volume 52,
     Issue 10, October 2019.
[18] Ryan Dailey, Aniesh Chawla, Andrew Liu, Sripath Mishra, Ling
     Zhang, Josh Majors, Yung-Hsiang Lu, and George Thiruvathukal.
     Automated discovery of network cameras in heterogeneous web
     pages. Submitted for Review, March 2020.
[19] Chittayong Surakitbanharn, Calvin Yau, Guizhen Wang, Aniesh
     Chawla, Yinuo Pan, Zhaoya Sun, Sam Yellin, David Ebert, Yung-
     Hsiang Lu, and George K. Thiruvathukal. Cross-referencing social
     media and public surveillance camera data for disaster response. IEEE
     Symposium on Technologies for Homeland Security, 2018.
[20] Caleb Tung, Matthew R. Kelleher, Ryan J. Schlueter, Binhan Xu,
     Yung-Hsiang Lu, George K. Thiruvathukal, Yen-Kuang Chen, and
     Yang Lu. Large-scale object detection of images from network
     cameras in variable ambient lighting conditions. IEEE International
     Conference on Multimedia Information Processing and Retrieval,
     April 2019.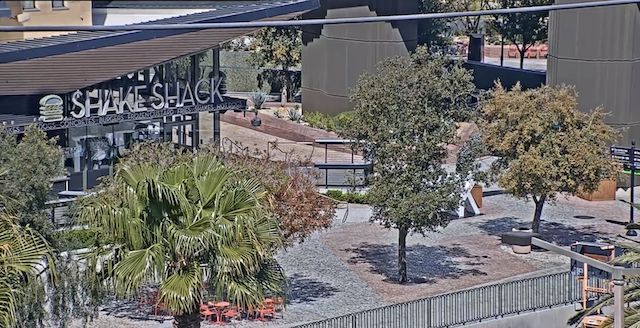
You can also read