SolarView: Georgia Solar Adoption in Context - MDPI
←
→
Page content transcription
If your browser does not render page correctly, please read the page content below
data
Data Descriptor
SolarView: Georgia Solar Adoption in Context
Jacqueline Hettel Tidwell 1, * , Abraham Tidwell 2 , Steffan Nelson 1 and Marcus Hill 1
 1   Social Energy Atlas, Franklin College of Arts and Sciences, University of Georgia, Athens, GA 30602, USA;
     steffan.nelson@uga.edu (S.N.); marcdh@uga.edu (M.H.)
 2   College of Agriculture and Environmental Sciences, University of Georgia, Athens, GA 30602, USA;
     abraham.tidwell@uga.edu
 *   Correspondence: jacqueline.tidwell@uga.edu

 Received: 4 November 2018 ; Accepted: 4 December 2018 ; Published: 7 December 2018

 Abstract: The local-national gap is a problem currently plaguing the adoption of emerging
 technologies targeted at resolving energy transition issues that are characterized by disparities in the
 adoption of innovations and policies on a local level in response to national policy implementation.
 These disparities reflect a complex system of technical, economic, social, political, and ecological
 factors linked to the perceptions held by communities and how they see energy development and
 national/global policy goals. This dataset is an attempt to bridge the local-national gap regarding
 solar PV adoption in the State of Georgia (U.S.) by aggregating variables from seven different
 publicly-available sources. The objective of this activity was to design a resource that would help
 researchers interested in the context underlying solar adoption on the local scale of governance
 (e.g., the county level). The SolarView database includes information necessary for informing
 policy-making activities such as solar installation information, a historical county zip code directory,
 county-level census data, housing value indexes, renewable energy incentive totals, PV rooftop
 suitability percentages, and utility rates. As this is a database from multiple sources, incomplete data
 entries are noted.

 Dataset: doi:10.5281/zenodo.1477581.

 Dataset License: CC-BY-NC-SA

 Keywords: solar; technology adoption; demographics; mixed methods

1. Summary
      The local-national gap is a problem currently plaguing the adoption of emerging technologies
targeted at resolving energy transition issues that are characterized by disparities in the adoption of
innovations and policies on a local level in response to national policy implementation. It is becoming
increasingly apparent that individual communities do not necessarily share the same energy wants
and needs with one another, and as noted in multiple studies of energy development projects [1,2],
the alignment of value systems between energy sources and local needs plays a significant role in how,
if at all, these sources are used [3].
      Studies of the barriers and opportunities for implementing social innovations in the deployment
of solar photovoltaics include a variety of qualitative, quantitative, and mixed methods approaches.
These analyses are broadly concerned with identifying and reducing the barriers to adoption that
occur at the level of policy-making (state or national), or within the decision-making processes
of individuals. Nation-state-level analyses seek to impact how policy conversations pertaining to
technology development, incentive structures, and other financial mechanisms enable sustainable
energy transitions. Agent-based modeling studies [4,5] leverage data gathered at the national scale,

Data 2018, 3, 61; doi:10.3390/data3040061                                          www.mdpi.com/journal/data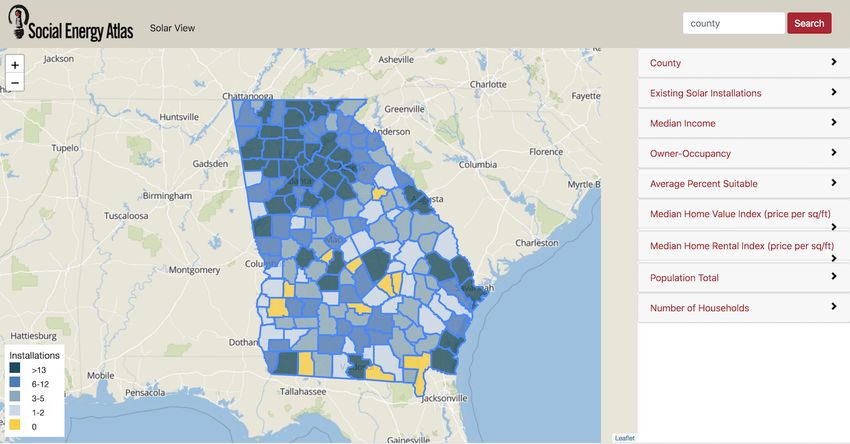
Data 2018, 3, 61 2 of 12
such as PV cost trends, solar irradiance, and incentive programs, to identify the capacity and location
of future installations. A complimentary body of studies focuses on evaluating policy trends in high
solar penetration areas (e.g., California) to generalize the possible impacts and limitations for other
societies and institutional frameworks [6–9].
Individual and collective behavior analyses also seek to intercede in policy development.
Where they differ is in the focus on identifying opportunities for social programs that enable
knowledge sharing between individuals and communities. Individual adopter motivations [10],
social networks [11,12], and perceptions of the technology [13–15] are the focus: these are elucidated
through a series of surveys, semi-structured interviewing, and in some cases, ethnographic analysis.
A key result from this body of work is the recognition that non-financial factors such as peer effects
and the perception of self as an innovator [16] also drive when and how people adopt solar.
Nevertheless, gaps persist in our understanding of the disparities between national policy
conversations about solar adoption and local action towards these goals. Known as the “local-national
gap,” this burgeoning area of research seeks to establish a space for national policy analyses and studies
of individual motivations with community-level dynamics. Wüstenhagen, Wolsink, and Burer [17]
noted that societal acceptance of energy technologies such as solar depends on factors such as
socio-political acceptance, community acceptance, and market acceptance. These factors highlight
that communities respond to new technologies in complex ways that belie perceptions of pro- and
anti-innovation communities (NIMBYism). Batel and Devine-Wright [18] and Hess et al. [19] further
posited that redressing the incoherence between national and local trends will require examining how
actors independently and collectively interact and make decisions at scales ranging from individual
communities to national action.
As described in Tidwell, Tidwell, and Nelson [20], there is a state within the United States of
America that proves to be an interesting case study for investigating issues of local adoption of national
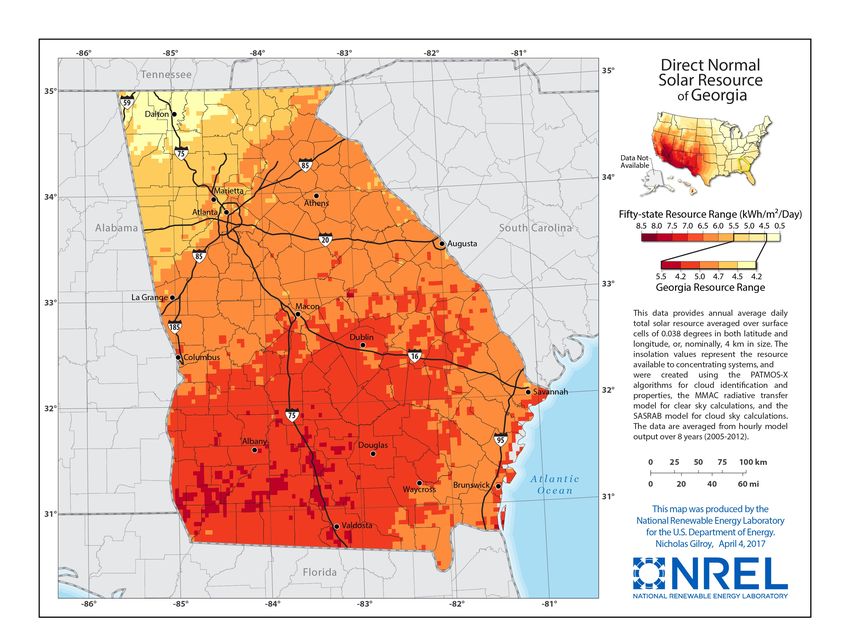
renewable energy policy: Georgia. The Energy Information Administration positions Georgia as a
leader in biomass energy production and an emerging space for the deployment of photovoltaic solar
in the utility, commercial, and residential sectors [21]. Its status as an emergent space for PV solar
is reflective of the perceived high potential for solar energy in Georgia in terms of solar insolation,
it having some of the highest in the southeastern United States (Figure 1).
Figure 1. Solar irradiance map of the State of Georgia [22].Data 2018, 3, 61 3 of 12
As a result of the size of the Georgian economy (ninth in the country by gross domestic product)
and its existing energy system characteristics, Georgia is posited to be one of the states with the highest
potential for solar deployment [23]. Recent trends in solar adoption seem to reflect these analyses.
Between 2017 and 2018, total net generation from solar photovoltaic rose from 22nd in the
nation [24] to ninth [21], moving Georgia from laggard to leader in solar power production [25]. Policy
changes, including the Solar Power Free-Market Financing Act of 2015, have opened possibilities for
integrating solar from third-party producers despite the lack of net metering policies or a renewable
portfolio standard. Despite this seemingly positive uptake in energy generation through solar-powered
technologies, a closer look locally indicates that the primary driving force is the integration of several
utility and commercial-scale solar facilities. In 2018, Georgia ranked 37th in power generated from
residential PV solar, making it the lowest ranked state amongst the top ten in total PV solar energy
production. Despite recent increases in the annual generation of electricity from solar installations in
the State of Georgia—primarily a result of new utility-scale installations [21]—there is still a significant
amount of potential for solar technology adoption for Georgia (see Table 1 [26]).
Table 1. Georgia energy data solar electric installations’ summary.
Use Sector Number of Installations Capacity Annual Generation
Residential 1046 5822.99 kW 8,128,855.02 kWh
Non-Residential 599 52,755.53 kW 74,278,797.37 kWh
Utility 235 1,250,862.51 kW 1,873,396,033.13 kWh
One might wonder how a state positioned for high technical potential could have such low levels
of adoption.
Respecting the complex interactions that exist within the local-national gap requires an eye
towards understanding the multi-modal flows of information that are attuned to local policy-making
conditions. The Social Energy Atlas, a program funded by the United States Department of Energy
Solar Energy Technology Office, leverages large-scale qualitative and quantitative data analysis for
examining why residents of the State of Georgia do or do not adopt rooftop photovoltaic solar [27].
The primary objective of this work is to develop more effective policy and programming to bridge the
local-national gap in Georgia, through large-scale analysis of the stories people array when making
such decisions about energy.
To address the limitation of existing adoption trend datasets at the scale of local governance
(e.g., county governments), this data descriptor for SolarView, a web application designed by the
Social Energy Atlas (see Figure 2), depicts how the aggregation of seven independent databases was
conducted, so as to afford the Social Energy Atlas the ability to contextualize solar technology adoption
at a local level of scale through the analysis of quantitative data for the State of Georgia, U.S., and
demonstrate the complexity systems that are currently giving rise to significant disparity in adoption
practices in this state using Gini coefficient calculations [20].Data 2018, 3, 61 4 of 12
Figure 2. The Social Energy Atlas SolarView web application provides a dynamic experience for users
interested in visually searching and experiencing patterns in Georgia (U.S.) solar adoption data.
The rest of the paper seeks to describe the dataset that was produced during the first phase of the
Social Energy Atlas’ research activities, as well as how it was brought together. In Section 2, a detailed
description of the data comprising SolarView is provided. Section 3 provides the methods that were
employed for curating and reusing the data. Finally, this data descriptor ends with Section 4, detailing
notes for users of this database going forward.
2. Data Description
The data contained within the Supplementary Materials provides a contextually-focused
perspective on solar adoption in the State of Georgia, U.S., at the county level and is comprised
of nine relational CSV files. While currently, there are no solar installation data points for 11 of
Georgia’s 159 counties, this dataset does include contextual data that have been curated for every
county. Descriptions of the variables included in the dataset are provided below, while justifications
for the curation of this dataset from each data source can be found in Section 3.
2.1. File Architecture
The Georgia SolarView dataset is a relational database. The .csv files described in this section are
related to one another through either zip code or Federal Information Processing Standard (FIPS) ID.
A README file and a copy of Figure 3 are included in the data archive as well.Data 2018, 3, 61 5 of 12
Figure 3. This figure is an entity relationship diagram depicting the relationships between all of the
.csv files for this dataset that are described in Tables 1–8.
2.2. County Identification
The primary variable upon which this dataset is organized is the FIPS code for each county within
the State of Georgia. The data within county-name.csv are the basis upon which the entire database
is organized.
2.3. Historical County Zip Code Directory
Zip codes, while useful to many social scientists, are a dynamic class of variables constantly being
added to, changed, and realigned to different counties per the needs of the U.S. Postal Service [28].
Thus, a historical directory of zip codes was determined to be necessary for this project, was included
for the years 2010–2018, and can be found in sea-zipcode-county.csv.Data 2018, 3, 61 6 of 12
Table 2. List of variables included in sea-zipcode-county.csv.
Variable Description
sea-zip-id Unique ID for zip code entries
zip Zip code
fips FIPScode for each county
year Year for which a zip code and county relationship is valid
2.4. Solar Installation Data
For each documented solar installation in the State of Georgia, a series of characteristics was
included as part of the data analysis for better understanding the context underlying solar technology
adoption on the county level.
Table 3. List of variables included in sea-solar-installations.csv.
Variable Description
sea-install-id Unique ID for identifying originating data source
zipcode Zip code for solar installation
fips County FIPS ID of solar installation
town Town or municipality of solar installation
state State of solar installation location
system-type Type of solar system for the installation
sector Sector type for installation location: e.g., residential or utility
install-date Date of installation
utility Utility of the installation
federal-cong-dist Federal Congressional District of installation
state-senate-dist State Senate District of installation
state-house-dist Federal House of Representatives District of installation
lat Latitude of solar installation (key)
long Longitude of solar installation (key)
As these data were curated from multiple outside sources, their completeness is not guaranteed.
Refer to Section 3.2 for details regarding data verification for this table.
2.5. Solar Rooftop Suitability
Data are also included for better understanding the disparity in the presence of solar installations
in the State of Georgia and that relationship in with the degree of rooftop suitability available for
each county.
Table 4. List of variables included in sea-solar-suitability.csv.
Variable Description
zipcode Zip code for each rooftop suitability estimation
locale Classification of the nature of the area: e.g., large suburb or fringe rural areas
nbld Number of existing rooftops identified in that location and included in the estimation
pct-suitable Estimated percent suitability of existing rooftops for PV
2.6. County Demographics
A selected number of U.S. Census Bureau demographic variables were also included for contextual
analysis. In addition to the county FIPS ID codes, critical contextual data that were necessary for
establishing relationships to socioeconomic status (median income), housing status (percentage of
owner occupancy), population density (total population), and race (estimated percentage by racial
group) were selected for inclusion in the SolarView database.Data 2018, 3, 61 7 of 12
Table 5. List of variables included in sea-county-census.csv.
Variable Description
fips County FIPS ID
med-income Median income for the county
owner-occ Estimated percentage of homes occupied by its owner for the county
pop-total Total estimated population for the county
dem-fem-pct Estimated percentage of female residents in the county
dem-male-pct Estimated percentage of male residents in the county
dem-white-pct Estimated percentage of white residents in the county
dem-baa-pct Estimated percentage of black or African American residents in the county
dem-aian-pct Estimated percentage of American Indian or Alaskan Native residents in the county
dem-a-pct Estimated percentage of Asian residents in the county
dem-nhpi-pct Estimated percentage of Native Hawaiian or Pacific Islander residents in the county
dem-two-pct Estimated percentage of residents identifying as being of two or more races in the county
dem-hl-pct Estimated percentage of Hispanic or Latino residents in the county
dem-vet Estimated number of veterans residing in the county
dem-hh Estimated number of households in the county
2.7. Zillow Indexes
Median home value and rental value indexes are also provided for analysis. Due to the rural
nature of Georgia and limited number of available data points for public sales and rental information
in some counties, there are not values for all of Georgia’s 159 counties. Refer to Section 3.2 for details
regarding data verification for this table.
Table 6. List of variables included in sea-county-zillow.csv.
Variable Description
fips County FIPS ID
med-zhvi Median Zillow Home Value Index
med-zrvi Median Zillow Rental Value Index
2.8. Renewable Energy Incentives
For each county, there are varying levels of renewable energy incentives documented as being
available. The number of active incentives by type are provided in sea-dsire-incentives.csv.Data 2018, 3, 61 8 of 12
Table 7. List of variables included in sea-dsire-incentives.csv.
Variable Description
fips County FIPS ID
fed-total Total number of federal incentives
fed-fin-incent-total Total number of federal financial incentives
fed-fin-incent-corp-deprec Number of federal corporate depreciation financial incentives
fed-fin-incent-corp-tax-credit Number of federal corporate tax credit financial incentives
fed-fin-incent-corp-tax-deduction Number of federal corporate tax deduction financial incentives
fed-fin-incent-corp-tax-exemption Number of federal corporate tax exemption financial incentives
fed-fin-incent-grant-prog Number of federal grant program financial incentives
fed-fin-incent-loan-prog Number of federal loan program financial incentives
fed-fin-incent-pers-tax-credit Number of federal personal tax credit financial incentives
fed-fin-incent-pers-tax-exemption Number of federal personal tax exemption financial incentives
fed-reg-policy Total number of federal regulatory policies
fed-reg-policy-appeq-eff-stand Number of federal appliance and equipment efficiency standard regulatory policies
fed-reg-policy-energy-stand-build Number of federal energy standards for public buildings’ regulatory policies
fed-reg-policy-gpp Number of federal green power purchasing regulatory policies
fed-reg-policy-interconn Number of federal interconnection regulatory policies
fed-tech-res Total number of federal technical resources
fed-tech-res-energy-analysis Number of federal energy analysis technical resources
fed-tech-res-training-info Number of federal training information technical resources
state-total Total number of state incentives
state-fin-incent-total Total number of state financial incentives
state-fin-incent-grant-prog Number of state grant program financial incentives
state-fin-incent-loan-prog Number of state loan program financial incentives
state-fin-incent-other Number of state other financial incentives
state-fin-incent-PACE-fi Number of state Property Assessed Clean Energy (PACE) Financing programs financing financial incentives
state-fin-incent-perf-based Number of state performance-based financial incentives
state-fin-incent-rebate Number of state rebate financial incentives
state-fin-incent-sales-tax Number of state sales tax financial incentives
state-reg-policy Total number of state regulatory policies
state-reg-policy-build-energy-code Number of state building energy code regulatory policies
state-reg-policy-energy-stand-build Number of state energy standards for public buildings’ regulatory policies
state-reg-policy-interconn Number of state interconnection regulatory policies
state-reg-policy-net-metering Number of state building net metering regulatory policies
state-reg-policy-solar-wind-access Number of state solar and wind access regulatory policies
state-tech-res Total number of state technical resources
state-tech-res-energy-analysis Number of state energy analysis technical resources
state-tech-res-other Number of state other technical resources
state-tech-res-training-info Number of state training information technical resources
2.9. Electric Utilities
As many diverse local governance structures the State of Georgia has, it also has a great number
of utilities that help to provide infrastructural resources across the state. There are two files that help to
provide information about the utility landscape of this state: a table listing the names and ownership
structures of each utility (See Table 8) and a table listing the utility rates by zip code for the state
(See Table 9).
Table 8. List of variables included in sea-utility-id.csv.
Variable Description
utility-id Unique identifier for each utility
name Utility name
ownership Ownership type
Table 9. List of variables included in sea-utility-rates.csv.
Variable Description
sea-rate-id Unique identifier for the utility rate for each zip code
year Year for which the rate is provided
zip Zip code for each utility rate
utility-id Unique identifier for each utility
service-type Type of rate service
comm-rate Commercial rate per kWh
ind-rate Industry rate per kWh
res-rate Residential rate per kWhData 2018, 3, 61 9 of 12
3. Methods
The main methods applied to collect and treat, as well as to use and reuse the data are given here,
as well as notes on the validation and curation techniques applied and on the data quality, noise, etc.
3.1. Data Sources
The SolarView database is an aggregation of seven independent data sources that each provide
an important aspect of solar adoption at the county-level in Georgia, U.S.:
1. Georgia Energy Data Solar Map [26]
2. Open PV Project [29]
3. PV-Suitable Rooftop Resources [30]
4. American Community Survey (2016) [31]
5. Zillow Research Data [32]
6. DSIRE Programs [33]
7. U.S. Electric Utility Companies and Rates [34]
All available entries that correlated with Georgia’s 159 counties and the zip codes within them
were marked for inclusion in the aggregated dataset.
Not all variables within each of the seven databases were included for SolarView, however.
Only those variables that were determined to be of imminent or future interest to the Social Energy
Atlas’ focus on understanding local Georgia perspectives of solar technology adoption were retained.
Once the variables of interest for SolarView had been identified, three independent queries were
performed on the seven databases and returned the same number of results each time. Convinced of
the validity of these outputs, the contents of those queries were then verified for completeness.
In order to determine if the data comprising the SolarView database were complete, this was
verified in two ways: first, by importing them on a Drupal CMS that was configured according to
the relationships described in Figure 1 and, secondly, by flattening all of the data and parsing them
through an Apache SOLR 6.6 indexer. Through this process, it was confirmed that several of the data
streams comprising the SolarView aggregated database were incomplete in nature; an observation that
was expected by the research team.
3.2. Dataset Verification
First of all, all of the solar installations in the SolarView database were collected from two different
sources: Southface’s Georgia Energy Data Map and the National Renewable Energy Laboratory’s Open
PV Dataset [26,29]. These two sources have similar, but yet different, metadata systems. The Georgia
Energy Data Map had a more comprehensive metadata standard, so the decision was made to use its
variables so as not to lose future information that might be useful. Thus, the following variables for
sea-solar-installations.csv were incomplete for one or more data points: zipcode (1), town (40), utility
(1544), federal-cong-dist (1380), state-senate-dist (1380), state-house-dist (1380), lat (22), and long (22).
It was also determined that data were incomplete for the file labeled sea-county-zillow.csv.
Zillow uses a combination of data points such as physical characteristics of the home, prior sales
history, tax assessments, and geographic location to estimate sales prices using a proprietary statistical
model that is backed by machine learning processes [35]. The resulting home sales value or rental
value prices are an estimation based on the patterns they observe in the data. As a result, Zillow is
often unable to calculate prices for areas in which they have a statistically limited number of data
points. For Georgia’s 159 counties that are described in the SolarView database, there are 75 counties
for which no Zillow Home Value Index is available and 42 counties for which no Zillow Rental Value
Index data are available.Data 2018, 3, 61 10 of 12
4. User Notes
The data can be visualized and viewed through a faceted search provided through the Social Energy
Atlas SolarView web portal http://sea.galib.uga.edu/solarview. This node.JS GIS application is powered
by an Apache Solr index that dynamically visualizes the number of installations per county based on
contextual filtering (see Figure 2). The data themselves can be accessed at https://github.com/social-
energy-atlas/solarview-data.
Though, as noted in [20], the political influence of Georgia’s county governments is significant
when compared to other parts of the United States, the opportunities derived from similar datasets
and analyses could influence other relevant scales of governance (e.g., municipal governments
seeking local energy control, like the city of Boulder, Colorado). For example, this and similar
information gathered and parsed at the county level can aid individual local governments and
those seeking to create transparency around energy decision-making in clearly-defining barriers and
opportunities for impacting local policy. Furthermore, a county-specific distribution of solar disparities
can provide context for future state-level policy discussions concerning regional equity in energy
access, economic opportunities for sustainable development, and potentially, future region-specific
solar incentive programs.
Author Contributions: Conceptualization: J.H.T.; methodology: J.H.T.; validation: J.H.T., M.H., S.N., and A.T.;
investigation: J.H.T., S.T., M.H., and A.T.; data curation: J.H.T.; data verification: S.T. and M.H.; writing, original
draft preparation: J.H.T.; writing, review and editing: J.H.T. and A.T.; project administration: J.H.T.; funding
acquisition: J.H.T.
Funding: This project was funded by the U.S. Department of Energy’s Solar Energy Technology Office, Award
DE-EE0007664.
Acknowledgments: The authors would first like to acknowledge the support of the U.S. Department of Energy
Solar Energy Technologies Office, without whom this work would not be possible. Moreover, they would like to
acknowledge Southface for its work in managing and updating the Georgia Energy Data portal, from which most
of the solar installation data were retrieved. We would also like to acknowledge the work of Steffan Nelson and
Marcus Hill in migrating this dataset into the Social Energy Atlas SolarView web application.
Conflicts of Interest: The authors declare no conflict of interest.
Abbreviations
The following abbreviations are used in this manuscript:
SEA Social Energy Atlas
PV photovoltaic solar
NREL National Renewable Energy Laboratory
FIPS Federal Information Processing Standards
PACE Property Assessed Clean Energy
DSIRE Database of State Incentives for Renewables & Efficiency
References
1. McKay, K. Socio-Cultural Dimensions of Cluster vs. Single Home Photovoltaic Solar Energy Systems in
Rural Nepal. Sustainability 2010, 2, 494–504. [CrossRef]
2. Zhao, X.; Zhao, H.; Jiang, L.; Lu, C.; Xue, B. The Influence of Farmers’ Livelihood Strategies on Household
Energy Consumption in the Eastern Qinghai-Tibet Plateau, China. Sustainability 2018, 10, 1780. [CrossRef]
3. Sovacool, B. Exploring and Contextualizing Public Opposition to Renewable Electricity in the United States.
Sustainability 2009, 1, 702–721. [CrossRef]
4. Denholm, P.; Drury, E.; Margolis, R. The Solar Deployment System (SolarDS) Model: Documentation and Sample
Results (Technical Report No. NREL/TP-6A2-45832); National Renewable Energy Lab: Golden, CO, USA, 2009.
Available online: https://www.nrel.gov/docs/fy10osti/45832.pdf (accessed on 15 November 2018).
5. Zhang, H.; Vorobeychik, Y.; Letchford, J.; Lakkaraju, K. Data-drien agent-based modeling, with application
to rooftop solar adoption. Auton. Agents Multi-Agent Syst. 2016, 30, 1023–1049. [CrossRef]Data 2018, 3, 61 11 of 12
6. Laird, F. Solar Energy, Technology Policy, and Institutional Values; Cambridge University Press: Cambridge,
UK, 2001.
7. Del Río, P.; Mir-Artigues, P. Support for solar PV deployment in Spain: Some policy lessons. Renew. Sustain.
Energy Rev. 2012, 16, 5557–5566. [CrossRef]
8. Hoppmann, J.; Huenteler, J.; Girod, B. Compulsive policy-making—The evolution of the German feed-in
tariff system for solar photovoltaic power. Res. Policy 2014, 43, 1422–1441. [CrossRef]
9. Van Benthem, A.; Gillingham, K.; Sweeney, J. Learning-by-Doing and the Optimal Solar Policy in California.
Energy J. 2008, 29, 131–151. [CrossRef]
10. Rai, V.; Reeves, D.C.; Margolis, R. Overcoming barriers and uncertainties in the adoption of residential solar
PV. Renew. Energy 2016, 89, 498–505. [CrossRef]
11. Graziano, M.; Gillingham, K. Spatial patterns of solar photovoltaic system adoption: The influence of
neighbors and the built environment. J. Econ. Geogr. 2015, 15, 815–839. [CrossRef]
12. Noll, D.; Dawes, C.; Rai, V. Solar Community Organizations and active peer effects in the adoption of
residential PV. Energy Policy 2014, 67, 330–343. [CrossRef]
13. Faiers, A.; Neame, C. Consumer attitudes towards domestic solar power systems. Energy Policy 2006, 34,
1797–1806. [CrossRef]
14. Komendantova, N.; Patt, A.; Barras, L.; Battaglini, A. Perception of risks in renewable energy projects: The
case of concentrated solar power in North Africa. Energy Policy 2012, 40, 103–109. [CrossRef]
15. Urpelainen, J.; Yoon, S. Solar home systems for rural India: Survey evidence on awareness and willingness
to pay from Uttar Pradesh. Energy Sustain. Dev. 2015, 24, 70–78. [CrossRef]
16. Schelly, C. Residential solar electricity adoption: What motivates, and what matters? A case study of early
adopters. Energy Res. Soc. Sci. 2014, 2, 183–191. [CrossRef]
17. Wüstenhagen, R.; Wolsink, M.; Bürer, M.J. Social acceptance of renewable energy innovation: An introduction
to the concept. Energy Policy 2007, 35, 2683–2691. [CrossRef]
18. Batel, S.; Devine-Wright, P. A critical and empirical analysis of the national-local “gap” in public responses
to large-scale energy infrastructures. J. Environ. Plan. Manag. 2015, 58, 1076–1095. [CrossRef]
19. Hess, D.J.; Mai, Q.D.; Skaggs, R.; Sudibjo, M. Local matters: Political opportunities, spatial scale, and support
for green jobs policies. Environ. Innov. Soc. Trans. 2018, 26, 158–170. [CrossRef]
20. Tidwell, J.H.; Tidwell, A.; Nelson, S. Surveying the Solar Power Gap: Assessing the Spatial Distribution of
Emerging Photovoltaic Solar Adoption in the State of Georgia, U.S.A. Sustainability 2018, 10, 4117. [CrossRef]
21. U.S. Energy Information Administration. Electric Power Monthly February 2018; U.S. Government Printing
Office: Washington, DC, USA, 2018. Available online: https://www.eia.gov/electricity/monthly/archive/
february2018.pdf (accessed on 8 November 2018).
22. Direct Normal Solar Resource of Georgia. Available online: https://www.nrel.gov/gis/images/state-level-
resource-maps/dni/Georgia-DNI-2017-01.jpg (accessed on 15 November 2018).
23. Croucher, M. Optimal Deployment of Solar Index. Electr. J. 2010, 23, 75–81. [CrossRef]
24. U.S. Energy Information Administration. Electric Power Monthly February 2017; U.S. Government Printing
Office: Washington, DC, USA, 2017. Available online: https://www.eia.gov/electricity/monthly/archive/
february2017.pdf (accessed on 8 November 2018).
25. Rojc, P. Georgia’s Conservative Path to a Solar Power Boom. Planetizen. 2018. Available online: https:
//www.planetizen.com/news/2018/06/99370-georgias-conservative-path-solar-power-boom (accessed
on 15 November 2018).
26. Georgia Energy Data. Available online: http://www.georgiaenergydata.org/solarmap (accessed on
25 July 2018).
27. Tidwell, J.H.; Tidwell, A.S.D. Energy ideals, visions, narratives, and rhetoric: Examining sociotechnical
imaginaries theory and methodology in energy research. Energy Res. Soc. Sci. 2018, 39, 103–107. [CrossRef]
28. King, G. Ensuring the data-rich future of the social sciences. Science 2018, 331, 719–721. [CrossRef] [PubMed]
29. The Open PV Project. National Renewable Energy Laboratory. Available online: https://openpv.nrel.gov/
(accessed on 28 January 2018).
30. Phillips, C.; Melius, J.U.S. PV-Suitable Rooftop Resources. 2016. Available online: https://www.osti.gov/
biblio/1258436 (accessed on 28 January 2018). [CrossRef]Data 2018, 3, 61 12 of 12
31. United States Census Bureau. American Community Survey, 2010–2016 Five-Year Profiles. Generated by
Jacqueline Hettel Tidwell. Using American FactFinder. Available online: https://factfinder.census.gov/
faces/nav/jsf/pages/index.xhtml (accessed on 15 January 2018).
32. Zillow Home Value Index Data 2018. Available online: http://zillow.com/research/data (accessed on 15
January 2018).
33. DSIRE-Programs. Available online: http://programs.dsireusa.org/system/program?fromSir=0&state=GA
(accessed on 15 January 2018).
34. U.S. Electric Utility Companies and Rates: Look-Up by Zipcode (2015). Available online: https://catalog.
data.gov/dataset/u-s-electric-utility-companies-and-rates-look-up-by-zipcode-2015-8c84b (accessed on 15
January 2018).
35. Zillow Research. Zillow Home Value Index: Methodology. Available online: https://www.zillow.com/
research/zhvi-methodology-6032/ (accessed on 20 October 2018).
c 2018 by the authors. Licensee MDPI, Basel, Switzerland. This article is an open access
article distributed under the terms and conditions of the Creative Commons Attribution
(CC BY) license (http://creativecommons.org/licenses/by/4.0/).You can also read