Opportunities for Data Science in Central America, Mexico and the World: Energy and Economy Data
←
→
Page content transcription
If your browser does not render page correctly, please read the page content below
Opportunities for Data Science in Central America,
     Mexico and the World: Energy and Economy Data

      Leonel Morales Díaz1, Krista Aguilar Ovando1, Juan Ponciano Castellanos1,

                1
                    Instituto de Ciencia y Tecnología para el Desarrollo – InCyTDe
                                      Universidad Rafael Landívar
                             Vista Hermosa III, Campus Central, Zona 16,
                                 Guatemala, Centroamérica, 01016
                                  { leonel, krista, juan } @incytde.org

       Abstract. Data Science is a developing computational field in Central America
       and Mexico. The high availability of data related to energy and economy
       through several international agencies provides an excellent opportunity to plan
       and execute research projects and test tools and techniques. Also, energy is an
       important subject of research from different perspectives: economic, social,
       human development, and engineering, among others. We took the challenge of
       locating sources, collecting data, cleaning it, performing initial exploratory data
       analysis, and applying basic modeling techniques to get familiar with the data
       and understand the information and knowledge it provides in regard to the
       possible nexus between energy and economic growth. In this chapter we present
       a recount of the process and some of the insights obtained during its execution.
       From this recount we hope other researchers can find guide and inspiration to
       develop projects involving energy and economy data.

       Keywords: Data Science, Energy, Mexico, Central America.

1 Introduction

Nowadays data is being captured in multitude of environments, through sensors, logs,
user input and other forms. The format in which data is being collected differs
according to the needs of each project including plain text, numeric, binary formats,
image, video, and application specific file formats. In general, it is a good idea to
assume that there is no standard format. The extended use of computers, smart
phones, tablets, and other devices with information processing capabilities increases
the rate at which data is added to databases both in industrial and end-user settings.
These data explosion phenomenon has been resumed with three words: volume,
velocity and variety [3, 19, 27] although the discussion keeps going on about the
convenience of including other words starting with V: veracity, volatility, validity,
value, and others [13, 20, 26].
   Four skills have been identified as relevant in order to get the most out of big data:
programming, statistics, visualization and domain specific substantive expertise [12,
35]. Programming, or better, hacking skills are needed to download, parse, reformat, clean, and store data from several sources; statistics to explore and model relations in data; visualization to communicate findings visually through graphs and compositions; and domain specific substantive expertise to make sense of the whole process as it is always referred to a context which has its own rules and limits. Although data science is not exactly the same as big data, a reference to it is needed in any data science project because it can be argued that data scientists need to be able to work with big data and in the process contribute the analysis, experimental design, and systematization that characterizes scientists when producing scientific knowledge. Several authors have abounded in this relation [5, 21, 27, 35]. For this article the explanation provided in the previous paragraphs is adequate. The project in which this chapter is based concentrated in collecting data about energy and economy from several sources. Energy data and economy indicators are abundant (volume) come in different formats (variety) and are produced constantly (velocity). Programming skills together with statistical and visualization-building abilities come handy for getting and working with this data, which in turn is not possible without domain specific knowledge. In order to be able to apply data science methods in this setting we started exploring data for Central American countries and then broadened our scope to include several countries from around the world. This exercise helped us to get familiar with the data and start identifying relations that are worth modeling in order to, in future efforts, describe the energy and economy phenomenon for our countries, do some classification and even predict potential outcomes. We consider that this effort will contribute to integrate energy data for the whole Central American region, help spread information useful for decision making, and also serve as input for further studies. The following sections describe our data sources and the process to obtain the data (section 2), the exploratory data analysis up to this point along with a discussion of the insights obtained in it (section 3), and finally guidelines to continue the project and suggestions for building prospect models (section 4). 2 Energy and Economy Data Sources Following the principles of the Open Data movement [28, 29, 30, 37], many institutions that collect information around the world have made it available through their websites opening new opportunities for researchers interested in applying data science methods and tools to contribute to obtain the knowledge hidden in it [9]. This has been the case in many fields like environment and ecology [33], biology [21], health [4, 18], finance and business [36], energy [17], and economy [2]. Governments have also agreed to make the data they collect available under certain guidelines to avoid compromising public security or exposing private personal information of citizens [6, 7, 8, 14, 34, 38]. Not all data sources provide the same level of openness, or the same set of tools to work. Inconsistencies are not uncommon among different sources, presumable due to differences in methods, interpretations, conversions and integration criteria.
2.1 Selection Process

For this chapter a survey was made of the sites sharing information on energy and
economy [23] see Table 1. There are an important number of institutions that provide
that type of data, with different aims, scopes, and timeframes. Some of them are
limited to a region, a country, or other geographical circumscription; others focus on
renewable, non renewable or other subsets of primary sources. There are official
agencies and NGOs dedicated to this task that share more or less information with
different periodicity. In several cases the data is provided in a format that requires
some form of preprocess. PDF files or other proprietary formats for example, are
commonly used to publish data, but a special computational treatment is needed when
not a complete retype by a human operator.
   Based on consistency of publication and the broader scope possible, institutions
and websites were selected to work with them. In the cases of energy data and
economic indicators we found that information is published more consistently and for
longer periods when it is released yearly, although other time intervals are possible.
   Databases that include most countries were preferred to those that are limited to a
single country or region, because the intention was to broaden the scope of the study.
International agencies were found to be the most convenient.

Table 1. A non-exhaustive list of sources of energy and economy data. In addition, most
countries have local agencies for economy, energy and statistics.

 Site                               URL                                        To obtain data
 UN data                            http://data.un.org/                        API
 United Nations Development         http://hdr.undp.org/en/data                API
 Programme
 International Energy Agency        http://www.iea.org/statistics/             On screen tables
 The World Bank, World              http://databank.worldbank.org/data/dat     API
 DataBank                           abases.aspx
 Inter-American      Development    http://www.iadb.org/en/research-and-       Download       as
 Bank, Statistics and Databases     data/statistics-and-databases,3161.html    Excel file type
 The U.S. Government’s Open         http://www.data.gov/                       API
 Data
 Open      data     and    public   http://datos.gob.mx/                       CSV files
 information from the Mexican
 Government
 Open Data for International        http://aiddata.org/                        API
 Development
 Energy Statistics European         http://ec.europa.eu/energy/observatory/    Download      as
 Commission                         statistics/statistics_en.htm               PDF file type
 Organization of the Petroleum      http://www.opec.org/opec_web/en/pub        Download      as
 Exporting Countries                lications/202.htm                          PDF file type
 CEPALSTAT – CEPAL                  http://estadisticas.cepal.org/cepalstat/   API
                                    WEB_CEPALSTAT/Portada.asp

   New sources are added constantly so this list cannot be considered exhaustive. In
fact, for every data science project a first step should be to search additional sources
using standard search engines or specialized ones like Enigma [11].
2.2 Obtaining the Data Although some sites allow downloading the data in a CSV or Microsoft Excel format, it is also common to find application programming interfaces – APIs – or web services that facilitate the process through programming. It is also possible to implement a two phase method for data scrapping. In the first phase a script can be crafted to open a browser object to navigate a web page with the data of interest that is then transferred into a local file. This method is flexible and parameterizable, often allowing unattended execution which is practical for obtaining data from extensive lists of web sites overnight. For certain websites, especially those designed to show the information online rather than to allow downloading it, this method can be the best suited. In a second stage the collected data can be transferred to a database management system or specialized software for analysis and visualization. In some cases only the second phase is applicable, for example when the data is already available in a CSV file or other open format. In other cases it can be necessary to enter the information by manual typing, locating it first in the web by searching and then entering it in the appropriate field in the database. 3 Exploring Energy and Economy Data Obtaining the data of interest, although very important and work-intensive, is just a first step in a data science project. The next, or better, the concurrent step as the first never ends, is getting familiar with the data, its meaning in the specific domain of interest – energy and economy – the way it varies among countries or intervals of time, through the application of basic statistics, and showing it in graphics and charts to have a visual clue of where important phenomena may be occurring. Crafting SQL queries can be necessary to filter and extract the relevant data sets for the countries of interest that can be plotted later. Plotting compound indicators, those that result from ratios or percentages like electricity consumption divided by population, can be more convenient than quantifications like Gross Domestic Product (GDP) or Total Primary Energy Supply (TPES) for direct comparison among countries. On the other hand, the quantifiable energy and economy variables provide a contrast of size and volume so they are also worth plotting. Some of the data tables to chart can be apparent from the collected data; others may need calculation from values taken from different places. Sometimes after calculating and plotting a table the resulting image signals interesting relations or trends, for others the lack of relevant information is pointed to and the next step can be try to find and collect that information, and in several cases no interesting treat will be found, although, arguable, the very exercise yields knowledge about the data that could eventually be used in other context.
3.1 Plotting Data

It is a good idea to plot data in Excel or other spreadsheet application in this initial
stage. In this chapter some examples are presented using only one type of chart: lines
with the indicator, value or ratio in the y-axis and the year from 1990 to 2011 in the x-
axis. Although this can be considered only a very basic form of visualization, it helps
to understand the evolution of each figure over time and the differences among
countries. A brief discussion of a few of the charts analyzed for this chapter will help
to appreciate the extent this effort may have with further refinements.

Electricity Consumption / Population. This ratio shows the gross amount of
electricity consumed by the country (gross production plus imports less exports less
losses) divided by the population. Fig. 1 shows the evolution over time for this
indicator for Central American countries and Mexico. There are clearly two groups of
countries according to how much electricity their inhabitants dispose of.

                                                                 Electricity Consumption / Population
                         2.5

                          2
        MWh per capita

                         1.5

                          1

                         0.5

                          0
                               1990 1991   1992   1993    1994 1995    1996 1997 1998 1999 2000   2001   2002   2003 2004   2005 2006   2007 2008 2009 2010 2011

                                 Guatemala               El Salvador        Honduras        Nicaragua            Costa Rica        Panamá          México

  Fig. 1. Electricity Consumption / Population. Mexico, Costa Rica and Panama provide, in
                           average, more electricity to their citizens.

CO2 / Population. This ratio calculates the average CO2 emissions in tons per capita
and is shown in Fig. 2. The amount of CO2 can be linked to the sources the country
employs for producing electricity and for other energy uses. A higher amount of oil
and oil products utilization may increase this ratio.
CO2 / Population
4.5
4
3.5
Tons of CO2 per capita
3
2.5
2
1.5
1
0.5
0
1990 1991 1992 1993 1994 1995 1996 1997 1998 1999 2000 2001 2002 2003 2004 2005 2006 2007 2008 2009 2010 2011
Guatemala El Salvador Honduras Nicaragua Costa Rica Panamá México
Fig. 2. CO2 / Population. The average of tons of CO2 emitted per capita.
Residential Electricity Consumption / Population
0.8
0.7
0.6
MWh per capita
0.5
0.4
0.3
0.2
0.1
0
1990 1991 1992 1993 1994 1995 1996 1997 1998 1999 2000 2001 2002 2003 2004 2005 2006 2007 2008 2009 2010 2011
Guatemala El Salvador Honduras Nicaragua Costa Rica Panamá México
Fig. 3. Residential Electricity Consumption / Population. This chart differs from Fig. 1 in that
in this only the electricity used for homes is aggregated and averaged.
Residential Electricity / Population. Not all electricity consumed in a country is
destined to housing needs; an important portion is used in commercial, industrial,
services and others. This means that a more accurate figure for the availability of
electricity in homes would be the amount of residential electricity consumed divided
by the population. This is shown in Fig. 3.Total Primary Energy Supply (TPES) / Population. TPES measures the total
amount of energy available from primary sources before any transformation. Divided
by population provides an indicator that is comparable among countries, see Fig. 4.
This figure is indicative of how much energy the country disposes of.
Transformations induce losses and inefficiencies so this indicator, in conjunction with
others, may help identify them.
Total Primary Energy Supply (TPES) / Population
1.8
1.6
1.4
1.2
TOE per capita
1
0.8
0.6
0.4
0.2
0
1990 1991 1992 1993 1994 1995 1996 1997 1998 1999 2000 2001 2002 2003 2004 2005 2006 2007 2008 2009 2010 2011
Guatemala El Salvador Honduras Nicaragua Costa Rica Panamá México
Fig. 4. TPES / Population. In tons of oil equivalent or toe. 1 toe is approximately 11.63 MWh
or 41.87 gigajoules.
Total Primary Energy Supply (TPES) / GDP. This ratio is key for the identification
of the relation between energy and economic growth. As a country increases
economic activities more energy is required. Although other energy variables can be
used (energy imports, electricity consumption in the industrial sector, oil products
consumption, and others) any relation can be referred to that of TPES and GDP. The
indicator evolution over the years can be seen in Fig. 5.
Energy from Hydro / TPES in Balance. The Energy Balance Sheet keeps an
account of the flows of energy, including transformations and final consumption, in a
country [16, 39]. This chart shows a trend in regard of energy from hydro sources, as
shown in Fig. 6. As countries have increased the amount of energy they consume over
the years they have tended to depend heavier on sources different from hydro.Total Primary Energy Supply (TPES) / GDP
0.6
0.5
TOE/Thousands USD$
0.4
0.3
0.2
0.1
0
1990 1991 1992 1993 1994 1995 1996 1997 1998 1999 2000 2001 2002 2003 2004 2005 2006 2007 2008 2009 2010 2011
Guatemala El Salvador Honduras Nicaragua Costa Rica Panamá México
Fig. 5. TPES / GDP. This chart depicts the close relation between energy and economy. A
perfect relation would render a constant ratio. Except for the case of Nicaragua all the countries
in the region keep a nearly flat curve.
Energy from Hydro / TPES in Balance
120%
100%
80%
Percentage
60%
40%
20%
0%
1990 1991 1992 1993 1994 1995 1996 1997 1998 1999 2000 2001 2002 2003 2004 2005 2006 2007 2008 2009 2010 2011
Guatemala El Salvador Honduras Nicaragua Costa Rica Panamá México
Fig. 6. Energy from Hydro as a percentage of TPES according to figures in Energy Balance.
Countries in the region have reduced the percentage of energy they get from hydro sources, not
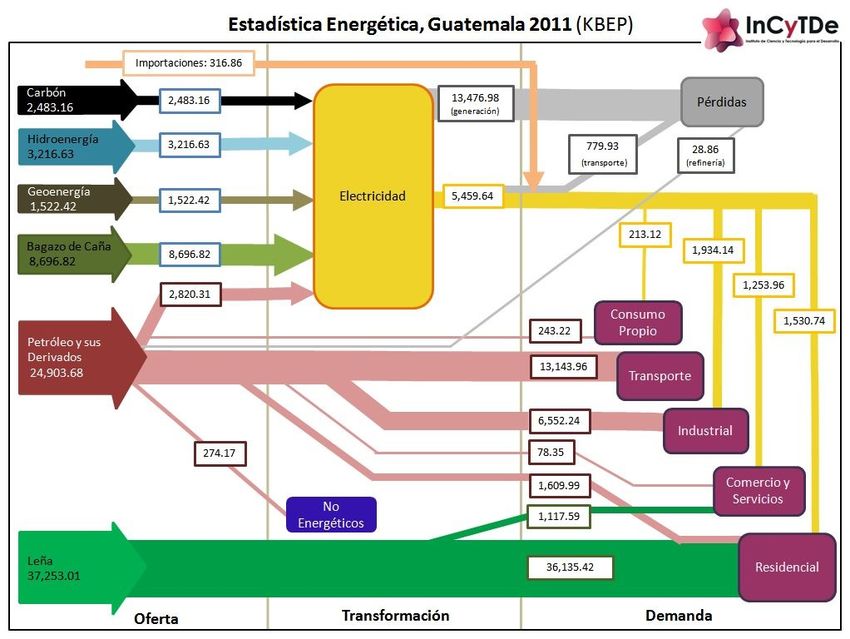
by reducing the net volume of production but by increasing other sources.3.2 Beyond Charts More advanced techniques of visualizations can be employed to analyze data. In a previous report [24] the use of Sankey diagrams or Energy Flow Diagrams was presented as a better option for comprehending the complete energy situation of a country. All the information needed to produce such diagrams is available not only for a single year or a single country, but for several years and several countries. It is a challenging task not only to craft the visualizations but to be able to compare among the different sets of data and find the trends and models needed. Nevertheless, we consider that building these visualizations is an important step towards a full understanding of the dynamics of energy and economy data. For an example of the Energy Flow Diagrams see [15, 24] and Fig. 7. Fig. 7. Energy Flow Diagram prepared in Spanish for energy data of Guatemala for 2011. 4 Proposing Models Causal relationship between energy usage and economic growth is a topic under continuous examination in every country and proves to be central for discussions of energy policymakers. The evidence for an underlying relationship is typically obtained within bivariate modeling frameworks from energy data in close relation to the main economic activities. As such, clean data about the composition of energy
production and consumption, or the generation and consumption of energy by energy
source and by economic sector constitute an essential input to those analyses.
   Two interesting examples of analysis and modeling of energy and economy data,
in line with this can be found in [1] and [31].
   The common and simplest approach is to employ bivariate models, from which it is
possible to capture the general ideas of the probable scenarios. However, many
studies have shown that this first approach might lead to unsatisfactory or conflicting
results, proving thus necessary to resort to more elaborated models [10].
   There exist several efforts to build more specific models including other variables
such as indicators in regard to capital measures and labor force [25, 32, 40].
   One promising line seems to be studying and modeling the behavior of aggregate
energy variables like electricity consumption, total primary energy supply (TPES) and
others from the economy domain like GDP, population, and inflation.
   As Fig. 5 suggest, there is a good correlation between TPES and GDP for most
countries of Central America and Mexico. It is easy to see that a clear next step is to
find how good that correlation is for the rest of countries of the world and what are
the characteristics of those with good correlation versus those with a less significant
figure. Intuition suggests that countries with similar correlations amid those variables,
or any other more relevant pair, may present similarities worth studying.
   Because energy consumption patterns vary in countries according to, among many
other reasons, their geographical position, the integration of geo-positional
information into the database seems to be relevant. It may be worth including geo-
positional data in the database for further analysis. Under this perspective it can be
argued that countries in similar latitudes should have similar energy consumption
needs and that should be reflected in the data when isolated from the influence of
other variables. This though, remains unverified.
   Global energy data is difficult to produce and collect. Most of the databases
consulted for this work have a delay of at least two years in their data, meaning that
we will be able to see the fruits of current efforts in the field of renewable sources or
changes in policies and production models until two years pass. Nevertheless as
technology advances the recollection process will most likely speed up.
   It is very important then to prepare the data science tools, including databases, data
gathering processes, analytics, models and predictions for this speed increment.

5 Conclusion

In this chapter we have provided some guidelines and ideas for applying data science
techniques and methods to energy and economy data for the countries in the Mexico
and Central American region that can be later extended to comprise the entire world.
   We started explaining why this can be considered a data science project and how
energy and economy data have the characteristics of big data. The basic sources to
obtain the data were listed with notes about the method that can be employed with
each one, although the list is non-exhaustive, it is a starting point for anyone wanting
to apply data science in a practical manner.
How to get familiar with the data through plots, chart and diagrams was then
explained and a discussion of the possible models was included. All these models and
many others, limited only by the creativity of the data scientist, can be built, tested
and applied in order to produce predictions that will be validated in the near future.
   It can be argued that the main point of this whole article is to signal the opportunity
energy and economy data presents to develop the data science computational field in
Central America and Mexico but it will not be the main advantage for sure. We will
all benefit from a better understanding of the dynamics of energy and economy in the
first place.

References

1. Apergis, N., Payne, J.: Energy Consumption growth in South America: Evidence from a
    panel error correction model, Energy Economics 3, 1421-1426 (2010)
2. Beck, T., Demirgüç-Kunt, A., Levine, R.: Financial institutions and markets across
    countries and over time: Data and analysis. World Bank. (2009)
3. Birke, R., Björkqvist, M., Chen, L. Y., Smirni, E., Engbersen, T., Xue, J.: (Big) Data in a
    Virtualized World: Volume, Velocity, and Variety in Cloud Datacenters. In Proceedings of
    the 12th USENIX Conference on File and Storage Technologies (FAST 14) (pp. 177-189).
    USENIX (2014)
4. Boulton, G., Rawlins, M., Vallance, P., Walport, M.:Science as a public enterprise: the case
    for open data. The Lancet, 377(9778), 1633-1635 (2011)
5. Bryant, R., Katz, R. H., Lazowska, E. D.: Big-Data Computing: Creating Revolutionary
    Breakthroughs         in       Commerce,        Science     and      Society.        (2008)
    http://www.cra.org/ccc/files/docs/init/Big_Data.pdf
6. DATOS.GOB.MX, http://datos.gob.mx/
7. DATA.GOV.UK, http://data.gov.uk/
8. DATA.GOV: Frequently Asked Questions, http://www.data.gov/faq
9. Davies, T., Perini, F., Alonso, J.: Researching the emerging impacts of open data. World
    Wide Web Foundation. (2013)
10. Davis, C.: Making Sense of Open Data: From Raw Data to Actionable Insight. Dissertation.
    Next Generation Infrastructures Foundation. (2012)
11. Enigma, Navigate the World of Public Data, http://enigma.io
12. Graves, S.: Meeting the challenges of data-intensive science. In Proceedings of the 2011
    workshop on Climate knowledge discovery (pp. 4-4) ACM (2011)
13. Grimes, S.: Big Data: Avoid ‘Wanna V’ Confusion. InformationWeek.com (2013)
14. Huijboom, N., Van den Broek, T.: Open data: an international comparison of strategies.
    European journal of ePractice, 12(1), pp. 1-13 (2011)
15. InCyTDe:               Balance             Energético          Guatemala              2011.
    http://incytde.org/flujo_energia/principal.html
16. International         Energy         Agency:        Energy      Balances         Statistics.
    http://www.iea.org/statistics/topics/energybalances/
17. Krioukov, A., Goebel, C., Alspaugh, S., Chen, Y., Culler, D. E., Katz, R. H.: Integrating
    Renewable Energy Using Data Analytics Systems: Challenges and Opportunities. IEEE
    Data Eng. Bull., 34(1), 3-11 (2011)
18. Krumholz, H. M.: Big Data And New Knowledge In Medicine: The Thinking, Training,
    And Tools Needed For A Learning Health System. Health Affairs, 33(7), 1163-1170 (2014)
19. Laney, D.: 3D data management: Controlling data volume, velocity and variety. Technical
    Report, META Group Research (2001)
20. Laney, D.: Deja VVVu: Others Claiming Gartner’s Construct for Big Data. In Gartner
Blog, Jan.14 (2012) Available: http://blogs.gartner.com/doug-laney/deja-vvvue-others-
claiming-gartners-volume-velocity-variety-construct-for-big-data/
21. Marx, V.: Biology: The big challenges of big data. Nature, 498(7453), 255-260 (2013)
22. McAfee, A., Brynjolfsson, E., Davenport, T. H., Patil, D. J., Barton, D.: Big Data. The
management revolution. Harvard Bus Rev, 90(10), 61-67 (2012)
23. Morales, L.: Bases de Datos en Internet. In InCyTDe Blog, Apr.1 (2014) Available:
http://incytde.org/incytde/content/bases-de-datos-en-internet
24. Morales, L. V., Aguilar, K. I., & Ponciano, J. A. Visualizing Energy Data and Seeing the
Whole Picture of Energy in Guatemala. In Proceeding of Power and Energy 2013,
ActaPress, (2013)
25. Nasreen, S., Anwar, S.: Causal relationship between trade openness, economic growth and
energy consumption: A panel data analysis of Asian countries. Energy Policy, 69, 82-91
(2014)
26. Normandeau, K.: Beyond Volume, Variety and Velocity is the Issue of Big Data Veracity.
Inside Big Data. (2013)
27. Novikov, B., Vassilieva, N., Yarygina, A.: Querying big data. In Proceedings of the 13th
International Conference on Computer Systems and Technologies (pp. 1-10). ACM (2012)
28. Open Data Commons, http://opendatacommons.org/
29. Open Definition, http://opendefinition.org/
30. Open Knowledge: What is Open? https://okfn.org/opendata/
31. Ozturk, I., Aslan A., Kalyoncu H.: Energy consumption and economic growth relationship:
Evidence from panel data for low and middle income countries, Energy Policy 38, 4422-
4428 (2010)
32. Ozturk, I.: A literature survey on energy-grow nexus, Energy Policy 38, 340-349 (2010)
33. Reichman, O. J., Jones, M. B., Schildhauer, M. P.: Challenges and opportunities of open
data in ecology. Science(Washington), 331(6018), 703-705 (2011)
34. Santana, M. T., & da Silva Craveiro, G.: Challenges and requirements for the
standardisation of open budgetary data in the Brazilian public administration. In GI-
Jahrestagung (pp. 836-848) (2013)
35. Schutt, R., O'Neil, C.: Doing Data Science: Straight Talk from the Frontline. O'Reilly
Media, Inc. (2013)
36. Streeter, L. A., Kraut, R. E., Lucas Jr, H. C., Caby, L.: How open data networks influence
business performance and market structure. Communications of the ACM, 39(7), 62-73
(1996)
37. The Open Data Foundation, http://www.opendatafoundation.org/
38. U. S. Office of Management and Budget (OMB): Open Data Policy – Managing
Information as an Asset, M-13-13,
http://www.whitehouse.gov/sites/default/files/omb/memoranda/2013/m-13-13.pdf (2013)
39. Vargas, A.: National Energy Balances. In Natural Resources Forum (Vol. 6, No. 1, pp. 29-
42). Blackwell Publishing Ltd. (1982)
40. Yıldırım, E., Sukruoglu, D., Aslan, A.: Energy consumption and economic growth in the
next 11 countries: The bootstrapped autoregressive metric causality approach. Energy
Economics, 44, 14-21 (2014)You can also read