Burst-mode Yb-doped fiber amplifier system optimized for low-repetition-rate operation
←
→
Page content transcription
If your browser does not render page correctly, please read the page content below
900    Vol. 32, No. 5 / May 2015 / Journal of the Optical Society of America B                                      Research Article

Burst-mode Yb-doped fiber amplifier system
optimized for low-repetition-rate operation
H. KALAYCIOĞLU,1,* Ö. AKÇAALAN,1 S. YAVAŞ,2,3 Y. B. ELDENIZ,4,5                               AND   F. Ö. ILDAY1,6
1
  Department of Physics, Bilkent University, Ankara 06800, Turkey
2
  UNAM–Institute of Materials Science and Nanotechnology, Bilkent University, Ankara 06800, Turkey
3
  FiberLAST, Inc., Ankara 06531, Turkey
4
  Department of Electronics Engineering, Ankara University, Ankara 06100, Turkey
5
  Roketsan, Inc., Ankara 06780, Turkey
6
  Department of Electrical and Electronics Engineering, Bilkent University, Ankara 06800, Turkey
*Corresponding author: hamitkal@bilkent.edu.tr

Received 28 January 2015; revised 8 March 2015; accepted 8 March 2015; posted 12 March 2015 (Doc. ID 233356); published 27 April 2015

       We report on the burst-mode operation of a polarization-maintaining Yb-doped multi-stage all-fiber amplifier
       capable of generating 10-pulse 100 ns long bursts of 400 μJ total energy. The corresponding average energy
       per pulse is 40 μJ, with a standard deviation of 16%. The 40 μJ pulses are compressible to a full width at
       half-maximum of 500 fs. The burst repetition rate is set to 1 kHz and the amplifier is synchronously pulse pumped
       to minimize amplified spontaneous emission (ASE) between the bursts. A special amplifier design has been devel-
       oped to suppress ASE further at the cost of lower power efficiency. A detailed investigation of gain and ASE sup-
       pression performance of the amplifier in relation to pulsed pumping is presented. © 2015 Optical Society of America
       OCIS codes: (140.3280) Laser amplifiers; (060.3510) Lasers, fiber; (060.2320) Fiber optics amplifiers and oscillators; (140.3615)
       Lasers, ytterbium.

       http://dx.doi.org/10.1364/JOSAB.32.000900

1. INTRODUCTION                                                                  state lasers, with architectures that were not optimized for burst
There is much interest in fiber amplification of ultrashort                      operation. In 2011, we demonstrated the first fiber laser de-
pulses, which offers practical advantages such as low-cost,                      signed to operate in the burst mode [15] and advanced it fur-
highly robust operation and high-gain amplification [1–4].                       ther with highly uniform intra-burst pulse energy distribution,
These aspects are particularly important for material [5] and                    enabled by advanced electronic synchronization and electronic
tissue [6] processing, in industrial, medical, and scientific set-               signal burst preshaping [16]. This was followed by the demon-
tings, outside the laser research laboratory. Despite tremendous                 stration of a rod-type fiber amplifier by Breitkopf et al. [17].
technical improvements, particularly in terms of pulse energy                    We have recently scaled the repetition rate to 1 MHz
and average power, the essentials of laser material processing                   and average power to 100 W for material processing applica-
have changed little: The overwhelming majority of the fibers,                    tions [18].
as well as solid state lasers, rely on a train of identical pulses with              A burst of closely spaced pulses can have an effect similar to
constant temporal spacing, which is not necessarily ideal.                       that of a single pulse of energy equal to that of the entire burst
    Lapczyna et al. have demonstrated a powerful alternative,                    during its interaction with a given material [19]. In [20],
where the laser amplifier produces a group of a limited number                   Knappe et al. report a sixfold increase in material ablation rates
of high-repetition rate pulses, called a burst, which itself is re-              with six lower energy pulses separated by 20 ns, compared to a
peated at a much lower repetition rate [7]. For a long time,                     single pulse with energy equal to the sum of the burst.
burst-mode operation has been confined to diverse, but niche                     Particularly exciting opportunities abound in medical applica-
applications, including laser systems in accelerators [8,9], com-                tions, where the possibility to utilize lower pulse energies to
bustion diagnostics [10], flow measurements in aerodynamics                      achieve a certain effect has major benefits in terms of lower heat
[11], Thomson scattering experiments [12], pulsed laser dep-                     deposition, reduced collateral damage, and eventually decreased
osition [13], and photoacoustic microscopy [14]. This was pre-                   possibility of medical complications. Marjoribanks and co-
sumably because of the lack of suitable laser sources that can                   workers have recently reported the first results on burst-mode
operate in this mode, which is slowly changing in recent years.                  tissue processing [21,22], which clearly demonstrate that the
Until recently, burst-mode laser systems have relied on solid                    temporal properties of the burst envelope constitute effective

0740-3224/15/050900-07$15/0$15.00 © 2015 Optical Society of America
Research Article Vol. 32, No. 5 / May 2015 / Journal of the Optical Society of America B 901
additional degrees of freedom, which can be used to optimize
material ablation while keeping thermal effects minimized.
This can be understood by recalling that thermal effects depend
predominantly on the average power or average fluence, while
material ablation depends on the peak intensity. Thus, strength
of the thermal effects can be controlled through controlling the
burst repetition rate, while ablation efficiency can be kept high
through the use of high repetition rate and high energy pulses
inside the burst.
Given the great potential of burst-mode operation in future
medical applications and material processing, which has already
been implemented by various industrial systems, it is essential
to understand the limitations on essential burst-mode param-
eters imposed by the laser physics. In particular, amplified
spontaneous emission (ASE) generation is a major concern be-
cause of the burst repetition rate being typically in the kHz
regime or even lower. Furthermore, because of the typically
short durations of the burst, pumping cannot repopulate the
upper state of the gain medium appreciably during the ampli-
fication of the pulse burst. Thus, the gain experienced by the
pulse burst is almost entirely because of the pump absorbed
prior to the arrival of the burst. Because of ASE, there is a limit
to how early pumping can commence with respect to the arrival
of the burst, which consequently limits, in practice, the amount
of energy that can be stored. This limit depends also on the
length of the gain medium. As a result, multiple trade-offs exist
between keeping ASE low and burst energy high against
keeping the gain medium sufficiently long for efficient pump
absorption. Yet another concern is the desire to minimize the
length of the gain fiber to minimize nonlinear effects.
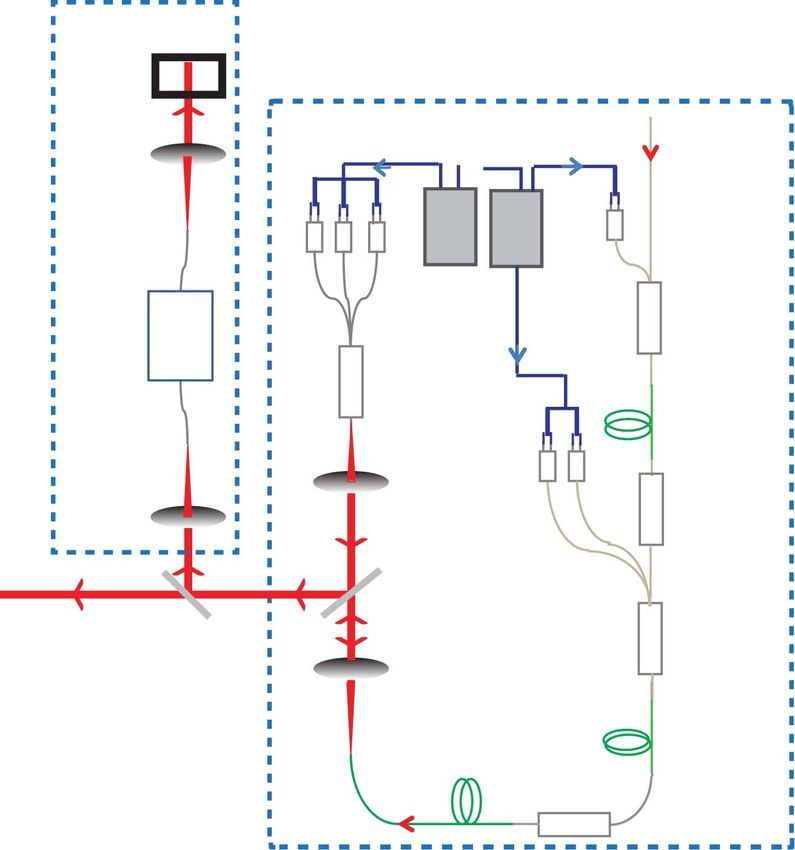
In this contribution, we report the demonstration and Fig. 1. Schematic diagram of the experimental setup. BS, beam
detailed characterization of an all-fiber burst-mode Yb fiber am- sampler; DM, dichroic mirror; WDM, wavelength division multi-
plifier with multi-stage (nine stages) amplification aiming to plexer; PM, polarization maintaining; SM, single-mode; DC,
suppress ASE at a low repetition rate while employing a chirped double-clad.
fiber Bragg grating (CFBG) for a pulse stretcher with a stretch-
ing ratio of ∼1000. The CFBG is designed to match an
1800 line∕mm transmission grating. This system is able to am-
master oscillator power amplifier architecture is based on the
plify 10-pulse bursts of 100 ns duration each to 400 μJ total
design in [24]. The first three stages of preamplifiers utilize con-
energy. The individual pulses of 40 μJ average energy are com-
tinuous pumping while the latter three, which are positioned
pressed to 500 fs with a 1800 line∕mm grating compressor.
after the acousto-optic modulator (AOM), incorporate pulsed
The burst repetition rate is 1 kHz and the intra-burst pulse
repetition rate is 100 MHz as determined by the seed oscillator. pumping. The 100 MHz fiber oscillator outputs ∼130 mW
The amplifier system has a highly cascaded fiber integrated with a spectrum 16 nm wide and centered at 1035 nm which
architecture designed to achieve high energy bursts made of is polarized by a polarization dependent isolator. From this
high energy pulses at low burst repetition rates while sup- point on, the system consists only of polarization maintaining
pressing ASE. Hence, ASE is carefully monitored at various (PM) components. The seed pulses are stretched to 2.3 ns in a
stages and the output and pulsed pumping parameters are CFBG, which replaced the stretch fiber which was increased to
optimized to achieve the highest signal to ASE ratio. The gain 2.6 km from 450 m to mitigate undesired nonlinear effects that
performance and energy extraction limitations of the system are occurred when the system was revised to its current multi-stage
investigated for short duration bursts (902 Vol. 32, No. 5 / May 2015 / Journal of the Optical Society of America B Research Article
increasing signal at each stage such that the level of amplifica- of an FPGA. The FPGA, in turn, triggers three arbitrary wave-
tion is close to an optimum value. The AOM, which imprints form generators (AWG), one of which drives the AOM and the
the desired pulse burst envelope onto the signal, has a 2.3 dB other two providing pulses to diode drivers, which are capable
insertion loss, 50 dB extinction, and rise and fall times of 6 and of pulsed operation. The signal to the AOM is delayed with
8 ns. At the output of the AOM, the signal power decreases to a respect to the diode drivers by an adjustable amount. We
mere 0.04 mW for 10-pulse bursts repeated at 1 kHz, corre- set the value of this delay, such that the signal burst arrives pre-
sponding to 40 nJ of burst energy and an average energy of 4 nJ cisely at the very end of the much longer pump pulse. The
per pulse. Next, the bursts are amplified in six stages of pulsed AWGs, in combination with the FPGA, allow us to adjust
amplification, for which the pump pulses need to be tightly the durations of the pump pulses to maximize burst energy
synchronized with the seed signal to keep noise low. while suppressing ASE as much as possible. In addition, burst
Comparatively short gain fibers are used in the three-stage duration and the burst repetition frequency can be adjusted
pulsed preamplifier following the AOM to suppress ASE gen- freely, although we are reporting here only results with 10
eration. The power amplifier at the end of the system also con- pulses within each burst.
sists of three stages, the first two forward pumped and the final
one backward pumped, which employ one, two, and three
25 W pump diodes, respectively. The three stages contain 3. RESULTS AND DISCUSSION
Yb-1200-DC-20/125PM (nLight, Inc.) as gain fiber with After optimization of all the signal durations and frequencies,
lengths of 1.3, 0.8, and 0.8 m in respective order, each shorter the system was able to amplify 100 ns long 10-pulse bursts to a
than that required for high efficiency in continuous pumping net energy of 400 μJ at a burst repetition rate of 1 kHz indicat-
regime. The details pertaining to the double-clad (DC) gain ing an average per pulse energy of 40 μJ. The temporal profile
fiber, including the typical spatial mode quality can be found of the pulse train for 400 μJ bursts is shown in Fig. 2(a). The
in our earlier work [25]. corresponding RF spectra recorded over a span of 50 MHz,
The pulse picking and the pulsed pumping processes are centered at 100 MHz, show the RF comb generated by the
both synchronized using a signal derived from the 100 MHz burst system [lower panel of Fig. 2(b)]. Here, the 3 dB width
oscillator and managed by a field programmable gated array of the main lobe is 10 MHz, which is consistent with the du-
(FPGA) circuit. The FPGA circuit is triggered by the RF signal ration of the burst envelope (100 ns, in this case). Thus, the
derived from the optical pulse train produced by the oscillator frequency domain representation of a train of pulse bursts con-
signal. This low jitter signal [26] is low-pass filtered to retain stitutes a comb with 1 kHz internal spacing, corresponding to
only the fundamental frequency of 100 MHz, which is used as the burst repetition frequency, under an envelope determined
the internal clock signal of the FPGA, ensuring the tightest by the temporal shape of the burst envelope. Note that the
possible synchronization allowed with the hardware limitations comb lines are actually much denser than those displayed in
RF Power (dB)
1 0
Intensity (a.u.)
(a) (b) 1 (c) 1
Intensity (a.u.)
Intensity (a.u.)
50
2 1 0 1 2
Frequency Offset (kHz) 0
0
RF Power (dB)
1010 1030 1050
~10 MHz at -3 dB Wavelength (nm)
20
0 0
0 50 100 150 85 90 95 100 105 110 115 10 0 10
Time (ns) Frequency (MHz) Time (ps)
1 1
Intensity (a.u.)
1 (d) 1 (e) (f)
Intensity (a.u.)
Intensity (a.u.)
Intensity (a.u.)
0
1010 1030 1050
Wavelength (nm)
0 0 0
1000 1040 1080 40 20 0 20 40 10 0 10
Wavelength (nm) Delay (ps) Time (ps)
Fig. 2. (a) Measured temporal profile of the 100 ns pulse burst, which repeated at 1 kHz. (b) Measured RF spectrum of the pulse train in burst
mode. Lower panel shows a frequency span of 20 MHz centered at 100 MHz. Top panel: Close-up showing the 1 kHz lines with a span of 5 kHz
versus frequency offset from the central frequency of 100 MHz. (c) Pulse shape obtained for 40 μJ pulse energy, using pulse propagation simulations.
Inset: Simulated output spectrum. (d) Measured optical spectrum for 40 μJ pulse energy. Inset: Spectrum at the output of CFBG, which seeds the
amplifier chain. (e) Measured (solid curve) and retrieved (dashed curve) autocorrelation traces of the dechirped pulses at the 40 μJ energy level.
(f) Retrieved temporal profile of the pulse using the PICASO algorithm based on the measured autocorrelation and spectrum.Research Article Vol. 32, No. 5 / May 2015 / Journal of the Optical Society of America B 903
the figure, which is because of the finite number of sample trum. This structure is mostly coming from a small amount of
points that the spectrum analyzer (FSUP26, Rohde & power being coupled to the orthogonal polarization mode or a
Schwarz) can record. A close-up of the same signal with a span higher spatial mode at different points along the nine stages of
of 100 kHz and resolution bandwidth of 10 Hz correctly re- amplification. When small amounts of power (much less than
veals this fine comb structure with 1 kHz spacing between the %1) are coupled into another mode, which would have a
lines [top panel of Fig. 2(b)]. slightly different group velocity, the main pulse and the small
Control of nonlinearity is a major challenge in a high-energy, replica of the pulse co-propagate while maintaining almost
multi-stage integrated fiber amplifier system where pulse propa- complete temporal overlap since the pulses are chirped to
gation simulations [25,27] guided us in determining the extent 2.3 ns. Numerical simulations indicate that, during amplifica-
of required pulse stretching and attainable pulse energies. Our tion of highly chirped pulses in the presence of strong
main criterion was to suppress nonlinearity so that self-phase SPM, energy can be transferred from the main pulse to the sec-
modulation (SPM) and Raman scattering are reduced to accept- ondary pulses, which, in turn, can create a complex temporal
able levels, such that pulse compression below picosecond level is structure as in Fig. 2(f). This interesting, but limiting, phe-
possible. This task is intricately coupled to optimization of gain nomenon will be investigated further in the future and
levels and minimization of ASE, as explained below. One tech- reported elsewhere.
nical limitation was the size of gratings commercially available The main limitation to burst energy arises from ASE gen-
for pulse compression. In practice, the 20 cm width of the eration in an effectively low repetition system like ours. Since
1800 line∕mm transmission gratings that we could obtain sets ASE generation can easily be overlooked, it was investigated
the upper limit for pulse stretching, given a certain spectral diligently together with gain performance in the stages which
width. For the spectra reported here, the gratings allowed employed pulsed pumping. At first, the output of the three-
stretching up to 2.3 ns near Litrow configuration with a sepa- stage pulsed preamplifier was studied to obtain maximum burst
ration of about 70 cm. At this setting, the third-order dispersion energy while suppressing the ASE level. Varying the duration of
(TOD) of ∼1.4 ps3 imposed by the gratings, if not compensated the pump pulse applied at each stage while keeping the peak
for, renders pulse compression below 10 ps impossible. A CFBG pump power at or close to the maximum level of ∼540 mW,
was utilized as it does not detract from the fiber integrated struc- pumping the first two stages with a lower energy level, and in-
ture of the system and allows compensation of the TOD from creasing it for the third stage resulted in the best combination of
the grating compressor. Simulation results demonstrated that, high burst energy and low ASE content. Thereby, a net (free of
with a CFBG that matched the grating compressor with the op- ASE) signal power of 16 mW (burst energy of 16 μJ) with an
posite sign for TOD, a duration around 250 fs for compression ASE content of 3% was obtained. All together, the three-stage,
of 40 μJ pulses was obtainable [Fig. 2(c) for temporal profile and core-pumped preamplifier could amplify 100 ns bursts repeated
inset of Fig. 2(c) for the spectral profile]. Hence, a CFBG was at 1 kHz with a net signal gain of 25 dB and a pump-to-signal
integrated to the system at the output of the oscillator stretching conversion of 16%, while limiting the ASE to signal ratio to less
pulses with a 21 nm wide spectrum up to 2.3 ns. than 5%. The results indicate a threshold pump energy of 95 μJ
Guided by the simulation results, the multiple stages of am- for ASE generation. When compared with the performance of
plification were optimized to minimize ASE, while achieving a the single pulsed preamplifier (threshold of 16 μJ, conversion of
balance between burst energy and pulse compressibility, as lim- 2.5%) in the previous version of the system [15], a sixfold in-
ited by SPM. The ASE optimization is described in detail be- crease, both in threshold pump energy for ASE onset and
low. The measured optical spectrum is shown in Fig. 2(d), pump-to-signal conversion efficiency for similar ASE level
where the inset shows the seed spectrum. The nonlinear phase has been achieved via three-stage preamplification.
shift was estimated around 4π for the power amplifier section Having explored the optimum parameters for the pulsed
when amplified pulse energy reaches 40 μJ at output. The tem- preamplifier, we next investigated the power amplifier. The
poral profiles of the amplified pulses with energy of 40 μJ were power amplifier consists of three stages, where the first and sec-
characterized after compression with a long-range autocorrela- ond stages are forward pumped by one and two 25 W diodes,
tor [Fig. 2(e)], while the system was operated at uniform rep- respectively, while the final stage is backward pumped by three
etition rate. Finally, we used the PICASO algorithm [28] to 25 W diodes. The performance at the output of each stage was
retrieve an estimate of the pulse form [Fig. 2(f)]. It should analyzed. For the first two stages, identical drive signal is used
be mentioned that, for a complex pulse shape as this, the which generates a pump pulse for the second stage that is tem-
PICASO algorithm cannot be expected to give a completely porally equal, but with twice the amplitude of that of the first
reliable temporal profile. However, it is successful in matching stage. Thus, twice as much peak pump power and pump energy
the measured autocorrelation result with high precision as evi- are applied to the second stage. In respect of this fact, the results
denced by the red dashed curve in Fig. 2(f). Thus, it should be for the first stage will be discussed together with the second one
interpreted as a good indicator of the size of the pedestal and which represents the cumulative amplification of the two
the effective pulse width. The retrieved pulse width (full width stages. This will be followed by the analysis of the final back-
at half-maximum, FWHM) was 500 fs. This is longer than the ward pumped stage driven with a pump pulse independent of
simulation results by a factor of two. Part of this discrepancy the first two stages, where the input signal is taken as the output
because of the experimental spectrum being 10%–15% nar- of the second stage.
rower than the simulated one. However, we attribute the main To study the performance at the output of the first and sec-
source of deviation to the highly structured experimental spec- ond stages of the power amplifier, the input burst energy to the904 Vol. 32, No. 5 / May 2015 / Journal of the Optical Society of America B Research Article
power amplifier was set to 10 μJ with ASE level near zero. The linearly, with a slope of 45% and 30%, for the two-stage and
burst energy was reduced down from 16 μJ at the output of the single-stage amplification, respectively, indicating operation in
pulsed preamplifier because of losses introduced by two high the unsaturated regime.
power PM isolators and the monitoring port located between Next, pulsed pumping performance was measured at the
the isolators. The near zero ASE content resulted from effective output of the final backward pumped stage with prior pulsed
filtering of the isolators. This was critical since even a very small amplification stages set to produce an input with a near zero
ASE content at input degrades the net signal amplification sig- ASE level. Figure 3(c) shows the amplification results for a
nificantly by stealing the gain. The pump diodes were driven net input burst energy of 50 μJ. The pump to signal conversion
with pulses of 40, 50, 60, and 70 μs durations and 60%, 75%, efficiency and amplified burst energy follow a similar trend with
and 100% of full power level. The net burst energy, total out- the preceding stages but both at a higher level. The conversion
put, and ASE energy versus the pump energy are shown in increases from 14% to 22% and degrades afterward [Fig. 3(e)]
Figs. 3(a) and 3(b), for the output of the first and second stages, while the burst energy converges a little above 400 μJ. ASE is
respectively. The results demonstrate a similar trend of con- generated above a threshold pump energy level near 1 mJ sim-
verging amplified burst energy (230 μJ for the first and ilar to the two-stage amplification case [Figs. 3(c) and 3(d)].
290 μJ for the second one) and threshold behavior for ASE Overall, the results for the power amplifier indicate that there
onset with increasing pump energy. The limit for net amplified is a pump energy level for which the pump-to-signal conversion
burst energy shifts to a higher level for the two-stage amplifi- reaches a maximum and afterward starts decaying as any further
cation. Correspondingly, the same burst energy is obtained increase in stored energy is converted to ASE. Further, mea-
with a significantly less ASE level (220 μJ with 17% compared surements were also taken with signal input containing ASE
to 32% of first stage), and the threshold pump energy for ASE and even just a few percent ASE caused a significant drop
generation doubles from ∼0.5 mJ for the first stage to ∼1 mJ in the pump to signal conversion efficiency while the ASE
for the second one, demonstrating the ASE suppression effect growth was enhanced. For example, at pump energy of
of cascaded amplification. Figure 3(d) shows the fractional ASE 1.5 mJ in the final stage, an input signal burst of 66 μJ and
content in the output of each stage which grows nearly linearly 3% ASE is amplified to a net energy of 380 μJ with 38%
above the threshold indicating an exponential growth. The ASE content and 21% pump-to-signal conversion, while
pump-to-signal conversion ratio [Fig. 3(e)], a critical parameter 190 μJ and 11% ASE is amplified to 320 μJ with an ASE
for a system based on energy storage, increases from below 10% of 56% and conversion of only 11%.
with pump energy up to a maximum of 15% whereafter it de- To shed light on the temporal dynamics of ASE buildup,
grades because of ASE taking over at output of both stage 1 and ASE generation was temporally characterized at the output
2. However, the total output [Figs. 3(a) and 3(b)] grows fairly of the system [Fig. 3(f)], for the case of a pump pulse of
Total energy 600 Total energy Total energy
300 (a) Net energy (b) Net energy (c) Net energy
ASE ASE 600 ASE
400
Energy ( J)
Energy ( J)
Energy ( J)
200
400
100 200 200
0 0 0
0.4 0.6 0.8 1 1.2 1.4 1.6 1.2 1.5 1.8 2.1 1 1.5 2 2.5
Pump Pulse Energy (mJ) Pump Pulse Energy (mJ) Pump Pulse Energy (mJ)
Pump to Signal Conversion Ratio
(d) (e) 1 (f)
0.2
Pump pulse
0.4 ASE power
Intensity (a.u.)
ASE Ratio
Exponential fit
0.1
0.2
Stage 1 Stage 1
Stage 1 & 2 Stage 1 & 2
Final stage Final Stage
0 0 0
0.5 1 1.5 2 2.5 0.5 1 1.5 2 2.5 950 960 970 980 990 1000
Pump Pulse Energy (mJ) Pump Pulse Energy (mJ) Time (µs)
Fig. 3. Measured net amplified signal (triangles facing up), ASE (triangles facing down) and total (circles) output energy at output of the (a) first
stage of power amplifier, (b) second stage of power amplifier, and (c) final stage of power amplifier, as a function of the pump pulse energy. (d) ASE
fraction in output for each stage. (e) Pump-to-signal conversion efficiency at the output of each stage. Note that in (d) and (e), the data for the second
stage output is designated by “Stage 1 and 2” to indicate the cumulative amplification. (f) Temporal characterization of ASE generation in the case of
1.7 mJ pump pulse with 40 μs duration, amplified net burst energy of 400 μJ and 20% ASE ratio in the output. ASE generation (triangles facing
down) versus time and exponential fit (dashed line) to it with the formula of It 0.017 × e t−989∕2.43 . Pump and signal pulses are also shown
(solid line). The arrival of the signal burst at 1 ms mark can also be seen.Research Article Vol. 32, No. 5 / May 2015 / Journal of the Optical Society of America B 905
1.7 mJ and 40 μs duration, amplified net burst energy of amplification results at the output of the second and final
400 μJ, and 20% ASE ratio in the output. The temporal stages, an increase in the 200–300 μJ range can be expected
growth profile is fit well by an exponential, until the ASE in the output burst energy that is as long as nonlinear effects
growth also starts to saturate because of pump depletion. allow. However, the large-mode DC fibers used in the power
The time constant is 2.4 μs over a period of ∼10 μs before amplifier may require a free-space AOM for ASE elimination,
the signal burst arrives and terminates once the signal burst ar- which will impair the all-fiber architecture of the system, as well
rives at the 1 ms mark. Since the launched signal has no ASE as increase complexity. Finally, more than 30-fold improve-
content, the ASE growth initiating ∼30 μs after the onset of ment in the ASE threshold obtained with Yb 1200 20/125
the pump pulse indicates a threshold of ∼1 mJ stored pump DC fiber in the single stage forward pumped amplification,
energy for the parameters considered here in agreement with compared to the single-mode single stage preamplifier, points
Figs. 3(c) and 3(d). to the energy storage capacity of the fiber. The increase in the
The exponential growth of ASE setting off above a threshold threshold is in the same order with the ratio (∼40) of total ac-
pump energy limits the pump-to-signal conversion. The critical tive ion population of the DC Yb fiber used to that of the single
question is whether there is a way to increase this limit and mode one. Note that it is the energy storage capacity which is a
extract significantly higher levels of burst energy from fiber am- function of total active ion population that seemingly raises the
plifiers for short duration (906 Vol. 32, No. 5 / May 2015 / Journal of the Optical Society of America B Research Article
REFERENCES 16. H. Kalaycıoğlu, Y. B. Eldeniz, Ö. Akcaalan, S. Yavas, K. Gurel, M. Efe,
and F. Ö. Ilday, “1-mJ pulse bursts from a Yb-doped fiber amplifier,”
1. D. J. Richardson, J. Nilsson, and W. A. Clarkson, “High power fiber Opt. Lett. 37, 2586–2588 (2012).
lasers: current status and future perspectives [Invited],” J. Opt. Soc. 17. S. Breitkopf, A. Klenke, T. Gottschall, H. J. Otto, C. Jauregui, J.
Am. B 27, B63–B92 (2010). Limpert, and A. Tunnermann, “58 mJ burst comprising ultrashort
2. J. Nilsson and D. N. Payne, “High-power fiber lasers,” Science 332, pulses with homogenous energy level from an Yb-doped fiber ampli-
921–922 (2011). fier,” Opt. Lett. 37, 5169–5171 (2012).
3. M. E. Fermann and I. Hartl, “Ultrafast fibre lasers,” Nat. Photonics 7, 18. P. Elahi, S. Yilmaz, Y. B. Eldeniz, and F. Ö. Ilday, “Generation of pico-
868–874 (2013). second pulses directly from a 100 W, burst-mode, doping-managed
4. C. Jauregui, J. Limpert, and A. Tünnermann, “High-power fibre Yb-doped fiber amplifier,” Opt. Lett. 39, 236–239 (2014).
lasers,” Nat. Photonics 7, 861–867 (2013). 19. W. Hu, Y. C. Shin, and G. King, “Modeling of multi-burst mode pico-
5. K. Sugioka and Y. Cheng, Ultrafast Laser Processing: from Micro- to second laser ablation for improved material removal rate,” Appl.
Nanoscale (CRC Press, 2013). Phys. A 98, 407–415 (2010).
6. S. H. Chung and E. Mazur, “Surgical applications of femtosecond 20. R. Knappe, H. Haloui, A. Seifert, A. Weis, and A. Nebel, “Scaling abla-
lasers,” J. Biophotonics 2, 557–572 (2009). tion rates for picosecond lasers using burst micromachining,” Proc.
7. M. Lapczyna, K. P. Chen, P. R. Herman, H. W. Tan, and R. S. SPIE 7585, 7850H (2010).
Marjoribanks, “Ultra high repetition rate (133 MHz) laser ablation of 21. R. S. Marjoribanks, C. Dille, J. E. Schoenly, L. McKinney, A.
aluminum with 1.2-ps pulses,” Appl. Phys. A 69, S883 (1999). Mordovanakis, P. Kaifosh, P. Forrester, Z. Qian, A. Covarrubias, Y.
8. H. Braun, R. Corsini, J. Delahaye, A. de Roeck, S. Döebert, A. Ferrari, Feng, and L. Lilge, “Ablation and thermal effects in treatment of hard
G. Geschonke, A. Grudiev, C. Hauviller, B. Jeanneret, E. Jensen, T. and soft materials and biotissues using ultrafast-laser pulse-train
Lefevre, Y. Papaphilippou, G. Riddone, L. Rinolfi, W. D. Schlatter, H. bursts,” Photon. Lasers Med. 1, 155–169 (2012).
Schmickler, D. Schulte, I. Syratchev, M. Taborelli, F. Tecker, R. Toms, 22. Z. Qian, A. Mordovanakis, J. E. Schoenly, A. Covarrubias, Y. Feng, L.
S. Weisz, and W. Wuensch, “CLIC 2008 Parameters,” CERN-OPEN- Lilge, and R. S. Marjoribanks, “Pulsetrain-burst mode, ultrafast-laser
2008-021 (2008). interactions with 3D viable cell cultures as a model for soft biological
9. I. Will, H. I. Templin, S. Schreiber, and W. Sandner, “Photoinjector tissues,” Biomed. Opt. Express 5, 208–222 (2014).
drive laser of the FLASH FEL,” Opt. Express 19, 23770–23781 (2011). 23. A. Chong, J. Buckley, W. Renninger, and F. W. Wise, “All-normal-
10. P. Wu, W. R. Lempert, and R. B. Miles, “Megahertz pulse-burst laser dispersion femtosecond fiber laser,” Opt. Express 14, 10095–
system and visualization of shock-wave/boundary-layer interaction,” 10100 (2006).
AIAA J. 38, 672–679 (2000). 24. F. Ö. Ilday, H. Lim, J. Buckley, and F. W. Wise, “Practical, all-fiber
11. B. S. Thurow, A. Satija, and K. Lynch, “Third-generation megahertz- source of high-power, 120-fs pulses at 1 micron,” Opt. Lett. 28,
rate pulse burst laser system,” Appl. Opt. 48, 2086–2093 (2009). 1362–1364 (2003).
12. D. J. Den Hartog, J. R. Ambuel, M. T. Borchardt, A. F. Falkowski, 25. P. K. Mukhopadhyay, K. Özgören, I. L. Budunoglu, and F. Ö. Ilday,
W. S. Harris, D. J. Holly, E. Parke, J. A. Reusch, P. E. Robl, H. D. “All-fiber low-noise high-power femtosecond Yb-fiber amplifier sys-
Stephens, and Y. M. Yang, “Pulse-burst laser systems for fast tem seeded by an all-normal dispersion fiber oscillator,” IEEE J. Sel.
Thomson scattering (invited),” Rev. Sci. Instrum. 81, 10D513 (2010). Top. Quantum Electron. 15, 145–152 (2009).
13. M. Murakami, B. Liu, Z. Hu, Z. Liu, Y. Uehara, and Y. Che, “Burst- 26. A. Winter, F. Ö. Ilday, O. D. Mücke, R. Ell, H. Schlarb, P. Schmüser,
mode femtosecond pulsed laser deposition for control of thin film and F. X. Kärtner, “Towards high-performance optical master oscil-
morphology and material ablation,” Appl. Phys. Express 2, 042501 lators for energy recovery linacs,” Nucl. Instrum. Methods A 557,
(2009). 299–304 (2006).
14. T. Liu, J. Wang, G. I. Petrov, V. V. Yakovlev, and H. F. Zhang, 27. B. Oktem, C. Ülgüdür, and F. Ö. Ilday, “Soliton-similariton fibre laser,”
“Photoacoustic generation by multiple picosecond pulse excitation,” Nat. Photonics 4, 307–311 (2010).
Med. Phys. 37, 1518–1521 (2010). 28. J. W. Nicholson, J. Jasapara, W. Rudolph, F. G. Omenetto, and A. J.
15. H. Kalaycioglu, K. Eken, and F. Ö. Ilday, “Fiber amplification of pulse Taylor, “Full-field characterization of femtosecond pulses by
bursts up to 20 μJ pulse energy at 1 kHz repetition rate,” Opt. Lett. spectrum and cross-correlation measurements,” Opt. Lett. 24,
36, 3383–3385 (2011). 1774–1776 (1999).You can also read