Homogeneous Data Normalization and Deep Learning: A Case Study in Human Activity Classification - MDPI
←
→
Page content transcription
If your browser does not render page correctly, please read the page content below
future internet

Article
Homogeneous Data Normalization and Deep
Learning: A Case Study in Human
Activity Classification
Ivan Miguel Pires 1,2,3, * , Faisal Hussain 4 , Nuno M. Garcia 1 , Petre Lameski 5                 and
Eftim Zdravevski 5
 1    Instituto de Telecomunicações, Universidade da Beira Interior, 6200-001 Covilhã, Portugal; ngarcia@di.ubi.pt
 2    Computer Science Department, Polytechnic Institute of Viseu, 3504-510 Viseu, Portugal
 3    UICISA:E Research Centre, School of Health, Polytechnic Institute of Viseu, 3504-510 Viseu, Portugal
 4    Department of Computer Engineering, University of Engineering and Technology (UET), Taxila 47080,
      Pakistan; faisal.hussain.engr@gmail.com
 5    Faculty of Computer Science and Engineering, University Ss Cyril and Methodius, 1000 Skopje,
      North Macedonia; petre.lameski@finki.ukim.mk (P.L.); eftim.zdravevski@finki.ukim.mk (E.Z.)
 *    Correspondence: impires@it.ubi.pt; Tel.: +351-966-379-785

 Received: 12 October 2020; Accepted: 9 November 2020; Published: 10 November 2020

 Abstract: One class of applications for human activity recognition methods is found in mobile
 devices for monitoring older adults and people with special needs. Recently, many studies were
 performed to create intelligent methods for the recognition of human activities. However, the different
 mobile devices in the market acquire the data from sensors at different frequencies. This paper
 focuses on implementing four data normalization techniques, i.e., MaxAbsScaler, MinMaxScaler,
 RobustScaler, and Z-Score. Subsequently, we evaluate the impact of the normalization algorithms
 with deep neural networks (DNN) for the classification of the human activities. The impact of the data
 normalization was counterintuitive, resulting in a degradation of performance. Namely, when using
 the accelerometer data, the accuracy dropped from about 79% to only 53% for the best normalization
 approach. Similarly, for the gyroscope data, the accuracy without normalization was about 81.5%,
 whereas with the best normalization, it was only 60%. It can be concluded that data normalization
 techniques are not helpful in classification problems with homogeneous data.

 Keywords: human activities; data normalization; data classification; sensors; mobile devices;
 data processing

1. Introduction
      Nowadays, mobile devices in all everyday tasks are increasing, and their usage allows users to
stay connected and communicate with ease [1,2]. The current pandemic situation discourages social
interaction and personal contacts, enhancing the role of technology in promoting social distancing
while being connected [3,4] and active, avoiding sedentary positions [5,6]. Several studies use mobile
devices to identify human activities and create a personal agenda to track people [7–10]. This is
especially important for people with special needs, including older adults or people with chronic
diseases [11–13]. The constant contact with professional healthcare will benefit people’s quality of
life [14–16].
      Sensors are vital for data acquisition related to human activities [17–19] and, lately, even for
diagnostic purposes [20,21]. Mobile devices include a large variety of sensors, including accelerometer,
magnetometer, gyroscope, acoustic, location, contacts, and other types of sensors [22,23].

Future Internet 2020, 12, 194; doi:10.3390/fi12110194                          www.mdpi.com/journal/futureinternet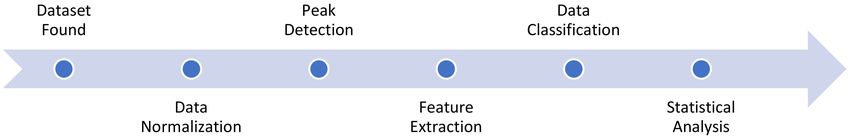
Future Internet 2020, 12, 194                                                                           2 of 14

The development of monitoring solutions is recurrent in the literature, and the advances in this
type of device promoted the creation of intelligence solutions [24–30].
      The data acquired by sensors depends on the mobile devices’ positioning, and their processing
is sometimes difficult [31,32]. The data normalization may be powerful in the data processing
stage without a large increase in memory and power processing needs [33]. There are different
data normalization methods that may be implemented, but the focus of this study was related to
the implementation of MaxAbsScaler [34], MinMaxScaler [35], RobustScaler [36], and Z-Score [33]
normalizers. Finally, for the data processing, several types of machine learning methods may be
implemented, including support vector machine (SVM) [37], decision tree [38], AdaBoost [39,40],
artificial neural networks (ANN) [41], k-nearest neighbor (kNN) [42], combined nomenclature (CN2)
rule inducer [43], and stochastic gradient descent (SGD) [44]. However, this paper’s remainder
proposes studying the parameters related to deep neural networks (DNN) [36].
      This study aims to explore the use of the “Heterogeneity Activity Recognition Data Set” [2]
for the implementation of four data normalization techniques, for further implementation of data
classification techniques for the automatic recognition of human activities. Furthermore, what this
study aims to achieve is to find out if the used normalization technique influences the human activity
recognition performance. The implemented method was based on deep neural networks (DNN) to
classify the different data included in the dataset. Furthermore, the data classification results are related
to the data normalization methods implemented and compared with the previous studies with other
datasets [45–47].
      There are many research studies related to the recognition of human activities. Still, it is not possible
to say which artificial intelligence method is reliable in general, for any given dataset. This study’s
scope consists of using data acquired from inertial sensors embedded in a mobile device, including
smartphones, smartwatches, and tablets, to implement data normalization and data classification
techniques to identify human activities. One lack of previous studies was related to the data acquisition,
in that the data were always acquired with the same device, i.e., a BQ Aquaris 5.7 smartphone [48,49].
      Previous studies were performed with accelerometer, magnetometer, and gyroscope sensors with
the same classification technique implemented in this study [46,50,51]. The normalization technique
previously implemented was the mean and standard deviation, like the Z-Score normalizer application.
The previously used dataset is available at [52].
      The previously used dataset has one more human activity than the dataset used in this
study. The previous studies used data fusion techniques to merge the accelerometer, magnetometer,
and gyroscope sensors’ data.
      The Introduction section is finished with this paragraph. This paper’s remainder is structured as
follows: Section 2 proposes the methodology of this study, presenting the dataset, data normalization,
peak detection algorithm, feature extraction, data classification, and statistical analysis stages.
The different data normalization techniques results are presented in Section 3. This study is concluded
in Section 4 with the main conclusions and discussion of the results of this study.

2. Methods
     Similarly to the previously implemented and published method with artificial intelligence for
automatic identification of daily activities [45–47], the data were acquired from off-the-shelf mobile
devices. This research implements deep neural networks (DNN), to prove its reliability on the used
dataset. The following sections present the details about the dataset used in this research (Section 2.1),
and the following sections present the structure proposed at [50]. Section 2.2 continues with the
presentation of different data normalization techniques. As in the previous study, this study performed
the experimentation of the normalization of the dataset with different normalization techniques.
The peak detection algorithm was refined and improved to calculate the features for applying artificial
intelligence methods, and it is presented in Section 2.3. Next, the different features extracted are
explained in Section 2.4. Next, the data classification methods are applied and presented in Section 2.5.
Future Internet 2020, 12, 194 3 of 14
Section 2.6 finalizes this study with a comparison of the results. Figure 1 presents the sequence of
activities performed for the recognition of human activities.
Figure 1. Schema of the data analysis and classification.
2.1. Dataset
The dataset used in this research is named the “Heterogeneity Activity Recognition Data
Set” [2]. This dataset was acquired from smartphones and smartwatches related to four human
activities, including walking upstairs, walking downstairs, standing, and walking. The authors of
the dataset reported that it was created to apply machine learning methods for automatic activity
recognition. The data acquisition was performed with different mobile devices, including smartwatches,
i.e., LG G and Samsung Galaxy Gear, smartphones, i.e., Apple iPhone 6, Samsung Galaxy Pocket+,
Samsung Galaxy S3 mini, LG Nexus 4, Samsung Galaxy S3, Samsung Galaxy Nexus, Samsung Galaxy S+,
LG Optimus 2X, HTC Desire, and HTC Nexus One, and tablets, i.e., Samsung Galaxy Tab 10.1.
The devices used have different frequencies for data acquisition between 25 and 200 Hz. The recordings
were performed by 9 different users from the accelerometer and gyroscope sensors at the
highest frequency.
2.2. Data Normalization
The data of the dataset were normalized to improve the results on activity recognition with
machine learning methods. Four data normalization techniques were applied. Firstly, MaxAbsScaler
scales and translates each feature individually by the maximum absolute value in the dataset [34].
Secondly, MinMaxScaler scales and translates each feature individually by the given range on the
training set [35]. Thirdly, the RobustScaler removes the median and scales the data according to
the quantile range [36]. The interquartile range (IQR) [53] is the range between the 1st quartile
(25th quantile) and the 3rd quartile (75th quantile). Finally, Z-Score normalization is a normalizing
strategy that avoids the outlier issue [33].
2.3. Peak Detection
The detection of the sensors’ signal variations and maximum values, commonly named peaks,
is important for discretizing the different activities because activities with high intensity have more
peaks with high values and low intensities have fewer peaks with low values [54].
The detection of peaks may be performed with different methods. This study used a sequential
method, smoothing the sensors’ signal and saving only the values where the next and previous values
are lower. The process must be executed several times until the iteration where the value of peaks is
the minimum, but it retains at least five peaks.
2.4. Feature Extraction
The definition of the correct and most reliable features for recognizing human activities is
important for the obtention of highly accurate results for the method of the automatic recognition of
them. Based on the previous knowledge [46,51,55], and the characteristics of the dataset used in this
study, the features extracted from the sensors are as follows:
• Accelerometer: mean, standard deviation, variance, and median values of the measured maximum
peaks, and mean, standard deviation, variance, median, maximum, and minimum values of the
raw signal;Future Internet 2020, 12, 194 4 of 14
• Gyroscope: mean, standard deviation, variance, and median values of the measured maximum
peaks, and mean, standard deviation, variance, median, maximum, and minimum values of the
raw signal.
After the feature extraction, the data classification techniques may be applied to establish the
relations between the features and the human activities.
2.5. Data Classification
This stage includes applying the artificial intelligence method to identify the human activities
available in the dataset. For this purpose, the deep neural networks (DNN) method was applied
similarly to [46,51].
For the training stage, we used a Sigmoid activation function, a learning rate of 0.1, a maximum
of 4 × 10⁶ training iterations, 3 hidden layers, the weight function called Xavier, the implementation of
backpropagation, and the use of the L2 regularization method [56].
The cross-validation technique was implemented in the testing stage to measure the validity
parameters of the implemented method. The results were statistically analyzed, as explained in
Section 2.6.
2.6. Statistical Analysis
For evaluating the results obtained with the cross-validation technique implemented,
the classification performance scores were measured, such as precision, specificity, accuracy, recall,
and F1-Score.
Finally, these results are compared with the results obtained with a previously published
dataset [51]. Most of the activities included in the dataset used for comparison were also included
in the dataset analyzed in this paper, except that captures were performed with other smartphones.
Comparing the frequencies of data acquisition, the two datasets may be compared with measuring this
dataset’s reliability and implementation.
3. Results
This research uses an unbalanced dataset to recognize four human activities, including walking
upstairs, walking downstairs, standing, and walking. The following section will present the confusion
matrixes and other related parameters, such as accuracy, precision, recall, and F1-Score. True positives
are cases where the activity was detected accurately. False positives are the cases where the activity
was correctly not detected (another activity was present and detected). False positives are cases where
the activity was falsely detected, and false negatives are the cases where the activity was detected but
other activities should have been detected. Firstly, accuracy is defined as
True Positives + True Negatives
Accuracy =
True Positives + True Negatives + False Positives + False Negatives
Secondly, precision is defined as
True Positives
Precision =
True Positives + False Positives
Thirdly, recall is defined as
True Positives
Recall =
True Positives + False NegativesFuture Internet 2020, 12, 194 5 of 14
Finally, F1-Score is defined as
True Positives
Fl_Score =
True Positives + 0.5(False Positives + False Negatives)
The analysis was performed with data acquired by the accelerometer and gyroscope sensors.
3.1. Normalized Data with MaxAbsScaler
Initially, MaxAbsScaler was used to normalize the data acquired from the accelerometer data
related to the analyzed human activities, in particular, walking upstairs, walking downstairs, standing,
and walking. Table 1 presents the confusion matrix related to the experiments performed with the
accelerometer sensor included in the dataset used. It was verified that the most correctly identified
activities are walking upstairs, walking downstairs, and walking.
Table 1. Confusion matrix for normalized accelerometer data with MaxAbsScaler.
Predicted Class
Walking Walking
Standing Walking
Upstairs Downstairs
walking upstairs 75 116 5 5
walking downstairs 53 141 2 6
Actual Class
standing 8 11 7 12
walking 0 4 3 32
Next, the classification results of the data acquired from the accelerometer sensor after the
application of MaxAbsScaler were analyzed, verifying that the DNN method implemented reported
an accuracy of 53.12%, a precision of 51.59%, a recall value of 51.90%, and an F1-Score of 51.74%.
In continuation, MaxAbsScaler was used to normalize the data acquired from the gyroscope
data related to the different human activities. Table 2 presents the confusion matrix related to the
experiments performed with the gyroscope sensor included in the dataset used. It was also verified
that the most correctly identified activities are walking upstairs, walking downstairs, and walking.
Table 2. Confusion matrix for normalized gyroscope data with MaxAbsScaler.
Predicted Class
Walking Walking
Standing Walking
Upstairs Downstairs
walking upstairs 95 46 0 3
walking downstairs 52 81 0 11
Actual Class
standing 5 1 7 15
walking 2 4 0 23
Besides, the classification results of the data acquired from the gyroscope sensor after the
application of MaxAbsScaler were analyzed, verifying that the DNN method implemented reported
an accuracy of 59.71%, a precision of 66.82%, a recall value of 56.63%, and an F1-Score of 61.31%.
3.2. Normalized Data with MinMaxScaler
The second data normalization algorithm that was evaluated on the same accelerometry data was
MinMaxScaler. Table 3 presents the confusion matrix related to the experiments performed with theFuture Internet 2020, 12, 194 6 of 14
accelerometer sensor included in the dataset used. It was verified that the most correctly identified
activities are walking downstairs and standing.
Table 3. Confusion matrix for normalized accelerometer data with MinMaxScaler.
Predicted Class
Walking Walking
Standing Walking
Upstairs Downstairs
walking upstairs 42 153 2 4
walking downstairs 50 139 12 1
Actual Class
standing 2 8 22 6
walking 2 4 14 19
Next, the classification results of the data acquired from the accelerometer sensor after the
application of MinMaxScaler were analyzed, verifying that the DNN method implemented reported
an accuracy of 46.25%, a precision of 49.20%, a recall value of 49.08%, and an F1-Score of 49.14%.
MinMaxScaler was also used to normalize the data acquired from the gyroscope data related
to the different human activities. Table 4 presents the confusion matrix related to the experiments
performed with the gyroscope sensor included in the dataset used. It was also verified that the most
correctly identified activities are walking upstairs and walking.
Table 4. Confusion matrix for normalized gyroscope data with MinMaxScaler.
Predicted Class
Walking Walking
Standing Walking
Upstairs Downstairs
walking upstairs 107 33 4 0
walking downstairs 89 47 8 0
Actual Class
standing 7 3 6 12
walking 1 2 4 22
Further, the classification results of the data acquired from the gyroscope sensor after the
application of MinMaxScaler were analyzed, verifying that the DNN method implemented reported
an accuracy of 52.75%, a precision of 49.93%, a recall value of 51.06%, and an F1-Score of 50.49%.
3.3. Normalized Data with RobustScaler
Thirdly, RobustScaler was also used to normalize the data acquired from the accelerometer. Table 5
presents the confusion matrix related to the experiments performed with the accelerometer sensor
included in the dataset used. It was verified that the most correctly identified activities are walking
upstairs and standing.Future Internet 2020, 12, 194 7 of 14
Table 5. Confusion matrix for normalized accelerometer data with RobustScaler.
Predicted Class
Walking Walking
Standing Walking
Upstairs Downstairs
walking upstairs 115 76 9 1
walking downstairs 104 77 20 1
Actual Class
standing 4 0 28 6
walking 0 0 20 19
Next, the classification results of the data acquired from the accelerometer sensor after the
application of RobustScaler were analyzed, verifying that the DNN method implemented reported an
accuracy of 49.79%, a precision of 52.16%, a recall value of 54.43%, and an F1-Score of 53.27%.
RobustScaler was used to normalize the data acquired from the gyroscope data related to the
different human activities. Table 6 presents the confusion matrix related to the experiments performed
with the gyroscope sensor included in the dataset used. It was also verified that the most correctly
identified activity is walking upstairs.
Table 6. Confusion matrix for normalized gyroscope data with RobustScaler.
Predicted Class
Walking Walking
Standing Walking
Upstairs Downstairs
walking upstairs 123 12 1 8
walking downstairs 97 40 0 7
Actual Class
standing 15 1 5 7
walking 15 1 5 7
Further, the classification results of the data acquired from the gyroscope sensor after the
application of RobustScaler were analyzed, verifying that the DNN method implemented reported an
accuracy of 50.87%, a precision of 48.22%, a recall value of 39.01%, and an F1-Score of 43.13%.
3.4. Normalized Data with Z-Score
The last data normalization approach that was evaluated was the Z-Score normalizer. Table 7
presents the confusion matrix related to the experiments performed with the accelerometer sensor
included in the dataset used. It was verified that the most correctly identified activities are walking
upstairs and walking.
Next, the classification results of the data acquired from the accelerometer sensor after the
application of the Z-Score normalizer were analyzed, verifying that the DNN method implemented
reported an accuracy of 52.71%, a precision of 59.04%, a recall value of 48.07%, and an F1-Score
of 52.99%.Future Internet 2020, 12, 194 8 of 14
Table 7. Confusion matrix for normalized accelerometer data with Z-Score.
Predicted Class
Walking Walking
Standing Walking
Upstairs Downstairs
walking upstairs 167 33 1 0
walking downstairs 141 54 2 5
Actual Class
standing 12 13 6 7
walking 4 9 0 26
In continuation, the Z-Score normalizer was used to normalize the data acquired from the
gyroscope data related to the different human activities. Table 8 presents the confusion matrix related
to the experiments performed with the gyroscope sensor included in the dataset used. It was also
verified that the most correctly identified activities are walking upstairs, standing, and walking.
Table 8. Confusion matrix for normalized gyroscope data with Z-Score.
Predicted Class
Walking Walking
Standing Walking
Upstairs Downstairs
walking upstairs 117 16 1 0
walking downstairs 89 52 0 3
Actual Class
standing 3 10 15 0
walking 1 9 7 12
Besides, the classification results of the data acquired from the gyroscope sensor after the
application of the Z-Score normalizer were analyzed, verifying that the DNN method implemented
reported an accuracy of 56.81%, a precision of 63.63%, a recall value of 53.08%, and an F1-Score
of 57.88%.
3.5. Non-Normalized Data
Finally, we evaluated the non-normalized data acquired from the accelerometer data related to
the four human activities. Table 9 presents the confusion matrix related to the experiments performed
with the accelerometer sensor included in the dataset used. It was verified that the most correctly
identified activities are walking upstairs, walking downstairs, and walking.
Next, the classification results of the non-normalized data acquired from the accelerometer
sensor were analyzed, verifying that the DNN method implemented reported an accuracy of 79.11%,
a precision of 78.52%, a recall value of 67.62%, and an F1-Score of 72.66%.
In continuation, the non-normalized data acquired from the gyroscope data related to the different
human activities were analyzed. Table 10 presents the confusion matrix related to the experiments
performed with the gyroscope sensor included in the dataset used. It was also verified that the most
correctly identified activities are walking upstairs, walking downstairs, and walking.Future Internet 2020, 12, 194 9 of 14
Table 9. Confusion matrix for non-normalized accelerometer data.
Predicted Class
Walking Walking
Standing Walking
Upstairs Downstairs
walking upstairs 293 51 2 1
walking downstairs 54 293 0 0
Actual Class
standing 9 54 3 0
walking 0 2 0 66
Table 10. Confusion matrix for non-normalized gyroscope data.
Predicted Class
Walking Walking
Standing Walking
Upstairs Downstairs
walking upstairs 230 21 2 0
walking downstairs 45 202 6 0
Actual Class
standing 24 12 12 0
walking 0 2 0 48
The classification results of the non-normalized data acquired from the gyroscope sensor were
analyzed, verifying that the DNN method implemented reported an accuracy of 81.46%, a precision of
80.54%, a recall value of 72.94%, and an F1-Score of 76.55%.
3.6. Overall Results
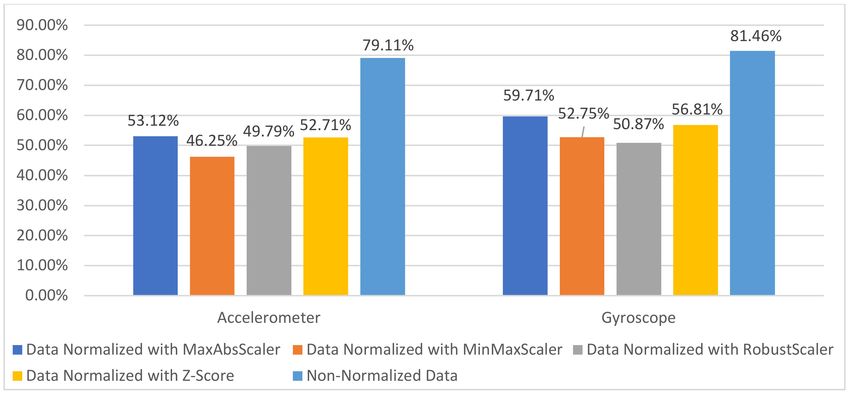
Based on the results obtained with this study, the best results were achieved with the gyroscope
data without applying normalization techniques. It was expected that the use of normalized data
would report the best results, but it was not verified, as presented in Figure 2.
Figure 2. Results on the data classification with accelerometer and gyroscope sensors.
Analyzing the accelerometer data, the best accuracy was reported with non-normalized data
(79.11%), and the application of normalization techniques decreased the accuracy. Firstly, the application
of Z-Score normalization decreased the results by 26.4%. Secondly, the application of RobustScalerFuture Internet 2020, 12, 194 10 of 14
decreased the results by 29.32%. Thirdly, the application of MinMaxScaler decreased the results by
32.86%. Finally, the application of MaxAbsScaler decreased the results by 25.99%.
The gyroscope data analysis revealed that the best accuracy reported was also with non-normalized
data (81.46%), and the application of normalization techniques also decreased the accuracy. Firstly,
the application of Z-Score normalization decreased the results by 24.65%. Secondly, the application of
RobustScaler decreased the results by 30.59%. Thirdly, the application of MinMaxScaler decreased the
results by 28.71%. Finally, the application of MaxAbsScaler decreased the results by 21.75%.
4. Discussion and Conclusions
The “Heterogeneity Activity Recognition Data Set” [2] was acquired with different mobile devices,
including smartphones, tablets, and smartwatches. Different devices have different frequencies of
data acquisition. We experimented with four normalization techniques: MaxAbsScaler, MinMaxScaler,
RobustScaler, and Z-Score. Furthermore, the DNN method was implemented for the classification of
the different human activities.
This study analyzed the difference between non-normalized and normalized data, verifying
that the dataset used in this study revealed the best results with the non-normalized data.
However, the previously used dataset revealed the best results with normalized data.
The results showed that the best accuracy (81.46%) was reported with non-normalized gyroscope
data to recognize three human activities. Furthermore, 79.11% accuracy was obtained with the use
of accelerometer data to recognize three human activities, also with non-normalized data. On the
contrary, the previously used dataset revealed the best accuracy with normalized data with or without
data fusion techniques.
Based on the comparison of the previous results presented in Table 11, non-normalized data
reported better accuracy with the dataset analyzed in this study than the previously used dataset.
However, normalization techniques reported bad accuracy with this dataset compared to the previously
used dataset which reported the correct recognition of five human activities. This dataset only reported
a maximum of three human activities correctly.
As future work, the impact of different techniques for data classification, data imputation,
and data normalization should be explored, as well as their impact when processing multi-modal
data collected by various sensors. Furthermore, other data normalization techniques should be
evaluated, as well as how the subsequently used machine learning algorithms benefit from the
normalization. As this research shows, deep learning algorithms can overcome bias in the data
without normalization. Furthermore, when processing homogeneous data collected by mobile devices,
with completely identical data collection frequencies and different ranges of data, this research shows
that data normalization impairs the classification accuracy. Other studies [56,57] show that more
classical algorithms, such as SVMs, decision trees, and tree ensembles, considerably benefit from
data normalization. These algorithms need to be further evaluated with the proposed approaches.
In the future, the impact of the presented data normalization and imputation methods should also
be evaluated on other datasets. In particular, when using other sensors in collecting multi-modal
data from various sensors, such as microphones [58], pressure sensors, infrared sensors, proximity
sensors, and oximeters, we expect the impact of the proposed data normalization algorithms to be
even more emphasized.Future Internet 2020, 12, 194 11 of 14
Table 11. Comparison of results obtained with a previous study.
Dataset Sensor(s) Normalizer Number of Activities Detected Accuracy
[2] Accelerometer MaxAbsScaler 3 53.12%
[2] Gyroscope MaxAbsScaler 3 59.71%
[2] Accelerometer MinMaxScaler 2 46.25%,
[2] Gyroscope MinMaxScaler 2 52.75%
[2] Accelerometer RobustScaler 2 49.79%
[2] Gyroscope RobustScaler 1 50.87%
[2] Accelerometer Z-Score 2 52.71%
[2] Gyroscope Z-Score 3 56.81%
[2] Accelerometer None 3 79.11%
[2] Gyroscope None 3 81.46%
[50] Accelerometer None 1 22.90%
Mean and
[50] Accelerometer Standard Deviation 5 85.89%
(similar to Z-Score)
Accelerometer and
[49] None 2 40.69%
Magnetometer
Mean and
Accelerometer and
[49] Standard Deviation 5 86.49%
Magnetometer
(similar to Z-Score)
Accelerometer,
[49] Magnetometer, and None 4 74.46%
Gyroscope
Accelerometer, Mean and
[49] Magnetometer, and Standard Deviation 5 89.52%
Gyroscope (similar to Z-Score)
In conclusion, the benefits of the implementation of data normalization techniques depend on the
dataset. It is unclear if normalization would improve the data classification because the number of
samples used was smaller than the previously used dataset. As the dataset is unbalanced, it may also
influence the implementation of artificial intelligence methods for activity recognition.
Author Contributions: Conceptualization, methodology, software, validation, formal analysis, investigation,
writing—original draft preparation, writing—review and editing; I.M.P., F.H., N.M.G., P.L. and E.Z. All authors
have read and agreed to the published version of the manuscript.
Funding: This work is funded by FCT/MEC through national funds and co-funded by FEDER—PT2020 partnership
agreement under the project UIDB/50008/2020 (Este trabalho é financiado pela FCT/MEC através de fundos nacionais e
cofinanciado pelo FEDER, no âmbito do Acordo de Parceria PT2020 no âmbito do projeto UIDB/50008/2020). This work is
also funded by National Funds through the FCT–Foundation for Science and Technology, I.P., within the scope of
the project UIDB/00742/2020. Furthermore, we would like to thank the Politécnico de Viseu for their support.
Acknowledgments: This work is funded by FCT/MEC through national funds and co-funded by FEDER—PT2020
partnership agreement under the project UIDB/50008/2020 (Este trabalho é financiado pela FCT/MEC através de fundos
nacionais e cofinanciado pelo FEDER, no âmbito do Acordo de Parceria PT2020 no âmbito do projeto UIDB/50008/2020).
This work is also funded by National Funds through the FCT–Foundation for Science and Technology, I.P.,
within the scope of the project UIDB/00742/2020. Furthermore, we would like to thank the Politécnico de
Viseu for their support. This article is based upon work from COST Action IC1303–AAPELE–Architectures,
Algorithms and Protocols for Enhanced Living Environments and COST Action CA16226–SHELD-ON–Indoor
living space improvement: Smart Habitat for the Elderly, supported by COST (European Cooperation in Science
and Technology). More information at www.cost.eu.
Conflicts of Interest: The authors declare no conflict of interest.Future Internet 2020, 12, 194 12 of 14
References
1. Hung, W.-C.; Shen, F.; Wu, Y.-L.; Hor, M.-K.; Tang, C.-Y. Activity Recognition with sensors on mobile devices.
In Proceedings of the 2014 International Conference on Machine Learning and Cybernetics, Lanzhou, China,
13–16 July 2014; pp. 449–454.
2. Stisen, A.; Blunck, H.; Bhattacharya, S.; Prentow, T.S.; Kjærgaard, M.B.; Dey, A.; Sonne, T.; Jensen, M.M. Smart
Devices are Different: Assessing and Mitigating: Mobile Sensing Heterogeneities for Activity Recognition.
In Proceedings of the 13th ACM Conference on Embedded Networked Sensor Systems—SenSys ’15, Seoul,
Korea, 1–4 November 2015; ACM Press: Seoul, Korea, 2015; pp. 127–140.
3. Adans-Dester, C.; Bamberg, S.; Bertacchi, F.; Caulfield, B.; Chappie, K.; Demarchi, D.; Erb, M.K.; Estrada, J.;
Fabara, E.; Freni, M.; et al. Can mHealth Technology Help Mitigate the Effects of the COVID-19 Pandemic?
IEEE Open J. Eng. Med. Biol. 2020, 1. [CrossRef]
4. Zeinalipour-Yazti, D.; Claramunt, C. COVID-19 Mobile Contact Tracing Apps (MCTA): A Digital Vaccine
or a Privacy Demolition? In Proceedings of the 2020 21st IEEE International Conference on Mobile Data
Management (MDM), Versailles, France, 30 June–3 July 2020; pp. 1–4.
5. Shany, T.; Redmond, S.J.; Narayanan, M.R.; Lovell, N.H. Sensors-Based Wearable Systems for Monitoring of
Human Movement and Falls. IEEE Sens. J. 2012, 12, 658–670. [CrossRef]
6. Wong, W.Y.; Wong, M.S.; Lo, K.H. Clinical applications of sensors for human posture and movement analysis:
A review. Prosthet. Orthot. Int. 2007, 31, 62–75. [CrossRef] [PubMed]
7. Chen, Y.; Shen, C. Performance Analysis of Smartphone-Sensor Behavior for Human Activity Recognition.
IEEE Access 2017, 5, 3095–3110. [CrossRef]
8. Ignatov, A. Real-time human activity recognition from accelerometer data using Convolutional Neural
Networks. Appl. Soft Comput. 2018, 62, 915–922. [CrossRef]
9. Tian, Y.; Chen, W. MEMS-based human activity recognition using smartphone. In Proceedings of the 2016
35th Chinese Control Conference (CCC), Chengdu, China, 27–29 July 2016; pp. 3984–3989.
10. Zhu, Q.; Chen, Z.; Soh, Y.C. Smartphone-based Human Activity Recognition in buildings using
Locality-constrained Linear Coding. In Proceedings of the 2015 IEEE 10th Conference on Industrial
Electronics and Applications (ICIEA), Auckland, New Zealand, 15–17 June 2015; pp. 214–219.
11. Doyle, J.; Kealy, A.; Loane, J.; Walsh, L.; O’Mullane, B.; Flynn, C.; Macfarlane, A.; Bortz, B.; Knapp, R.B.;
Bond, R. An integrated home-based self-management system to support the wellbeing of older adults.
J. Ambient. Intell. Smart Environ. 2014, 6, 359–383. [CrossRef]
12. Zainal, A.; Razak, F.H.A.; Ahmad, N.A. Older People and the Use of Mobile Phones: An Interview Study.
In Proceedings of the 2013 International Conference on Advanced Computer Science Applications and
Technologies, Kuching, Malaysia, 23–24 December 2013; pp. 390–395.
13. Tan, Q.L.L.; Chye, L.M.Y.; Ng, D.H.M.; Chong, M.S.; Ng, T.P.; Wee, S.L. Feasibility of a community-based
Functional Power Training program for older adults. Clin. Interv. Aging 2018, 13, 309–316. [CrossRef]
14. Guimarães, H.; Boix, H.; Rodrigues, C.; Tomé, T.; Rocha, G.; Vento, M. Impact of the global financial crisis on
newborn care in Portugal and Spain: Perception of health professionals. Acta Paediatr. 2020, 109, 625–627.
[CrossRef]
15. Por, J.; Barriball, L.; Fitzpatrick, J.; Roberts, J. Emotional intelligence: Its relationship to stress, coping,
well-being and professional performance in nursing students. Nurse Educ. Today 2011, 31, 855–860. [CrossRef]
16. Steinhubl, S.R.; Muse, E.D.; Topol, E.J. The emerging field of mobile health. Sci. Transl. Med. 2015, 7, 283rv3.
[CrossRef]
17. Sendra, S.; Granell, E.; Lloret, J.; Rodrigues, J.J.P.C. Smart collaborative system using the sensors of mobile
devices for monitoring disabled and elderly people. In Proceedings of the 2012 IEEE International Conference
on Communications (ICC), Ottawa, ON, Canada, 10–15 June 2012; pp. 6479–6483.
18. Majumder, S.; Deen, M.J. Smartphone Sensors for Health Monitoring and Diagnosis. Sensors 2019, 19, 2164.
[CrossRef] [PubMed]
19. Galán-Mercant, A.; Cuesta-Vargas, A.I. Clinical frailty syndrome assessment using inertial sensors embedded
in smartphones. Physiol. Meas. 2015, 36, 1929–1942. [CrossRef] [PubMed]
20. Glowinski, S.; Łosiński, K.; Kowiański, P.; Waśkow, M.; Bryndal, A.; Grochulska, A. Inertial Sensors as a Tool
for Diagnosing Discopathy Lumbosacral Pathologic Gait: A Preliminary Research. Diagnostics 2020, 10, 342.
[CrossRef] [PubMed]Future Internet 2020, 12, 194 13 of 14
21. Godfrey, A.; Bourke, A.K.; Ólaighin, G.M.; van de Ven, P.; Nelson, J. Activity classification using a single
chest mounted tri-axial accelerometer. Med. Eng. Phys. 2011, 33, 1127–1135. [CrossRef] [PubMed]
22. Stankevich, E.; Paramonov, I.; Timofeev, I. Mobile phone sensors in health applications. In Proceedings of
the 2012 12th Conference of Open Innovations Association (FRUCT), Oulu, Finland, 5–9 November 2012;
pp. 1–6.
23. Sousa, P.; Sabugueiro, D.; Felizardo, V.; Couto, R.; Pires, I.; Garcia, N. mHealth sensors and applications for
personal aid. In Mobile Health; Springer: Cham, Switzerland, 2015; pp. 265–281.
24. Amoh, J.; Odame, K.M. Technologies for Developing Ambulatory Cough Monitoring Devices. Crit. Rev.
Biomed. Eng. 2014. [CrossRef]
25. Appelboom, G.; Camacho, E.; Abraham, M.E.; Bruce, S.S.; Dumont, E.L.; Zacharia, B.E.; D’Amico, R.;
Slomian, J.; Reginster, J.Y.; Bruyère, O.; et al. Smart wearable body sensors for patient self-assessment and
monitoring. Arch Public Health 2014, 72, 28. [CrossRef] [PubMed]
26. Kakria, P.; Tripathi, N.K.; Kitipawang, P. A Real-Time Health Monitoring System for Remote Cardiac Patients
Using Smartphone and Wearable Sensors. Int. J. Telemed. Appl. 2015, 2015, 1–11. [CrossRef]
27. Guo, J.; Zhou, X.; Sun, Y.; Ping, G.; Zhao, G.; Li, Z. Smartphone-Based Patients’ Activity Recognition by
Using a Self-Learning Scheme for Medical Monitoring. J. Med. Syst. 2016, 40, 140. [CrossRef]
28. Pantelopoulos, A.; Bourbakis, N.G. A survey on wearable sensor-based systems for health monitoring and
prognosis. IEEE Trans. Syst. Man Cybern. Part C 2010, 40, 1–12. [CrossRef]
29. Pires, I.M.; Valente, T.; Pombo, N.; Garcia, N.M. Conceptual Definition of a Platform for the Monitoring
of the Subjects with Nephrolithiasis Based on the Energy Expenditure and the Activities of Daily Living
Performed. In Highlights of Practical Applications of Agents, Multi-Agent Systems, and Complexity: The PAAMS
Collection; Springer: Berlin/Heidelberg, Germany, 2018.
30. Shahriyar, R.; Bari, M.F.; Kundu, G.; Ahamed, S.I.; Akbar, M.M. Intelligent Mobile Health Monitoring
System (IMHMS). In Electronic Healthcare; Kostkova, P., Ed.; Lecture Notes of the Institute for Computer
Sciences, Social Informatics and Telecommunications Engineering; Springer: Berlin/Heidelberg, Germany,
2010; Volume 27, pp. 5–12, ISBN 978-3-642-11744-2.
31. Pires, I.; Felizardo, V.; Pombo, N.; Garcia, N.M. Limitations of energy expenditure calculation based on a
mobile phone accelerometer. In Proceedings of the 2017 International Conference on High Performance
Computing & Simulation (HPCS), Genoa, Italy, 17–21 July 2017; pp. 124–127.
32. Pires, I.M.; Garcia, N.M.; Pombo, N.; Flórez-Revuelta, F. Limitations of the Use of Mobile Devices and
Smart Environments for the Monitoring of Ageing People. In Proceedings of the 4th International Conference
on Information and Communication Technologies for Ageing Well and e-Health (ICT4AWE 2018); Science and
Technology Publications, Lda: Setúbal, Portugal, 2018.
33. Patro, S.G.K.; Sahu, K.K. Normalization: A Preprocessing Stage. Int. Adv. Res. J. Sci. Eng. Technol. 2015,
20–22. [CrossRef]
34. Mistry, J.; Inden, B. An Approach to Sign Language Translation using the Intel RealSense Camera.
In Proceedings of the 2018 10th Computer Science and Electronic Engineering (CEEC), Colchester, UK, 19–21
September 2018; pp. 219–224.
35. Narkhede, A.H. Human Activity Recognition Based on Multimodal Body Sensing. Master’s Thesis, San Jose
State University, San Jose, CA, USA, 2019.
36. Vermeulen, A.F. Unsupervised Learning: Deep Learning. In Industrial Machine Learning; Apress: Berkeley,
CA, USA, 2020; pp. 225–241, ISBN 978-1-4842-5315-1.
37. Lameski, P.; Zdravevski, E.; Mingov, R.; Kulakov, A. SVM Parameter Tuning with Grid Search and Its Impact
on Reduction of Model Over-fitting. In Rough Sets, Fuzzy Sets, Data Mining, and Granular Computing; Yao, Y.,
Hu, Q., Yu, H., Grzymala-Busse, J.W., Eds.; Lecture Notes in Computer Science; Springer International
Publishing: Cham, Switzerland, 2015; Volume 9437, pp. 464–474, ISBN 978-3-319-25782-2.
38. Kamiński, B.; Jakubczyk, M.; Szufel, P. A framework for sensitivity analysis of decision trees. Cent. Eur. J.
Oper. Res. 2018, 26, 135–159. [CrossRef] [PubMed]
39. Freund, Y.; Schapire, R.E. A Decision-Theoretic Generalization of On-Line Learning and an Application to
Boosting. J. Comput. Syst. Sci. 1997, 55, 119–139. [CrossRef]
40. Hastie, T.; Rosset, S.; Zhu, J.; Zou, H. Multi-class AdaBoost. Stat. Interface 2009, 2, 349–360. [CrossRef]
41. Hassoun, M.H. Fundamentals of Artificial Neural Networks; MIT Press: Cambridge, MA, USA, 1995;
ISBN 0-262-08239-X.Future Internet 2020, 12, 194 14 of 14
42. Altman, N.S. An Introduction to Kernel and Nearest-Neighbor Nonparametric Regression. Am. Stat. 1992,
46, 175–185. [CrossRef]
43. Clark, P.; Niblett, T. The CN2 induction algorithm. Mach Learn 1989, 3, 261–283. [CrossRef]
44. Pfaff, F.; Noack, B.; Hanebeck, U.D. Data validation in the presence of stochastic and set-membership
uncertainties. In Proceedings of the Information Fusion (FUSION), 2013 16th International Conference on
Information Fusion, Istanbul, Turkey, 9–12 July 2013; pp. 2125–2132.
45. Pires, I.M.; Teixeira, M.C.; Pombo, N.; Garcia, N.M.; Flórez-Revuelta, F.; Spinsante, S.; Goleva, R.; Zdravevski, E.
Android Library for Recognition of Activities of Daily Living: Implementation Considerations, Challenges,
and Solutions. Open Bioinform. J. 2018, 11, 61–88. [CrossRef]
46. Pires, I.M.; Garcia, N.M.; Pombo, N.; Flórez-Revuelta, F.; Spinsante, S.; Teixeira, M.C. Identification of
activities of daily living through data fusion on motion and magnetic sensors embedded on mobile devices.
Pervasive Mob. Comput. 2018, 47, 78–93. [CrossRef]
47. Pires, I.M.; Garcia, N.M.; Pombo, N.; Flórez-Revuelta, F. From Data Acquisition to Data Fusion:
A Comprehensive Review and a Roadmap for the Identification of Activities of Daily Living Using
Mobile Devices. Sensors 2016, 16, 184. [CrossRef]
48. Smartphones BQ Aquaris | BQ Portugal. Available online: https://www.bq.com/pt/smartphones (accessed on
29 August 2020).
49. BQ Aquaris 5.7—Specifications. Available online: https://www.devicespecifications.com/en/model/59bb30eb
(accessed on 17 September 2020).
50. Pires, I.M.; Hussain, F.; Garcia, N.M.; Zdravevski, E. Improving Human Activity Monitoring by Imputation
of Missing Sensory Data: Experimental Study. Future Internet 2020, 12, 155. [CrossRef]
51. Pires, I.M.; Marques, G.; Garcia, N.M.; Flórez-Revuelta, F.; Canavarro Teixeira, M.; Zdravevski, E.; Spinsante, S.;
Coimbra, M. Pattern Recognition Techniques for the Identification of Activities of Daily Living Using a
Mobile Device Accelerometer. Electronics 2020, 9, 509. [CrossRef]
52. Pires, I. Raw dataset with accelerometer, gyroscope and magnetometer data for activities with motion.
Mendeley 2020. [CrossRef]
53. Wan, X.; Wang, W.; Liu, J.; Tong, T. Estimating the sample mean and standard deviation from the sample size,
median, range and/or interquartile range. BMC Med. Res. Methodol. 2014, 14, 135. [CrossRef] [PubMed]
54. Ferreira, J.M.; Pires, I.M.; Marques, G.; García, N.M.; Zdravevski, E.; Lameski, P.; Flórez-Revuelta, F.;
Spinsante, S.; Xu, L. Activities of Daily Living and Environment Recognition Using Mobile Devices:
A Comparative Study. Electronics 2020, 9, 180. [CrossRef]
55. Ng, A.Y. Feature Selection, L1 vs. L2 Regularization, and Rotational Invariance. In Proceedings of the
Twenty-First International Conference on Machine Learning—ICML ’04, Banff, AL, Canada, 4–8 July 2004;
ACM Press: Banff, AL, Canada, 2004; p. 78.
56. Zdravevski, E.; Lameski, P.; Mingov, R.; Kulakov, A.; Gjorgjevikj, D. Robust Histogram-Based Feature
Engineering of Time Series Data. In Proceedings of the 2015 Federated Conference on Computer Science and
Information Systems (FedCSIS), Lodz, Poland, 13–16 September 2015; pp. 381–388.
57. Zdravevski, E.; Lameski, P.; Kulakov, A. Automatic feature engineering for prediction of dangerous seismic
activities in coal mines. In Proceedings of the 2016 Federated Conference on Computer Science and
Information Systems (FedCSIS), Gdansk, Poland, 11–14 September 2016; pp. 245–248.
58. Pires, I.M.; Santos, R.; Pombo, N.; Garcia, N.M.; Flórez-Revuelta, F.; Spinsante, S.; Goleva, R.; Zdravevski, E.
Recognition of activities of daily living based on environmental analyses using audio fingerprinting
techniques: A systematic review. Sensors 2018, 18, 160. [CrossRef] [PubMed]
Publisher’s Note: MDPI stays neutral with regard to jurisdictional claims in published maps and institutional
affiliations.
© 2020 by the authors. Licensee MDPI, Basel, Switzerland. This article is an open access
article distributed under the terms and conditions of the Creative Commons Attribution
(CC BY) license (http://creativecommons.org/licenses/by/4.0/).You can also read