Predicting Housing Prices Using Structural Attributes and Distance to Nearby Schools
←
→
Page content transcription
If your browser does not render page correctly, please read the page content below
Predicting Housing Prices Using Structural
Attributes and Distance to Nearby Schools

                  MSc Research Project
                    Data Analytics

           Mohammed Abou Hassan
                        x16150911

                  School of Computing
                National College of Ireland

Supervisor:
Dr. Dympna O’Sullivan, Dr. Paul Stynes, Dr. Pramod Pathak
National College of Ireland
                      Project Submission Sheet – 2017/2018
                              School of Computing

 Student Name:             Mohammed Abou Hassan
 Student ID:               x16150911
 Programme:                Data Analytics
 Year:                     September 2017
 Module:                   MSc Research Project
 Lecturer:                 Dr. Dympna O’Sullivan, Dr. Paul Stynes, Dr. Pramod Pathak
 Submission     Due        13/08/2018
 Date:
 Project Title:            Predicting Housing Prices Using Structural Attributes and
                           Distance to Nearby Schools
 Word Count:               5780

    I hereby certify that the information contained in this (my submission) is information
pertaining to research I conducted for this project. All information other than my own
contribution will be fully referenced and listed in the relevant bibliography section at the
rear of the project.
    ALL internet material must be referenced in the bibliography section. Students
are encouraged to use the Harvard Referencing Standard supplied by the Library. To
use other author’s written or electronic work is illegal (plagiarism) and may result in
disciplinary action. Students may be required to undergo a viva (oral examination) if
there is suspicion about the validity of their submitted work.

 Signature:

 Date:                     11th August 2018

    PLEASE READ THE FOLLOWING INSTRUCTIONS:
1. Please attach a completed copy of this sheet to each project (including multiple copies).
2. You must ensure that you retain a HARD COPY of ALL projects, both for
your own reference and in case a project is lost or mislaid. It is not sufficient to keep
a copy on computer. Please do not bind projects or place in covers unless specifically
requested.
3. Assignments that are submitted to the Programme Coordinator office must be placed
into the assignment box located outside the office.

 Office Use Only
 Signature:

 Date:
 Penalty Applied (if
 applicable):
Predicting Housing Prices Using Structural Attributes
and Distance to Nearby Schools
Mohammed Abou Hassan
x16150911
MSc Research Project in Data Analytics
11th August 2018
Abstract
Objective: Housing is a basic human need and buying one is an important
decision that should be made carefully as it leads to future financial commitment.
Developing a model that can help buyers make this decision by predicting the price
of a house is of extreme importance. This work will investigate to what extent the
performance of the predicting model can be improved by taking the distance to
nearby schools into account.
Background: Early studies used different types of regression models, each trying
to approach the research question in a different way with one thing in common; these
models produced good predictions only when the researcher was able to make solid
statistical assumptions which required a lot of domain knowledge and experience
in statistical modelling.
Methods: To overcome these challenges, this work will use a machine learning
approach. It requires no domain knowledge and was proved to produce excellent
results even if the data had non-linear relationships. The dataset to be used in this
work will include structural attributes like number of bedrooms and bathrooms
and one locational attribute which is the distance to the nearest school. Artificial
Neural Networks (ANN) was proved reliable for housing price predictions in earlier
research and this work will aim at investigating how the accuracy of such models
will change when distance to the nearest school is added to the model.
Results: Two ANN models were built, one that includes the distance to school
feature and another model that does not. The results of R squared of the two
models were compared to find the one that performed better. The results showed
that the model that includes the distance to the nearest school scored 1%less.
Findings: R squared values were around 60% for the two models, a percentage
that suggests there is a strong relationship between the different features in the
main dataset used. Also, these results show that distance to school feature has
made a positive contribution to the overall performance as R squared stayed almost
constant when this feature was included despite the fact this contribution was not
high enough to improve the performance of the model.
1 Introduction
Housing is regarded as one of the most essential needs in our modern society and having
a system that can predict the right price of a house could help buyers and sellers achieve
1better transactions; sellers will save money by cutting out auctioneers services and buyers
can bid more comfortably by knowing the price given by such system is real, accurate and
not inflated for profit (Mukhlishin et al.; 2017). People tend to live near their children’s
schools as proved by (Metz; 2015) to save money and time and as a result, prices of
the properties nearby schools become higher. Previous research has studied the effect of
schools on housing prices using regression models that included features like the number of
bathrooms, bedrooms, year of sale (Wu et al.; 2016) but using regression requires domain
knowledge and strong statistics assumptions, challenges this research will overcome by
using a machine learning approach, ANN. While ANN models are known for their very
good performance, they still need a large number of rows in order to produce good results,
which is a limitation this work might come across as access to housing information in
Ireland depends on the Price Property Register that does not have any data prior to
2010. This work will build two ANN models using number of bedrooms/bathrooms, year
of sale and address as features. The first model will include an additional distance to
school feature and the second model will exclude it. R squared results of the two models
will reveal the effect of adding distance to nearby schools on one of the models and by
doing so this work will answer the question: To what extent can the accuracy of house
price forecasting be improved by taking into account the distance to the nearest schools?
2 Related Work
The literature review of the research done on ”Prediction of Housing Prices” shows that
there are two main approaches followed by researchers: Regression Modelling approach
and Machine Learning approach (Park and Kwon Bae; 2015). The two approaches will
be discussed thoroughly in the next two subsections named Regression and ANN.
2.1 Regression
Regression models are widely used to forecast prices of housing properties. In spite of
their popularity which is due to their good overall performance when used with data that
presents linear relationships between features, regression models face many challenges
when dealing with non-linear relationships. Also, outliers, discontinuity and fuzziness in
data could make building a reliable regression model a challenging task (Park and Kwon
Bae; 2015).
In this section we will go through some of the most relevant work done on regression
models starting with (Brown and Rosen; 1982). Their paper was one of the first papers
published in the area of housing price predictions. They built a regression model and
they included hedonic feautures to it (hedonic features are internal and external features
that can affect the price of a house). In their work, they also managed to relate price
to supply, demand and market stability. (Rabiega et al.; 1984) was one of the first
studies to take the social aspect of the surrounding neighbourhood into consideration
where they studied the effect of building a public housing project on the prices of the
housing properties nearby. Heteroscedasticity (unequal scatter) is considered a challenge
to all regression models where it might cause them to make wrong predictions. In fact,
most of the previous regression models suffered from this problem. (Bin; 2004) found a
solution to this issue by incorporating data from Geographic Information System (GIS)
into their model to account for locational attributes of the houses. When compared to
2older models, the one built by (Bin; 2004) performed better in both in-sample and out-
of-sample predictions.This work will use the same approach to find the coordinates of
each housing addresses but using Google Geocoding Services instead of GIS. Regression
models kept improving with time, and the biggest improvement was done by (Osland;
2010). Their reason for success was assigning more weight in the regression equation to
the economically strong areas through a comprehensive analysis. This approach required
very strong field knowledge along with strong statistical assumptions and estimations
which are considered challenges for most researchers, that are hard to overcome. Hence
the need for a different method that is easier to implement and that does not require
the deep knowledge of the housing market; a method that can capture the relationship
between all the features in the dataset even if this relationship was not linear Kuan et al.;
2010. Regression models built to predict housing prices included a wide spectrum of
features with some more important than others. (Kahveci and Sabaj; 2017)has proved
that the distance to school feature is an important one that contributed greatly to the
regression model hence this model will investigate the effect of the addition of such feature
to ANN.
2.2 ANN
Due to their abilities to capture non-linear relationships which is a task that cannot be
done with regression models, machine learning methods are more suited for housing price
prediction as relations between different features in a dataset are not always linear. There
are many machine leaning techniques that are used by researches to predict housing
prices and the most popular one is called Artificial Neural Networks or ANN (Chen
and Zhang; 2014). ANN simulates the functioning of the natural nerves (neurons) in
the human body. It learns patterns and relationships inside a dataset to make later
predictions (Kohonen; 1988). Depending on their internal architecture, ANN can be
divided into three main classes: feedforward neural networks (Moody and Darken; 1989),
feedback neural networks (Elman; 1990) and self-organising networks (Kohonen; 1982).
The research done by (Chiarazzo et al.; 2014) used ANN to predict housing prices. The
coefficient of Correlation R was chosen to evaluate the accuracy of the predictions and it
was found to be 0.827 on the testing dataset. A value that proves that ANN is a reliable
machine technique when it comes to forecasting housing prices. The features used in the
latter work included structural attributes as well as distances to nearby landmarks like
suburban train stations and city centres. Based on these good results, this study will
adopt the idea of including distance to Luas stations into the two models built which
will boost their performances. Because of this, the two models will be strong enough (R
squared reading will be significant in the two models) to investigate the effect of including
the distance to schools feature.
3 Methodology
3.1 Data
As mentioned above, the main focus of this research is to investigate the effect of nearby
schools on the housing prices. Dublin was chosen for this study, along with all primary
schools scattered within its boundaries. The data used went through three main stages
before it was ready to be used with the model:
3a- Data Sourcing:
• Scraping data from daft.ie: Data of the housing sector were found on the Irish
website daft.ie. The data present on the website was in the unstructured form and
had to be scraped using Python. It included the following details; Address of a
property, number of bedrooms/bathrooms, date of sale, price.
• Downloading primary school data from cso.ie: A dataset that included addresses
of all primary schools in Ireland along with their coordinates was downloaded from
cso.ie.
• Downloading Luas stops data: The dataset downloaded from data.gov.ie had the
addresse of each Luas stop in Dublin along with its longitude and latitude.
b- Data cleaning: The data scraped from daft.ie was cleaned using python. More in
depth cleaning techniques will be discussed in the implementation section. The data
scraped also had missing values in the number of bedrooms/bathrooms fields and these
features were deleted. Clean data were then placed in rows and columns in a dataset that
will be referred to as the main dataset in the next sections.
c- Data Processing:
• Geocoding Addresses: Coordinates of each housing property in the dataset were
found using a paid service offered by Google called Google Geocoding. Each hous-
ing address from the main dataset was fed to Google Services through Python
Algorithm and an API. The algorithm returned the coordinates of each address fed
in two features called longitude and latitude. These two features were then added
to the main dataset. The main dataset now had the following features: Address,
Price, number of bedrooms/bathrooms, Year, Longitude and Latitude.
• Finding Distances: The main task here was to find distances from each property to
the nearest school. Each housing property has a pair of coordinates, longitude and
latitude and each school also has longitude and latitude values. For a particular
house, the algorithm will calculate the distances from the house to all schools in
Dublin then compare their values and only keep the smallest one while dropping the
rest. The same process was repeated for every house in the dataset until all distances
from each property to its nearest school were found. These distances were then
placed in a feature called Distance to School. Using the same approach, distances
from each house to the nearest Luas stop were found (using the coordinates of the
Luas stops downloaded from data.gove.ie) and added to the main dataset which
has the following shape at this stage: (see Table 1 below)
The distance to luas feature was initially added to the model to help it and boost
its performance by giving it another feature. Increasing R squared allowed this
work to compare the values of the two models (with/without distance to school) in
a clearer way.
• Building the models: Two models were built using ANN. One that includes the
distance to school feature and looks exactly like Table 1 below, and another model
without it. More in depth discussion about the modelling technique can be found
in the next section.
4Address
Date
Bedrooms
Bathrooms
Long
Lat
Price
Distance To School
Distance To Luas Stop
Table 1: Main Dataset
3.2 Modelling
Based on the approach used by (Mukhlishin, Saputra, & Wibowo, 2017) to predict housing
prices, two models were built using the same main dataset but with only one difference:
- The first model had distance to school feature included in the input dataset
- The second model dropped the distance to school feature from the main dataset
R squared and loss function results will reveal to what extent the distance to nearest
schools has affected the model.
The strength of this approach lies in the fact that no prior knowledge of the housing
sector is required before building the model. Also, the relationships between the different
features, whether linear or not, can be captured by ANN. One limitation for this model is
that data scraped from daft.ie had numerous missing values that had to be deleted (75%
of the total number of rows). Around 25,000 rows were left in the dataset and despite the
fact this number is acceptable to build a model, it is not considered ideal for ANN that
usually prefers bigger numbers. The performance metrics between the two models will
decide whether the distance to the nearest school has an impact on the housing prices.
3.3 Evaluation
ANN models are described as black boxes which produce results that are hard to explain.
They adjust the weights and biases automatically and according to the parameters used
with the model. Despite this fact, different metrics can be used with ANN that can show
the accuracy of the predictions made by such model. With this work, one dependent
feature was to be predicted which is the price of the housing property. In machine
learning, this is considered a regression problem where a value (number) is being predicted
and not a class. For this reason, confusion matrix and accuracy cannot be used in this
case and instead this work has opted for other options to understand the quality of the
predictions:
• R squared (coefficient of determination): An R squared function was built and
added to the network that will return a value between 0 and 1. The closer to 1
the bigger proportion of variance is explained by the model. An early stop monitor
was also added to the network with patience = 2, which meant the model will stop
training if the performance did not improve after two epochs (an epoch describes
the number of times the model sees the entire dataset). By definition, R square is
one minus the Sum of Squares of Residuals (SSerror) divided by the Total Sum of
Squares, R squared = 1 - (SSerror / SStotal).
5• Loss function: The loss function used was the mean squared error. Loss functions
measure the inconsistency between predicted values and labels. The smaller the
loss value, the more robust and reliable the model.
• The input dataset of this work was of reasonable size (around 25,000 rows) which
means a cross validation algorithm could be added to the model. The cross-
validation algorithm divides the input dataset into training set (70%) and validation
set (30%). Two scores will be displayed at the end of the training phase, one for the
training set and the other is for the validation set. This process will be repeated
10 times (k=10) and at the end, the average of the scores of the 10 samples will be
found. Cross validation gauges the performance of the model and checks whether
it is accurate or it is over/under fitting.
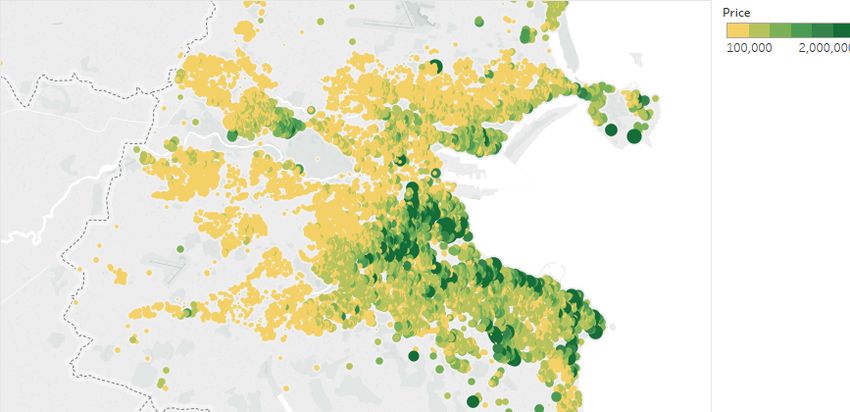
• Tableau was used to draw a map of the housing properties in Dublin, highlighting
the different prices accross the city(Figure 8). Also, It was used to draw a map
of all schools present in Dublin (Figure 9). Both maps can be seen in section 5.2.
These two maps allow the visual analysis of the correlation between schools and
housing prices.
Finally, CRISP-DM process model was followed throughout this entire work, from the
early stage of studying the business needs until the final stage of deploying of the model.
It is a process that was developed in year 2000 by CRISP-DM consortium (Chapman et
al., 2000) and it was applied in this work by iterating almost all steps to achieve better
results.
4 Design and Implementation
4.1 Design Specifications
a- Data Sourcing and Cleaning: In order to produce a system that can predict real
prices in Euro, real data had to be sourced. This was the first step of the project. Three
different sources were used:
• The first source is the Irish website http://www.daft.ie/price-register/ that keeps
records of more than 85,000 housing properties sold between 2010 and 2018. The list
of these sold properties can be found on a section of the website called Residential
Property Price Register and it includes the price of the property, the complete
address, the date of sale, the type of the property and the number of bedrooms and
bathrooms. A screen shot of a section of the page can be seen in Figure 1 below.
Figure 1: Screenshot 1
The data cannot be downloaded from the website in structured form, so it was
scraped using a Python algorithm. 3,800 pages were scraped and the details of the
functioning of the algorithm will be discussed in a later section.
6• The Irish Central Statistics Office have a website (www.cso.ie) that this work used
to download a dataset containing addresses of all primary schools in Ireland, along
with their coordinates (longitude and latitude).
• The last source of data is www.data.gov.ie. This work has downloaded a dataset
from this website that contains addresses and locations of all Luas stops in Dublin.
All locations are given in longitude/latitude format.
b- Data Scraping-Downloading: For the data downloaded from cso.ie and data.gov.ie,
datasets included extra features that needed to be removed as they could not be used
with our model. The only features remaining in each of these datasets were the Address,
Longitude and Latitude and that was done for the sole reason of calculating the distances
to schools and Luas stops to be used in the model. No other cleaning tasks were performed
on these datasets as they are downloaded in columns/rows structured form.
The data present on daft.ie was scraped using python and a package called Selenium.
Using a python algorithm, Selenium opens daft website using Chrome driver, scrapes the
data on a specific section of the page using the sections XPATH, clicks the next button to
move on to the following page, scrapes the data of the next page and repeats the process
until all pages are scraped. The data scraped included the address, price, date of sale,
number of bedrooms and bathrooms present in each property. The data scraped also
included the type of the property (Detached house, apartment ) which was removed in
later steps as the description was not accurate with a large number of missing values.
c- Data Cleaning: The data scraped was split up and rearranged in columns (fea-
tures) and rows (85,844 rows) and the names of the features are: Address, Price, Number
of Bedrooms, Number of Bathrooms and Date of Sale. After arranging the data scraped
into the structured form of rows and columns, further cleaning steps were taken:
• A large number of rows did not have the number of bedrooms/bathroom (see screen-
shot 2 in Figure 2 below) hence these rows were deleted. In total and after deletion
of the latter rows, 25,343 housing properties were left in the dataset.
Figure 2: Screenshot 2
• Random asterisks (*) and characters like ([”, —) that appeared after scraping daft.ie
website were deleted using python script.
• The date format was changed from dd/mm/yy to yyyy to make it easier for the
model.
• The Price feature had a comma , instead of the decimal point which was corrected
in python.
7d- Data Processing:
• Distance to Nearest School: As mentioned in the introduction, this work aims at
studying the effect of nearby schools on the prices of housing properties. For this
reason, distance between each property and the nearest school has to be calculated.
One way to find the distance between two points is to find the coordinates of these
two points first (longitude and latitude) and then calculate the distance between
them. This work adopted the latter approach and used the following coordinates:
1- Coordinates of each housing property were found using a Geocoding
Service offered by Google. A python script was used to communicate
with the geocoding server through an API, then uses a dataset that has
all the addresses scraped from daft as input and returns three features as
an output which are: Longitude, Latitude and Postcode along with the
initial addresses.
2- Coordinates of each school that are present in the dataset that were
downloaded from www.cso.ie in a structured form where no additional
processing was needed.
Using the two sets of coordinates above (1 and 2) and the following (R) algorithm:
distancegeohashing on longitudes and latitudes. In total 131 different groups or geohashes
were created and used in the model to refer to areas in Dublin (see Figure 3 below):
Figure 3: Screenshot 3
Neural Networks cannot deal with text as inputs which means the geohash feature
has to be changed to become a numerical one. For this reason, this feature was
transformed into 131 dummy features (with values 1 or 0) using pandas package in
python. This transformation has given the model a great performance boost which
is going to be discussed thoroughly in the results section. The dummy features are
shown in (Figure 4):
Figure 4: Screenshot 4
One proven important step in processing the data was standardising the values
present in all features. Standardising data means rescaling values to be in between
-1 and +1. Features present in the input dataset had large differences in values
like in the case of number of bedrooms and distance to schools. The number of
bedrooms/bathrooms is only between 1 and 10 while the distance to nearest school
is in thousands of meters.
In addition to 131 dummy features created by geohashing, the main dataset to be
used with the predicting model now has the following features:
1- Address of each property, scraped from daft.ie and cleaned
2- Year of sale, scraped from daft.ie
3- Number of bedrooms, scraped from daft.ie
4- Number of bathrooms, scraped from daft.ie
5- Longitude, geocoded by Google Services
6- Latitude, geocoded by Google Services
7- Price, which is the dependent feature that the model will predict-(scraped from
daft.ie)
8- Distance to nearest school - the creation of this feature is illustrated in the dia-
gram above
9- Distance to nearest Luas station - the same approach as finding distance to
schools
94.2 Implementation
Linux machine with 8 V-CPUs was created on OpenStack cloud to tackle the heavy pro-
cessing load, as neural networks need a long time to be trained. Python was used to
scrape the data from daft.ie and train the neural network while R was used to find dis-
tances between coordinates which will be discussed in later sections. The training time
using the Linux machine was 4,150 seconds (1.15 hours) for 2,000 epochs. Increasing
the number of hidden layers to more than two, caused the model to diverge producing
NA as results for R squared. Also, after each epoch, an R squared result is produced.
The algorithm built by this work used k-fold cross fold validation (k=10), and returned
the average of R squared over the 10 runs. The following code snippet highlights the
[averaging process:
scores = cross val score(neural network, predictors, target, cv=10)
avg score = np.mean(scores)
Neural Network Architecture:
a- Final Model: The main dataset comprises 145 features with numerical values. It
was fed to the model to train a feed-forward back propagation ANN (Hagan and Men-
haj, 1994) using a sigmoid training function that updates the weights and bias values
according to Stochastic Gradient Decent (SGD) optimization. SGD was adopted after
producing the best results (highest R squared) compared to other optimizers tested with
this work like Adam and Gradient Descent. The ANN built has one input layer with 145
nodes which is equal to the number of features in the input dataset, one output with only
one node which matches the number of outcomes that the model is trying to predict (one
in this case, price) and one hidden layer that has 73 nodes. The learning rate is 0.01 and
was decided after testing other rates (0.1,1) which failed to produce good results. Also,
one important parameter had to be set which the number of epochs. This model set the
number of epochs to be 300 as testing showed that a higher number caused the model
to over fit. Number of batches is set to 100 which means 100 rows will be passed to the
model at a time to be processed.
b- Training Process: At the start of the training process, the first result of R squared
was negative, which meant the model was not performing well (it is not better than a
model that always predicts the mean). To improve the performance of the model, two
major data transformations were performed on the main dataset that help boosting the
value of R square:
• Data in the main dataset was standardised: rescaling the main dataset between -1
and +1 created the biggest boost to the system and drove R squared to +0.33
• One-Hot Encoding: the geohash feature was encoded and 131 dummy features were
created and added to the main dataset. This move has lifted R squared to 0.60 on
the training set and 0.58 on the validation set.
105 Evaluation
5.1 Results
Evalutation: 1-Results: The two models built returned the following results:
• Final Model with no distance to school feature: as presented in the screenshot below
(Figure 5), the coefficient of determination, which is the value of R squared (amount
of variation in the main training dataset explained by this model) is around 60/100.
While on the validation set, this value was around 58/100. The mean square error
was around 0.37. It is worth mentioning higher results were achieved on the training
dataset (R squared reached 66/100) but the model showed signs of overfitting as R
squared was around 46/100 on the validation set.
Figure 5: Screenshot 5
• Final model including distance to school feature: also presented on the screenshot
below (Figure 6), R squared scored the same number as above which is around
60/100 while it scored around 1/100 lower on the validation set.
Figure 6: Screenshot 6
Data transformations during the training phase and their direct impact on the per-
formance of the model can be summarised in the table below:
Action Results-Training Results-Validation Loss-MSE
Processed Data Only R squared = - 2.2(negative) R squared = - 2.7 10725
Standardizing Data+distance to luas R squared = 0.33 R squared = 0.26 0.56
One Hot Encoding R squared = 0.6035 R squared = 0.5847 0.3590
Adding distance to school R squared = 0.6019 R squared = 0.5728 0.3675
Overfitting-increasing layers R squared = 0.661 R = 0.462 0.568
11Running the model for the first time with processed data resulted in a negative R squared
(= - 2.2). Standardising the data and including distance to the nearest Luas stop in-
creased R squared to 0.33. Another significant increase in R squared was seen after
the longitude and latitude coordinates were geohashed and One-Hot encoded where R
squared jumped to 0.6019. Lastly, increasing the number of hidden layers to more than
two, has caused overfitting which was evident in the value that dropped significantly on
the validation dataset (R squared = 0.462).
The similarity in performance between two models have given this work a reason to
perform further investigation into the effect of nearest schools on their performance. The
majority of schools in Ireland are not mixed gender. To cover schools with all genders,
this work included another two nearby schools to the model. The R algorithm that found
distance to the nearest school (section 4.1, d) was altered to return the smallest three dis-
tances instead of only one. The main dataset has now three colums, distance to school 1,
distance to school 2 and distance to school 3 which are the distances to three nearest
schools. The two models were run again, and the results are shown in the screenshot
below (Figure 7). These results will be discussed in section 5.2.
Figure 7: Model with Distances to the nearest Three schools
5.2 Discussion
The training phase of the two ANN models has seen many turning points that were
presented in the table above and are summarized as follows:
• The performance improved as data in the main dataset was transformed in a way
that suits the Neural Networks. Standardising data and adding distance to Luas
boosted the value of R squared to 0.33. Also, One-Hot encoding and creating
dummy features had a significant effect on the performance of the model where
the geohash feature which was turned into 131 dummy features, was proven very
important as the performance of the two models saw a big improvement when these
dummy features were added (R squared jumped to 0.6). An understandable increase
considering geohash was a locational feature gotten from longitude and latitude and
locations play an important role in deciding the price of a property. Naturally, some
areas in Dublin are more expensive than others and these differences are shown in
the Tableau map below (Figure 8).
12Figure 8: Prices of Housing Properties in Dublin
• Adding distance to school has seen drop of 1% in R squared value. This drop
is insignificant as the results of ANN could oscillate around a certain value each
time the model is run because ANN assigns the initial weights in a random way
every time the model is run which means the performances of the two models are
considered similar. Having R squared value around 60% for both models suggests
that the two models are able to detect strong relationship between different features
in the datasets used.
• When distances to the three nearest schools were added to the model, R squared
scored 0.531 on the validation set. It is also worth mentioning that increasing the
number of layers to more than two caused the model to overfit which was evident
in the last result presented in the table above when R squared value was 0.66 on
the training set while it was only 0.462 on the validation set.
From what preceded it can be concluded that the distance to school feature has contrib-
uted positively to the model but it was not able to drive up the performance. Some of
the reasons that could have contributed to this fact are:
1- Shortage in housing units in Dublin and the disproportionate ratio of demand over
supply could be the reason distance to schools is not a first priority for home buyers.
2- Only primary schools were taken into consideration in this research. Secondary schools
were not included which might have affected the overall outcome.
3- The number of rows used could have been small for ANN. ANN performs best when
used against dataset that have large number of rows and wide spectrum of features. As
mentioned earlier, this work has lost around 70% of the data for missing values.
4- This research included the whole city of Dublin as one region. (Figure 9) below shows
local areas around Dublin where a cluster of schools is seen. This observation could mean
that a more localised study of the suburbs of Dublin would reveal more insights about
the relations between housing prices and distance to schools.
13Figure 9: Primay Schools in Dublin
The Tableau map shown above (Figure 9) reveals the presence of clusters of primary
schools around certain areas in Dublin. Schools are represented with coloured dots on
the map.
6 Conclusion and Future Work
A thorough analysis of the results of R squared produced by the two models over 10-fold
cross validation methods, show that the two of them have performed well on the main
dataset. R squared was around 60/100 for both models, which is an indication that both
models could find strong relationships among features within the datasets used (the only
difference in the datasets of the two models is including/excluding the distance to school
feature). This also proves that the distance to school feature has contributed to the
model in a positive manner but this contribution was not strong enough to drive up the
performance of the model.
Future work should take into consideration the recommendations cited in the discus-
sion section like sourcing more data, including secondary schools instead of having only
primary and localising the areas of research instead of taking Dublin as a whole. This
work can be considered as a stepping stone towards building a strong model that can
predict housing prices where property websites like daft.ie could integrate it into their
website so buyers can check the prices of properties advertised by themselves, cutting out
the fees of auctioneers.
References
Abdulai, R. T. and Owusu-Ansah, A. (2011). House Price Determinants in Liverpool,
United Kingdom, Current Politics & Economics of Europe 22(1): 1–26.
URL: http://search.ebscohost.com/login.aspx?direct=true&db=bth&AN=59360722&site=ehost-
live
14Bin, O. (2004). A prediction comparison of housing sales prices by parametric versus
semi-parametric regressions, Journal of Housing Economics .
Brown, J. N. and Rosen, H. S. (1982). On the Estimation of Structural Hedonic Price
Models.
URL: http://www.jstor.org/stable/1912614?origin=crossref
Chen, C. L. P. and Zhang, C.-y. (2014). Data-intensive applications , challenges , tech-
niques and technologies : A survey on Big Data, Information Sciences 275: 314–347.
URL: http://dx.doi.org/10.1016/j.ins.2014.01.015
Chiarazzo, V., Caggiani, L., Marinelli, M. and Ottomanelli, M. (2014). A neural network
based model for real estate price estimation considering environmental quality of prop-
erty location, Transportation Research Procedia 3(July): 810–817.
URL: http://dx.doi.org/10.1016/j.trpro.2014.10.067
Elman, J. L. (1990). Finding structure in time, Cognitive Science .
Kahveci, M. and Sabaj, E. (2017). Determinant of Housing Rents in Urban Albania:
an Empirical Hedonic Price Application With Nsa Survey Data, Eurasian Journal of
Economics and Finance 5(2): 51–65.
URL: http://eurasianpublications.com/Eurasian-Journal-of-Economics-and-
Finance/Vol.-5-No.2-2017/EJEF-4.pdf
Kohonen, T. (1982). Self-organized formation of topologically correct feature maps, Bio-
logical Cybernetics .
Kohonen, T. (1988). An introduction to neural computing, Neural Networks 1(1): 3–16.
Kuan, H., Aytekin, O. and Özdemir, I. (2010). The use of fuzzy logic in predicting house
selling price, Expert Systems with Applications 37(3): 1808–1813.
Moody, J. and Darken, C. J. (1989). Fast Learning in Networks of Locally-Tuned Pro-
cessing Units, Neural Computation .
Mukhlishin, M. F., Saputra, R. and Wibowo, A. (2017). Predicting House Sale Price
Using Fuzzy Logic , Artificial Neural Network and K-Nearest Neighbor, (1): 171–176.
Osland, L. (2010). An Application of Spatial Econometrics in Relation to Hedonic House
Price Modeling, Journal of Real Estate Research 32(3): 289–320.
URL: http://ares.metapress.com/index/D4713V80614728X1.pdf
Park, B. and Kwon Bae, J. (2015). Using machine learning algorithms for housing price
prediction: The case of Fairfax County, Virginia housing data, Expert Systems with
Applications 42(6): 2928–2934.
URL: http://dx.doi.org/10.1016/j.eswa.2014.11.040
Rabiega, W. A., Lin, T.-W. and Robinson, L. M. (1984). The Property Value Impacts
of Public Housing Projects in Low and Moderate Density Residential Neighborhoods,
Land Economics 60(2): 174.
URL: http://www.jstor.org/stable/3145971?origin=crossref
Wu, C., Ye, X., Ren, F., Wan, Y., Ning, P. and Du, Q. (2016). Spatial and social media
data analytics of housing prices in Shenzhen, China, PLoS ONE 11(10): 1–20.
15You can also read