Ensemble Methods for Object Detection - Ecai 2020
←
→
Page content transcription
If your browser does not render page correctly, please read the page content below
24th European Conference on Artificial Intelligence - ECAI 2020
                                                          Santiago de Compostela, Spain

                        Ensemble Methods for Object Detection
                                            Ángela Casado-Garcı́a and Jónathan Heras1

Abstract. Object detection is one of the most important topics                 In this paper, we tackle the aforementioned challenges by design-
of computer vision since it has many applications in several fields.        ing a generic method that serves to ensemble the output produced by
Object detection models can be improved thanks to ensemble tech-            detection algorithms; that is, bounding boxes which indicate the po-
niques; however, the process of ensembling object detectors poses           sition and category of the objects contained in an image. The method
several challenges. In this paper, we present an ensemble algorithm         can be employed with any detection model independently of its un-
that can be applied with any object detection model independently of        derlying algorithm and the framework employed to construct it. In
the underlying algorithm. In addition, our ensemble method has been         particular, the contributions of this work are the following:
employed to define a test-time augmentation procedure for object de-
tection models. Our ensemble algorithm and test-time augmentation           • We present a general method for ensembling object detectors inde-
procedure can be used to apply data and model distillation for ob-            pendently of the underlying algorithm; and, in addition, we devise
ject detection, two semi-supervised learning techniques that reduce           several voting strategies to carry out the ensembling process.
the number of necessary annotated images to train a model. We have          • As a by-product of our ensemble method, we define a test-time
tested our methods with several datasets and algorithms, obtaining            augmentation procedure that can be applied to boost the accuracy
up to a 10% improvement from the base models. All the methods are             of object detection models. Moreover, we explain how to reduce
implemented in an open-source library.                                        the burden of annotating images in the context of object detection
                                                                              using two semi-supervised learning techniques, based on ensem-
                                                                              ble methods, known as model and data distillation.
1     INTRODUCTION                                                          • We conduct a comprehensive study of the impact of our ensemble
                                                                              method and the devised voting strategies, and show the benefits of
Object detection is a fundamental task in computer vision since it            this method as well as the advantages of using test-time augmen-
is a key step in many real-world applications such as security [2],           tation and distillation methods.
satellite imagery [12] or healthcare [35]. Over the last few years,         • We implement our methods in the EnsembleObjectDetec-
a lot of progress has been made in this field thanks to the use of            tion library, available at https://github.com/ancasag/
deep convolutional neural networks [51], and deep detectors have              ensembleObjectDetection. This open-source library can
achieved impressive results in large detection datasets such as Pascal        be extended to work with any object detection model indepen-
VOC [13] and MS COCO [28]. In addition, as in many other machine              dently of the algorithm and framework employed to construct it.
learning tasks, the accuracy and robustness of object detectors can be
greatly improved thanks to the application of ensemble methods [50];           The rest of the paper is organised as follows. In the next section,
for instance, the mmAP in the COCO dataset was improved from                we provide the necessary background to understand the rest of the
50.6 to 52.5 in [33], or the mAP in the Pascal VOC dataset increased        paper. Subsequently, our approach to ensemble object detection algo-
by 3.2% in [37]. In fact, the leading methods on datasets like Pascal       rithms, and the extension of such an approach for test-time augmen-
VOC or MS COCO are based on the usage of ensembles [18, 20, 33].            tation, and data and model distillation are presented in Section 3. In
   However, the process of ensembling object detectors poses several        addition, and also in Section 3, we present the main highlights of the
challenges. First of all, some ensemble approaches for object detec-        library that implements our methods. After that, an analysis of the
tion depend on the nature of the detection models — for example, the        impact of our methods on different datasets is provided in Section 4.
procedure to ensemble models explained in [18] can only be applied          The paper ends with a section of conclusions and further work.
to models based on the FasterRCNN algorithm — therefore, these
methods cannot be generalised and lack the diversity provided by
the ensemble of different algorithms. Related to the previous point,        2     BACKGROUND
those ensemble methods require the modification of the underlying
                                                                            In this section, we briefly provide the necessary background and no-
algorithms employed to construct the models, and this might be chal-
                                                                            tation needed to understand the rest of the paper. We start by formally
lenging for many users. In order to deal with this problem, there are
                                                                            presenting the task of object detection.
ensemble methods that work with the output of the models [44, 48];
but, again, they are focused on concrete models, and only work if
the models are constructed using the same framework. Finally, it            2.1    Object detection
does not exist an open-source library that provides general ensem-
ble methods for object detection, and this hinders their use.               Object detection is the task of determining the position and category
                                                                            of multiple objects in an image. Formally, an object detection model
1   Department of Mathematics and Computer Science, Universidad de La Ri-   can be seen as a function that given an image I returns a list of detec-
    oja, Spain, email: {angela.casado,jonathan.heras}@unirioja.es           tions D = [d1 , . . . , dN ] where each di is given by a triple [bi , ci , si ]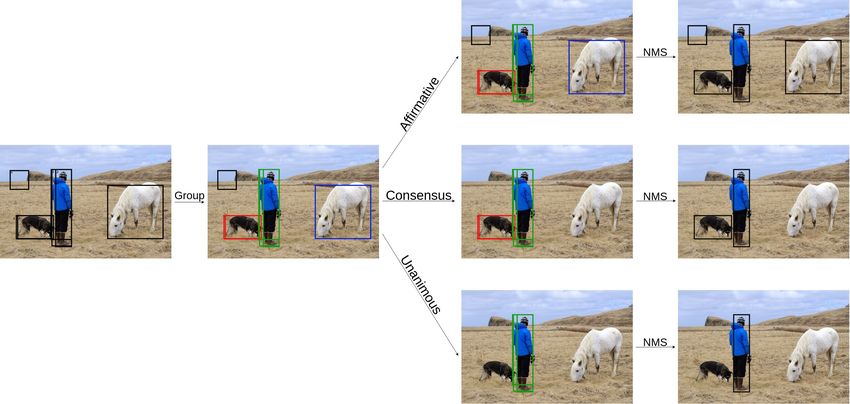
24th European Conference on Artificial Intelligence - ECAI 2020
                                                        Santiago de Compostela, Spain

that consists of a bounding box, bi , the corresponding category, ci ,        Due to the cost of collecting data in the context of object detec-
and the corresponding confidence score, si .                               tion, data augmentation strategies such as random scaling [37] or
   Currently, the most successful object detection models are based        cropping [30] are widely employed [54]. On the contrary, and due
on deep learning algorithms, and they can be split into two groups:        to the lack of a general method to combine predictions of object de-
one-stage and two-stage detectors. The former divide the image into        tectors, test-time augmentation has been mainly applied in the con-
regions that are passed into a convolutional neural network to obtain      text of image classification [43]. As far as we are aware, test-time
the list of detections — these algorithms include techniques such as       augmentation has only been applied for object detectors in [49], and
SSD [30] or YOLO [38]. The two-stage object detectors employ re-           only using colour transformations. This limitation is due to the fact
gion proposal methods, based on features of the image, to obtain in-       that some transformations, like flips or rotations, change the posi-
teresting regions, that are later classified to obtain the predictions —   tion of the objects in the image and this issue must be taken into
among these algorithms, we can find the R-CNN family of object de-         account when combining the predictions. The method presented in
tectors [39] or Feature Pyramid Network (FPN) [29]. Independently          Section 3.2 deals with this problem and allows us to apply test-time
of the underlying algorithm, the accuracy of these detection models        augmentation with any object detection model.
can be improved thanks to the application of ensemble methods.
                                                                           3     METHODS
2.2    Ensemble learning                                                   In this section, we explain our ensemble algorithm for combining the
                                                                           output of object detection models. Such an algorithm can be particu-
Ensemble methods combine the predictions produced by multiple
                                                                           larised with different strategies that are also explained in this section.
models to obtain a final output [50]. These methods have been suc-
                                                                           Moreover, we explain how our algorithm can be applied for test-time
cessfully employed for improving accuracy in several machine learn-
                                                                           augmentation, and data and model distillation. This section ends by
ing tasks, and object detection is not an exception. We can distinguish
                                                                           highlighting the main features of the library where we have imple-
two kinds of ensembling techniques for object detection: those that
                                                                           mented our methods.
are based on the nature of the algorithms employed to construct the
detection models, and those that work with the output of the models.
   In the case of ensemble methods based on the nature of the al-          3.1     Ensemble of object detectors
gorithms, different strategies have been mainly applied to two-stage
                                                                           We start by explaining the procedure that we have designed to com-
detectors. Some works have been focused on ensembling features
                                                                           bine object detections obtained from several sources. The input of
from different sources before feeding them to the region proposal
                                                                           our ensemble algorithm is a list LD = [D1 , . . . , Dm ] where each
algorithm [25, 33], others apply an ensemble in the classification
                                                                           Di , with i ∈ {1 . . . m}, is a list of detections for a given image I
stage [17, 7], and others employ ensembles in both stages of the algo-
                                                                           as explained in Section 2.1. Usually, each Di comes from the pre-
rithm [18, 20, 24]. In the case of ensemble methods based on the out-
                                                                           dictions of a detection model; but, as we will see in Section 3.2, this
put of the models, the common approach consists in using a primary
                                                                           is not always the case. In general, each list Di is a list of detections
model which predictions are adjusted with a secondary model. This
                                                                           produced using a particular method Mi for a given image.
procedure has been applied in [48] by combining Fast-RCNN and
                                                                              Given the list LD, our ensemble algorithm consists of four steps.
Faster-RCNN models, in [37] by combining Fast-RCNN and YOLO
                                                                           First of all, the list LD is flattened in a list F = [d1 , . . . , dk ], since
models, and in [44] by using RetinaNet and Mask R-CNN mod-
                                                                           the provenance of each detection di is not relevant for the ensembling
els. Another approach to combine the output of detection models is
                                                                           algorithm. Subsequently, the elements di of F are grouped together
the application of techniques to eliminate redundant bounding boxes
                                                                           based on the overlapping of their bounding boxes and their classes.
like Non-Maximum Suppression [19], Soft-NMS [4], NMW [52], fu-
                                                                           In order to determinate the overlap of bounding boxes, the IoU met-
sion [49] or WBF [45]. However, these techniques do not take into
                                                                           ric [40] is employed. Considering two bounding boxes b1 and b2 , the
account the classes of the detected objects, or the number of models
                                                                           IoU formula for finding the overlapped region between them is given
that detected a particular object; and, therefore, if they are blindly
                                                                           by
applied, they tend to produce lots of false positives.
   In our work, we propose a general method for ensembling the out-                                                area(b1 ∩ b2 )
put of detection models using different voting strategies, see Sec-                             IoU (b1 , b2 ) =
                                                                                                                   area(b1 ∪ b2 )
tion 3.1. The method is independent of the underlying algorithms
and frameworks, and allows us to easily combine a variety of multi-           This measure is employed to group the elements of F produc-
ple detection models. In addition, our method opens the door to apply      ing as a result a list G = [D1G , . . . , Dm  G
                                                                                                                            ] where each DiG is a list
                                                                                                             ¯
                                                                           of detections such that for all d(=                    ˆ
                                                                                                                   [b̄, c̄, s̄]), d(= [b̂, ĉ, ŝ]) ∈ DiG ,
techniques based on ensembles such as test-time augmentation.
                                                                           IoU (b̄, b̂) > 0.5, and c̄ = ĉ. At this point, each DiG ∈ G is fo-
                                                                           cused on a particular region of the image, and the size of DiG will
2.3    Test-time augmentation                                              determine whether our algorithm considers whether such a region
                                                                           actually contains an object. Namely, this decision can be taken using
Data augmentation [42, 41] is a technique widely employed to train         three different voting strategies:
deep learning models that consists in generating new training sam-
ples from the original training dataset by applying transformations        • Affirmative. In this strategy, all the lists DiG are kept. This means
that do not alter the class of the data. There is a variant of data aug-     that whenever one of the methods that produce the initial predic-
mentation for the test dataset known as test-time augmentation [43].         tions says that a region contains an object, such a detection is con-
This technique creates random modifications of the test images, per-         sidered as valid.
forms predictions on them, and, finally, returns an ensemble of those      • Consensus. In this case, only the lists DiG which length is greater
predictions.                                                                 than m/2 (where m is the size of the initial list LD) are kept.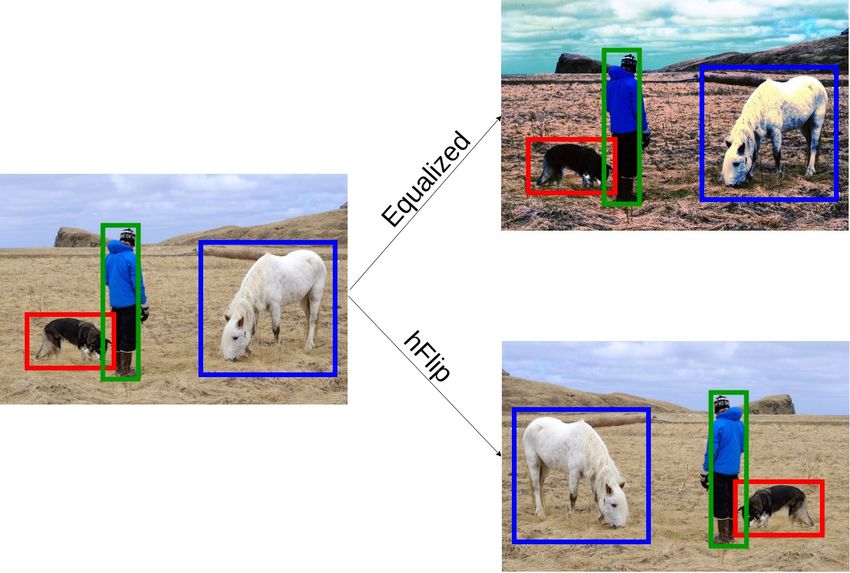
24th European Conference on Artificial Intelligence - ECAI 2020
Santiago de Compostela, Spain
This means that the majority of the initial methods must agree to 3.2 Test-time augmentation for object detectors
consider that a region contains an object. The consensus strategy
is analogous to the majority voting strategy commonly applied in Test-time augmentation (TTA) in the context of image classification
ensemble methods for images classification [3]. is as simple as applying multiple transformations to an image (for
• Unanimous. In the last strategy, only the lists DiG which length is example, flips, rotations, colour transformations, and so on), making
equal to m are kept. This means that all the methods must agree predictions for each of them using a particular model, and finally
to consider that a region contains an object. returning the ensemble of those predictions [43]. On the contrary, in
the context of object detection, TTA is not as straightforward due
to the fact that there are some transformations, like flips or crops,
that alter the position of the objects. This explain why the works that
After applying one of the aforementioned strategies, we end up
0 apply TTA for object detection only apply colour operations [49] —
with a list G0 ⊆ G. Since each list DkG ∈ G0 might contain sev- since those transformations do not alter the position of the objects in
eral detections for the same region, the last step of our algorithm is the image. This limitation of the TTA method is faced in this section
the application of the non-maximum suppression (NMs) algorithm to taking as basis the ensemble algorithm presented previously.
0
each DkG . The final result is a list D = [d1 , . . . , dn ] with the ensem- First of all, we define the notion of detection transformation.
ble detections. Our ensemble algorithm is summarised graphically in Given an image I and a list of detections for I, D, a detection trans-
Figure 1. formation is an operation that returns a transformed image I t and a
list of detections Dt such that the size of Dt is the same of D, and
all the objects detected by D in I are detected by Dt in I t .
Example 3.1. Given an image I of size (WI , HI ) where WI and
HI are respectively the width and height of I, and a list of detections
D = [d1 , . . . , dn ] such that for each di = [bi , ci , si ] and bi is given
by (xi , yi , wi , hi ) where (xi , yi ) is the position of the top-left corner
of bi , and wi and hi are respectively the width and height of bi ; then,
the horizontal flip detection transformation applies an horizontal flip
to the image I, and returns it together with the list Dt = [dt1 , . . . , dtn ]
where dti = [(WI − xi , yi , wi , hi ), ci , si ]. Another example is the
equalisation transformation that applies the histogram equalisation to
0
the image I and returns it together with Dt = D. These examples
Figure 1. Example of the workflow of our ensemble algorithm. Three meth- are depicted in Figure 2.
ods have been applied to detect the objects in the original image: the first
method has detected the person and the horse; the second, the person and the
dog; and, the third, the person, the dog, and an undefined region. The first step
of our ensemble method groups the overlapping regions. Subsequently, a vot-
ing strategy is applied to discard some of those groups. The final predictions
are obtained using the NMs algorithm.
From a theoretical point of view, the affirmative strategy reduces
the number of objects that are not detected (false negatives) — some
objects that are not detected with a concrete approach might be de-
tected by the others — but increases the number of incorrect detec-
tions (false positives) — this is due to the fact that the false posi-
tives obtained with each approach are accumulated. The unanimous
Figure 2. Example of horizontal flip detection transformation and equalisa-
strategy has the opposite effect, it reduces the number of false posi-
tion transformation
tives but increases the number of false negatives — since all the ap-
proaches that generated the initial detections must agree to detect an
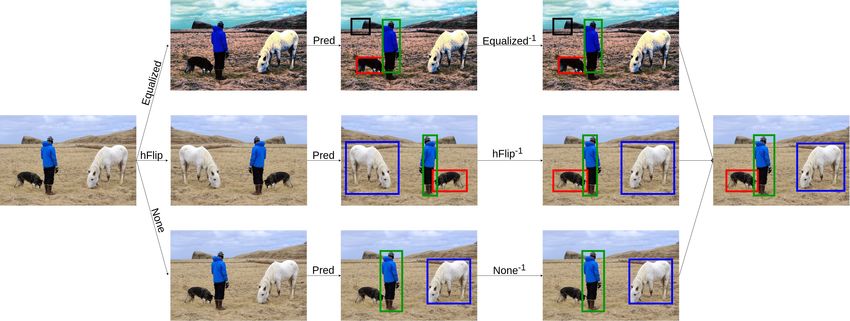
object. In general, the consensus strategy provides a better trade-off, Now, we can define the following procedure to apply TTA for ob-
and, therefore, at first glance, the affirmative and unanimous strate- ject detection. Given an image I, an object detection model M , and
gies might seem too lose and too restrictive to be useful. However, a list of image transformations T1 , . . . , Tn , we proceed as follows.
as we will show in Section 4, they can produce better results than First of all, we apply each image transformation Ti to I, obtaining as
the consensus approach depending on the performance of the detec- a result new images I1 , . . . , In . Subsequently, we detect the objects
tion models (for instance, if the detection models produce few false in each Ii using the model M , and produce the lists of detections
positives, but lots of false negatives, the affirmative strategy might be D1 , . . . , Dn . For each, (Ii , Di ), we apply a detection transforma-
more useful than the other two strategies). tion that returns a list of detections Dit in the correct position for the
As we explained at the beginning of this section, the most natural original image I. Finally, we ensemble the predictions using the pro-
way of producing the input of our ensemble algorithm is by using the cedure presented in the previous section using one of the three voting
predictions that are outputted by several object detection models. In strategies. An example of this procedure is detailled in Figure 3.
addition, there are other ways, for instance, combining the detections The ensemble of models and TTA can be employed to improve the
of a model for multiple transformations of an image, this is known accuracy of object detectors, see Section 4. In addition, they are the
as test-time augmentation. basis of two semi-supervised learning techniques that tackle one of24th European Conference on Artificial Intelligence - ECAI 2020
Santiago de Compostela, Spain
with any framework and underlying algorithm. To this aim, we have
defined an abstract class called IPredictor with a predict
method that takes as input a folder of images, and produces as a result
XML files in the Pascal VOC format containing the predictions for
each image of the input folder. Then, for each detection framework
or library that we want to include in the EnsembleObjectDetection
library, we have to provide a class that extends the IPredictor
class and implements the predict method. Using the output pro-
duced by the predict method, the user can apply ensembling and
TTA with any detection model.
Currently, the EnsembleObjectDetection library supports models
Figure 3. Example of the workflow of TTA for object detectors. First, we
trained using the Darknet [36] and MxNet [10] frameworks, and sev-
apply three transformations to the original image: a histogram equalisation, a
eral Keras libraries [1, 27]. The procedure to extend the library with
horizontal flip, and a none transformation (that does not modify the image).
models from other libraries is explained in the project webpage.
Subsequently, we detect the objects in the new images, and apply the corre-
sponding detection transformation to locate the objects in the correct position
for the original image. Finally, the detections are ensembled using the con- 4 RESULTS
sensus strategy.
In this section, we conduct a thorough study of the ensemble methods
the main problems faced when training object detection models: the presented in the previous section by using three different datasets.
annotation of images.
4.1 Pascal VOC
3.3 Data and model distillation In the first case study, we use the Pascal VOC dataset [14], a popular
Deep learning methods are data demanding, and acquiring and an- project designed to create and evaluate algorithms for image classi-
notating the necessary amount of images for constructing object de- fication, object detection and segmentation. This dataset consists of
tection models is a tedious and time-consuming process that might natural images containing objects of 20 categories; and, the metric
require specialised knowledge [23]. This has lead to the development to evaluate the performance of detection models in this dataset is the
of semi-supervised learning techniques [53], a suite of methods that mean average precision (mAP) over each category [40].
use unlabelled data to improve the performance of models trained For our experiments with the Pascal VOC dataset, we have em-
with small dataset of annotated images. Self-training [53] is a par- ployed 5 models pre-trained for this dataset using the MxNet li-
ticular case of semi-supervised learning where the model predictions brary [10]; namely, a Faster R-CNN model, two YOLO models (one
are employed as ground truth to train a new model. However, training using the darknet backbone and another one using the mobilenet
a model on its own predictions does not usually provide any benefit; backbone) and two SSD models (one using the Resnet backbone and
and this has lead to the development of techniques like data distilla- the other using the mobilenet backbone). The performance of these
tion and model distillation. models on the Pascal VOC test set is given in the first five rows of
Data distillation [34] applies a trained model on manually labelled Table 1. As can be seen in such a table, the best model is the YOLO
data to multiple transformations of unlabelled data, ensembles the model using the darknet backbone with a mAP of 69.78%. Such a
multiple predictions, and, finally, retrains the model on the union of mAP can be greatly improved using model ensembling and TTA.
manually and automatically labelled data. Similarly, model distilla- For model ensembling, we conduct an ablation study by consider-
tion [5] obtains multiple predictions of unlabelled data using several ing the ensemble of the five models, the ensemble of the three models
models, ensembles the result, and retrains the models with the com- with the best mAP (that are Faster R-CNN, YOLO with the darknet
bination of manually and automatically annotated data. Both tech- backbone, and SSD with the Resnet backdone), and the three models
niques can also be combined as shown in [21]. with the worst mAP (that are YOLO with the mobilenet backbone
Even if data distillation was applied to object detection in [34], and the two SSD models). The results for such an ablation study are
these method have not been widely employed in the context of object provided in the last 9 rows of Table 1. In those results, we can no-
detection due to the lack of a library for ensembling predictions of tice that all the ensembles conducted with the affirmative strategy
detection models. This problem is overcome thanks to the techniques obtain better results than the individual models — the best result is
and the library developed in our work, and, as we show in Section 4, obtained by ensembling the three best models (mAP of 77.50%, al-
different ensembling schemes to the one proposed in [34] might have most an 8% better than the best individual model). On the contrary,
a better impact on the distillation methods. the unanimous strategy produces worse results than the individual
models; and the consensus strategy only achieves a better mAP when
the three best models are combined. These results are due to the fact
3.4 Design of the library
that the individual models produce few false positives, and some ob-
The techniques presented throughout this section have been imple- jects that are detected by one of the models are missed by the others.
mented as an open-source library called EnsembleObjectDetection. Therefore, the affirmative strategy helps to greatly reduce the number
This library has been implemented in Python and relies on several of false negatives but without considerably increasing the number of
third-party libraries like Numpy [32], OpenCV [31], or CLoDSA [8] false positives; on the contrary, the unanimous strategy is too restric-
(the last one provides the functionality to implement the image and tive and increases the number of false negatives. Something similar
detection transformations of the TTA procedure). happens with the consensus strategy. If we focus on the results for
As we have previously mentioned, the EnsembleObjectDetection each particular category, we can notice an improvement of up to a
library has been designed to be applicable to models constructed 10% with respect to the results obtained by the best individual model.24th European Conference on Artificial Intelligence - ECAI 2020
Santiago de Compostela, Spain
Datasets mAP areo bike bird boat bottle bus car cat chair cow table dog horse mbike person plant sheep sofa train tv
Faster R-CNN 0.69 0.70 0.77 0.71 0.64 0.50 0.78 0.78 0.80 0.45 0.74 0.58 0.79 0.80 0.79 0.70 0.42 0.75 0.67 0.77 0.67
SSD mobilenet 0.62 0.59 0.70 0.61 0.51 0.33 0.68 0.71 0.78 0.43 0.57 0.61 0.69 0.79 0.71 0.61 0.36 0.59 0.60 0.77 0.67
SSD resnet 0.64 0.62 0.80 0.70 0.57 0.42 0.78 0.79 0.88 0.50 0.73 0.63 0.78 0.80 0.80 0.70 0.39 0.69 0.65 0.79 0.69
YOLO darknet 0.69 0.80 0.72 0.70 0.57 0.60 0.80 0.80 0.81 0.43 0.75 0.63 0.78 0.81 0.71 0.70 0.39 0.71 0.65 0.79 0.70
YOLO mobilenet 0.59 0.62 0.71 0.52 0.49 0.43 0.70 0.71 0.70 0.36 0.66 0.47 0.68 0.71 0.62 0.61 0.24 0.60 0.55 0.70 0.61
All affirmative 0.77 0.79 0.80 0.79 0.72 0.64 0.87 0.86 0.88 0.55 0.83 0.68 0.87 0.87 0.80 0.78 0.51 0.79 0.75 0.78 0.76
All consensus 0.68 0.71 0.72 0.71 0.60 0.44 0.79 0.80 0.80 0.45 0.76 0.63 0.80 0.81 0.71 0.70 0.39 0.71 0.65 0.78 0.62
All unanimous 0.51 0.54 0.63 0.45 0.35 0.27 0.62 0.63 0.63 0.32 0.53 0.42 0.63 0.63 0.63 0.53 0.17 0.54 0.51 0.62 0.54
Three best affirmative 0.77 0.79 0.80 0.79 0.71 0.64 0.86 0.87 0.89 0.55 0.83 0.69 0.87 0.88 0.80 0.78 0.51 0.79 0.75 0.84 0.76
Three best consensus 0.71 0.71 0.80 0.71 0.60 0.52 0.80 0.80 0.81 0.51 0.76 0.64 0.80 0.81 0.80 0.70 0.47 0.71 0.71 0.78 0.70
Three best unanimous 0.61 0.63 0.72 0.63 0.52 0.35 0.71 0.72 0.81 0.39 0.61 0.57 0.71 0.72 0.72 0.62 0.33 0.62 0.58 0.71 0.62
Three worst affirmative 0.73 0.77 0.79 0.77 0.66 0.56 0.78 0.79 0.80 0.52 0.80 0.62 0.79 0.80 0.80 0.77 0.48 0.76 0.73 0.79 0.74
Three worst consensus 0.66 0.71 0.71 0.62 0.60 0.43 0.70 0.71 0.80 0.44 0.68 0.56 0.71 0.80 0.72 0.70 0.39 0.69 0.64 0.79 0.69
Three worst unanimous 0.52 0.54 0.63 0.54 0.44 0.27 0.62 0.63 0.63 0.32 0.53 0.49 0.63 0.63 0.63 0.53 0.24 0.53 0.50 0.62 0.53
Table 1. Results for the Pascal VOC dataset applying our model ensemble algorithm. The first five rows provide the result for the base models. The next three
rows correspond with the ensemble for the base models. Rows 9 to 11 contain the results of applying the ensemble techniques to the three best base models
(SSD resnet, YOLO darknet and Faster R-CNN); and the last three rows contain the results of ensembling the worst three best models (YOLO mobilenet, SSD
mobilenet and Faster R-CNN). The best results are in bold face.
In addition, we have applied TTA to all the base models to improve pores on a plant leaf that allow the exchange of gases, mainly CO2
their accuracy. Namely, we have applied three kinds of data augmen- and water vapor, between the atmosphere and the plant. Stomata re-
tations: colour transformations (applying gamma and histogram nor- spond to changes in the environment and regulate the photosynthesis
malitation, and keeping the original detection), position transforma- of plants, and thus their productivity [22, 6].
tions (applying a horizontal flip, a rotation of 10º, and keeping the In order to analyse stomata of plant leaves, plant biologists take
original prediction) and the combination of both. Moreover, for each microscopic images of leaves, and manually measure the stom-
augmentation scheme, we have applied the three voting strategies, ata density in those images. This is a tedious, error-prone, time-
see Table 2. As in the case of model ensembling, all the models are consuming and subjective task due to the large number of stom-
improved (the improvement ranges from 0.08% to 5.54%) thanks to ata in each image but, it can be automatised by means of detec-
TTA when using the affirmative strategy; but the most beneficial aug- tion algorithms. In particular, we have constructed a stomata detec-
mentation scheme varies from model to model. For instance, the SSD tion model using the YOLO algorithm implemented in the Darknet
model with the resnet backbone is improved with the three augmen- framework [9]. The YOLO model was trained by using 4,050 stom-
tation schemes; but, the Faster R-CNN model only improves with the ata images, and it was evaluated on a test set of 450 images using the
colour scheme. Regarding the other voting strategies, the unanimous F1-score and the mAP, see the first row of Table 3. As can be seen
strategy always obtains worst results than the original models; and from that table, the number of false positives (FP) is considerably
the consensus strategy only gets better results in some cases. The ex- higher than the number of false negatives (FN), and this will have an
planation for these results is the same provided previously for model impact in the voting strategy to apply. In this section, we show how
ensembling. It is also worth noting that adding more augmentation such a model can be improved thanks to TTA.
techniques does not always improve the ensembling results.
Datasets F1-score TP FP FN mAp
No TTA Colour TTA Position TTA All
TTA Aff. Cons. Una. Aff. Cons. Una. Aff. Cons. Una. Original 0.90 16600 2341 1239 0.84
Faster R-CNN 0.69 0.69 0.69 0.08 0.53 0.53 0.22 0.63 0.61 0.21 Affirmative 0.88 17003 3600 836 0.80
SSD mobilenet 0.62 0.63 0.63 0.09 0.58 0.58 0.52 0.61 0.58 0.47
SSD resnet 0.64 0.70 0.70 0.08 0.65 0.65 0.60 0.68 0.63 0.09 Consensus 0.92 16509 1551 1330 0.84
YOLO darknet 0.69 0.71 0.71 0.09 0.68 0.68 0.63 0.70 0.68 0.57 Unanimous 0.80 12272 589 5567 0.61
YOLO mobilenet 0.59 0.61 0.61 0.10 0.57 0.57 0.50 0.61 0.58 0.44
Colour 0.93 16502 1324 1337 0.85
Table 2. Results for the Pascal VOC dataset applying TTA. In the first col- Flips 0.92 16480 1448 1359 0.85
Rotations 0.91 16463 1999 1376 0.82
umn, we provide the result for the models without applying TTA. The rest of Flips & colour 0.92 16572 1529 1267 0.84
the table is divided into three blocks of three columns (one per each voting Flips & rotations 0.92 16580 1659 1259 0.84
strategy): the first block provides the results with colour transformations, the Rotations & colour 0.92 16556 1633 1283 0.84
second contains the results for position transformations, and, the last block
Table 3. Results of our Yolo model for stomata detection. In the first row,
presents the results combining all the transformations. The best results are in
we provide the results for the original model. In the next three rows, we have
bold face.
applied TTA with 9 transformations using the three voting strategies; and,
in the next six rows, we have applied the TTA method for different kinds of
As a conclusion for this study, we can say that model ensembling transformations and using the consensus strategy. The best results are in bold
is more beneficial than TTA; and, this is due to the fact that the for- face.
mer introduces a higher variability (thanks to the heterogeneity of
models) in the predictions than the latter.
First of all, we have applied TTA by using 9 transformations: three
colour transformations (histogram normalisation, gamma correction
4.2 Stomata detection and Gaussian blurring), three flips (vertical, horizontal and both) and
three rotations (90º, 180º and 270º). Moreover, we have applied the
In the second example, we apply TTA and data distillation to two pro- three voting schemes — the results for these experiments are given in
prietary datasets of stomata images. Stomata (singular “stoma”) are rows 2 to 4 in Table 3. As can be seen in this table, the only strategy24th European Conference on Artificial Intelligence - ECAI 2020
Santiago de Compostela, Spain
that improves the results is the consensus approach, that improves Confidence 0.25 Confidence 0.5
a 2% the F1-score. Note that each strategy has the expected effect, Datasets F1-score mAP F1-score mAP
the affirmative scheme increases the number of FP and decreases the Original 0.85 0.80 0.83 0.79
number of FN; on the contrary, the unanimous strategy has the oppo-
All Aff. 0.84 0.82 0.80 0.82
site effect. Then, the consensus strategy provides the best trade-off by All Cons. 0.86 0.85 0.87 0.85
considerably reducing the number of FP but only slightly increasing All Una. 0.86 0.88 0.88 0.88
the number of FN.
Colour Aff. 0.86 0.86 0.83 0.86
In addition to the above results, we have also inspected the impact Colour Cons. 0.82 0.78 0.77 0.78
of each kind of transformation for this dataset. In particular, we have Colour Una. 0.74 0.77 0.62 0.77
applied TTA using colour transformations, rotation transformations, Flips Aff. 0.83 0.80 0.76 0.78
flip transformations, and their combinations — see the last 6 rows of Flips Cons. 0.04 0.61 0 0.55
Table 3. In this case, we only included the consensus strategy in Ta- Flips Una. 0.01 0.30 0 0.30
ble 3 since the other strategies produced the same effect previously
Table 4. Results of data distillation for the stomata dataset. This table is
explained. As can be seen from those results, the same improvement
divided into two blocks: in the first block (columns 2 and 3), we use a con-
obtained using all the transformation can be achieved by using only
fidence threshold of 0.25; and, in the second block (the last two columns),
some of them — this considerably reduces the tome needed to apply
we use a confidence threshold of 0.5. In the first row of the table, we provide
TTA. In fact, we achieved better results by applying TTA using only
the result for the original model. In the next three rows, we present the results
colour transformations. This indicates that it is necessary to study
of applying data distillation with colour and flip transformations. In rows 5
different combinations of transformations to find the one that pro-
to 7, we include the results of applying data distillation only using colour
duces the best results; and this shows the benefits of having a library
transformations, and the last three rows present the results of applying data
like the one presented in this work.
distillation using flip transformations. The best results are in bold face.
Finally, we have also studied the benefits of data distillation in
the context of stomata detection. It is worth noting that each stom- 238 images), and the TableBank dataset is a big enough dataset (160k
ata image contains approximately 45 stomata, and, hence, annotating images) but it was semi-automatically annotated and contains several
those images is a time-consuming task. Therefore, the application incorrect annotations. Therefore, these two datasets provide the per-
of semi-supervised learning techniques, like data distillation, can re- fect scenario for applying model ensembling and model distillation.
duce the burden of annotating those images. In our data distillation In particular, we have trained different models for the ICDAR2013
experiments, see Table 4, we have employed a dataset of stomata dataset, and have improved them by using our ensemble algorithm,
images from a different variety than the original dataset employed and by applying model distillation using the TableBank dataset.
for the results of Table 3. Such a dataset contains 450 annotated im-
ages for training, 150 annotated images for testing, and 1,620 un- F1@0.6 F1@0.7 F1@0.8 F1@0.9 WAvgF1
labelled images. Using the 450 annotated images, we constructed a Mask R-CNN 0.58 0.52 0.39 0.19 0.39
YOLO model that achieved a F1-score of 0.85 and a mAP of 0.8 SSD 0.85 0.79 0.62 0.26 0.59
when using a confidence threshold of 0.25, and a F1-score of 0.83 YOLO 0.83 0.8 0.69 0.33 0.63
and a mAP of 0.79 when using a confidence threshold of 0.5. Using Affirmative 0.86 0.81 0.69 0.37 0.65
such a model, we have applied data distillation using three schemes: Consensus 0.88 0.84 0.75 0.42 0.69
Unanimous 0.4 0.36 0.28 0.08 0.26
applying colour transformations (gamma correction, histogram, nor-
Mask R-CNN Aff. 0.58 0.54 0.39 0.11 0.37
malisation and Gaussian blurring), applying flips (vertical, horizontal Mask R-CNN Cons. 0.68 0.63 0.49 0.13 0.45
and both), and combining colour and flip transformations. Moreover, Mask R-CNN Una. 0.57 0.48 0.29 0.06 0.32
we have used the three voting schemes, see Table 4. In this case, SSD Aff. 0.77 0.71 0.58 0.24 0.54
the best strategy consists in applying all the transformations together SSD Cons. 0.87 0.8 0.67 0.32 0.63
with the unanimous voting scheme. This improves a 3% the F1-score SSD Una. 0.82 0.74 0.56 0.26 0.56
value, and an 8% the mAP. Note that using the unanimous strategy, YOLO Aff. 0.75 0.71 0.57 0.18 0.52
YOLO Cons. 0.88 0.8 0.67 0.32 0.63
we can increase the threshold to consider a detection as correct since YOLO Una. 0.77 0.69 0.52 0.16 0.50
using such a strategy the new model is trained with images where the
detections have been agreed by the predictions of the 9 transforma- Table 5. Results for the ICDAR2013 dataset applying model ensembling
tions. and model distillation. The first three rows are the results for the base models.
Based on the results obtained for this example, we have shown the The next three rows include the results of applying our ensemble method
benefits of trying different alternatives for TTA; and, in addition, that with the three different voting strategies; and, the next three blocks provide
techniques like data distillation can produce accurate models starting the results of applying model distillation to the three base algorithms. The
from small datasets of images. best results are in bold face.
4.3 Table detection In our experiments, we have split the ICDAR2013 dataset into a
training set of 178 images and a testing set of 60 images. Using the
In the last case study, we analyse the effects of model ensembling training set, we have constructed three models using the YOLO algo-
and model distillation for table detection — an important problem rithm, implemented in Darknet, the SSD algorithm, implemented in
since it is a key step to extract the semantics from tabular data [11]. MxNet, and the Mask RCNN algorithm, implemented in the Keras
To this aim, we have employed the ICDAR2013 dataset [16], and the library [15] — note that we have employed different libraries and al-
Word part of the TableBank dataset [26]. Both datasets have been de- gorithms, but our ensemble library can deal with all of them. These
signed to test table detection algorithms; however, the ICDAR2013 is three models have been evaluated (see the three first rows of Table 5)
too small to directly apply deep learning algorithms (it only contains in the testing set using the W1Avg F1-score [46], a metric that com-24th European Conference on Artificial Intelligence - ECAI 2020
Santiago de Compostela, Spain
putes the weighted sum of the F1-score using different IOU thresh- Several tasks remain as further work. First of all, we want to test
olds ranging from 0.6 to 0.9 — the F1-score at 0.6 is employed to our techniques with other datasets like COCO [28]. Moreover, we
measure the number of tables that are detected, even if the detection would like to test whether techniques like Soft-NMS [4], NMW [52],
bounding boxes are not perfectly adjusted; and, on the contrary, the fusion [49] or WBF [45] produce better results than the NMS algo-
F1-score at 0.9 measures the tables that are detected with a bound- rithm currently employed, or, at least, more fine-grained detections.
ing box perfectly adjusted to them. As can be seen in Table 5, the Another interesting aspect to study is whether our ensembling proce-
best model is obtained using the YOLO algorithm (WAvgF1-score dure can be employed as a defense against adversarial attacks [47].
of 0.63). Finally, both in test-time augmentation and data distillation, it re-
The three models can be improved thanks to model ensembling, mains the question of deciding the image transformations that pro-
and model distillation. First of all, we have ensembled the three mod- duce better results. Currently, this decision is taken by the users that
els using the three voting strategies (see rows 3 to 5 of Table 5), and employ our method, but it would be interesting to study automatic
we have obtained an improvement of 2% using the affirmative strat- methods like the ones presented in [54].
egy, and a 6% using the consensus approach; as we have seen pre-
viously, the unanimous approach is too restrictive and obtains worst
results. ACKNOWLEDGEMENTS
Moreover, we have applied model distillation using the TableBank This work was partially supported by Ministerio de Economı́a y
dataset; applying the three voting strategies, and retraining the three Competitividad [MTM2017-88804-P], Ministerio de Ciencia, Inno-
models, see the last 9 rows of Table 5. Using this approach we have vación y Universidades [RTC-2017-6640-7], Agencia de Desarrollo
improved the SSD model a 4%, the Mask R-CNN model a 6%; but, Económico de La Rioja [2017-I-IDD-00018], and the computing fa-
the YOLO model does not improve at all. However, if we inspect cilities of Extremadura Research Centre for Advanced Technologies
the F1-score value at 0.6, the improvement is more evident, SSD im- (CETA-CIEMAT), funded by the European Regional Development
proves a 2%, Mask R-CNN a 10%, and YOLO a 5%. This is due Fund (ERDF). CETA-CIEMAT belongs to CIEMAT and the Gov-
to the fact that the ensemble of models usually produces bounding ernment of Spain. We also thank Álvaro San-Sáez for providing us
boxes that are not perfectly adjusted to the objects; the issue of im- with the stomata datasets.
proving those adjustments remain as further work.
As a conclusion of this example, we can again notice the bene-
fits of applying our ensemble algorithm, and the improvements that REFERENCES
can be achieved applying model distillation when a large dataset of
[1] W. Abdulla. Mask R-CNN for object detection and instance seg-
images is available, even if it is not annotated.
mentation on Keras and TensorFlow. https://github.com/
matterport/Mask_RCNN, 2017.
[2] S. Akcay et al., ‘Using Deep Convolutional Neural Network Architec-
5 CONCLUSIONS AND FURTHER WORK tures for Object Classification and Detection Within X-Ray Baggage
Security Imagery’, IEEE Transactions on Information Fosics and Secu-
In this work, we have presented an ensemble algorithm that works rity, 13(9), 2203–2215, (2018).
with the bounding boxes produced by object detection models, and, [3] D. Ballabio, R. Todeschini, and V. Consonni, ‘Recent Advances in
hence, it is independent of the underlying algorithm employed to High-Level Fusion Methods to Classify Multiple Analytical Chemical
Data’, Data Handling in Science and Technology, 31, 129–155, (2019).
construct those models. Our ensemble algorithm can be particu- [4] N. Bodla et al., ‘Soft-NMS: improving object detection with one line of
larised with three voting strategies (affirmative, consensus, and unan- code’, in Proceedings of the IEEE Conference on Computer Vision and
imous) that have a different effect depending on the performance of Pattern Recognition, CVPR’17, pp. 5561–5569, (2017).
the base models. Namely, the affirmative strategy works better when [5] C. Bucila, R. Caruana, and A. Niculescu-Mizil, ‘Model compression:
the detections of the base models are mostly correct (that is, there are making big, slow models practical’, in Proceedings of the 12th In-
ternational Conference on Knowledge Discovery and Data Mining,
few false positives) but several objects are left undetected (that is, KDD’06, pp. 535–541, (2006).
there are lots of false negatives); the unanimous strategy obtains bet- [6] B. R. Buttery, C. S. Tan, R. I. Buzzell, J. D. Gaynor, and D. C. Mac-
ter results in the opposite case; and, the consensus strategy provides Tavish, ‘Stomatal numbers of soybean and response to water stress’,
a better trade-off when there is not a significant difference between Plant and Soil, 149(2), 283–288, (1993).
[7] Z. Cai and N. Vasconcelos, ‘Cascade R-CNN: Delving Into High
false negatives and false positives in the base models. Quality Object Detection’, in Proceedings of the IEEE Conference on
In addition, the ensemble method presented here has been em- Computer Vision and Pattern Recognition, CVPR’18, pp. 6154–6162,
ployed to define a test-time augmentation procedure for object de- (2018).
tection that improves the accuracy of object detection models. More- [8] A. Casado-Garcı́a et al., ‘CLoDSA: A Tool for Image Augmentation
over, the ensemble of models and test-time augmentation are the in Classification, Localization, Detection and Semantic Segmentation
Tasks’, BMC in Bioinformatics, 20(323), (2019).
basis for data and model distillation, two semi-supervised learning [9] A. Casado-Garcı́a, J. Heras, and A. Sanz-Saez, ‘Towards the automatic
techniques that can considerably reduce the number of images that analysis of stomata images’, in Proceedings of the International Con-
must be manually annotated to train an object detection model; but ference on Computer Aided Systems Theory (EUROCAST’19), (2019).
that, up to now, have not been broadly adopted in the context of ob- [10] T. Chen et al., ‘MXNet: A Flexible and Efficient Machine Learning Li-
brary for Heterogeneous Distributed Systems’, CoRR, abs/1512.01274,
ject detection due to the lack of a clear ensemble method. (2015).
As a by-product of this work, we have developed the open-source [11] B. Coüasnon and A. Lemaitre, Handbook of Document Image Process-
EnsembleObjectDetection library that implements all the methods ing and Recognition, chapter Recognition of Tables and Forms, 647–
presented here. This library provides support for models constructed 677, Springer International Publishing, 2014.
with several algorithms and deep learning frameworks, and can be [12] A. V. Etten, ‘You Only Look Twice: Rapid Multi-Scale Object Detec-
tion In Satellite Imagery’, CoRR, abs/1805.09512, (2018).
easily extended with others. Our methods and library have been [13] M. Everingham et al., ‘The Pascal Visual Object Classes (VOC) Chal-
tested with several datasets, and we have improved some models up lenge’, International Journal of Computer Vision, 88(2), 303–338,
to a 10%. (2010).24th European Conference on Artificial Intelligence - ECAI 2020
Santiago de Compostela, Spain
[14] M. Everingham et al., ‘The Pascal Visual Object Classes Challenge: A [40] A. Rosebrock, ‘Intersection over union (iou) for ob-
Retrospective’, International Journal of Computer Vision, 111(1), 98– ject detection’, in PyImageSearch, (2018). https:
136, (2015). //www.pyimagesearch.com/2016/11/07/
[15] F. Chollet and others. Keras. https://github.com/fchollet/ intersection-over-union-iou-for-object-detection/.
keras, 2015. [41] P. Simard et al., ‘Tangent prop – a formalism for specifying selected
[16] M. C. Gobel, T. Hassan, E. Oro, and G. Orsi, ‘ICDAR2013 Table Com- invariances in an adaptive network’, in Proceedings of the International
petition’, in 12th ICDAR Robust Reading Competition, ICDAR’13, pp. Conference on Neural Information Processing Systems, volume 4 of
1449–1453. IEEE, (2013). NIPS’91, pp. 895–903, (1992).
[17] J. Guo and S. Gould, ‘Deep CNN Ensemble with Data Augmentation [42] P. Simard, D. Steinkraus, and J. C. Platt, ‘Best practices for convolu-
for Object Detection’, CoRR, abs/1506.07224, (2015). tional neural networks applied to visual document analysis’, in Pro-
[18] K. He et al., ‘Deep Residual Learning for Image Recognition’, in Pro- ceedings of the International Conference on Document Analysis and
ceedings of the IEEE Conference on Computer Vision and Pattern Recognition, volume 2 of ICDAR’03, pp. 958–964, (2003).
Recognition, CVPR’16, pp. 770–778, (2016). [43] K. Simonyan and A. Zisserman, ‘Very deep convolutional networks for
[19] J. Hosang, R. Benenson, and B. Schiele, ‘Learning non-maximum sup- large-scale image recognition’, in Proceedings of the 3rd International
pression’, CoRR, abs/1705.02950, (2017). Conference on Learning Representations, ICLR’15, (2015). http:
[20] J. Huang et al., ‘Speed/accuracy trade-offs for modern convolutional //arxiv.org/abs/1409.1556.
object detectors’, in Proceedings of the IEEE Conference on Computer [44] I. Sirazitdinov et al., ‘Deep neural network ensemble for pneumonia
Vision and Pattern Recognition, CVPR’17, pp. 3296–3305, (2017). localization from a large-scale chest x-ray database’, Computers and
[21] T. Huang, J. A. Noble, and A. I. L. Namburete, ‘Omni-Supervised Electrical Engineering, 78, 388–399, (2019).
Learning: Scaling Up to Large Unlabelled Medical Datasets’, in Pro- [45] R. Solovyev and W. Wang, ‘Weighted Boxes Fusion: ensembling boxes
ceedings of the International Conference on Medical Image Comput- for object detection models’, CoRR, abs/1910.13302, (2019).
ing and Computer-Assisted Intervention, MICCAI’17, pp. 572–580, [46] C. Y. Suen et al. ICDAR2019 Table Competition. http://
(2018). icdar2019.org/, 2019.
[22] J. Hughes et al., ‘Reducing Stomatal Density in Barley Improves [47] F. Tramèr et al., ‘Ensemble Adversarial Training: Attacks and De-
Drought Tolerance without Impacting on Yield’, Plant Physiology, fenses’, in Proceedings of the 6th International Conference on Learning
174(2), 776–787, (2017). Representations, ICLR’18, pp. 1–20, (2018).
[23] J. Irvin et al., ‘Chexpert: A large chest radiograph dataset with uncer- [48] N. Vo et al., ‘Ensemble of Deep Object Detectors for Page Object De-
tainty labels and expert comparison’, in Proceedings of the Thirty-Third tection’, in Proceedings of the International Conference on Ubiquitous
AAAI Conference on Artificial Intelligence, volume 33 of AAAI’19, pp. Information Management and Communication, IMCOM’18, pp. 1–5,
590–597, (2019). (2018).
[24] J. Lee, S. Lee, and S-I. Yang, ‘An Ensemble Method of CNN Mod- [49] P. Wei, J. E. Ball, and D. T. Anderson, ‘Fusion of an Ensemble of Aug-
els for Object Detection ’, in Proceedings of the IEEE Conference on- mented Image Detectors for Robust Object Detection’, Sensors, 18(3),
Information and Communication Technology Convergence (ICTC’18), 1–21, (2018).
ICTC’18, pp. 898–901, (2018). [50] Ensemble Machine Learning: Methods and Applications, eds.,
[25] J. Li, J. Qian, and Y. Zheng, ‘Ensemble R-FCN for Object Detectio’, in C. Zhang and Y. Ma, Springer, 2012.
Proceedings of the International Conference on Computer Science and [51] Z-Q. Zhao et al., ‘Object Detection With Deep Learning: A Review’,
its Applications, volume 474 of CSA’17, pp. 400–406, (2017). IEEE Transactions on Neural Networks and Learning Systems, 1–21,
[26] M. Li et al., ‘TableBank: Table Benchmark for Image-based Table De- (2019).
tection and Recognition’, CoRR, abs/1903.01949, (2019). [52] H. Zhou et al., ‘CAD: Scale Invariant Framework for Real-Time Object
[27] T. Lin, P. Goyal, R. Girshick, K. He, and P. Dollár. Keras retinanet. Detection’, in Proceedings of the IEEE Conference on Computer Vision
https://github.com/fizyr/keras-retinanet, 2017. and Pattern Recognition, CVPR’17, pp. 760–768, (2017).
[28] T-Y. Lin et al., ‘Microsoft COCO: Common Objects in Context’, in [53] Introduction to Semi-Supervised Learning, eds., X. Zhu and A. B. Gold-
Proceedings of the European Conference on Computer Vision, volume berg, Morgan & Claypool Publishers, 2009.
8693 of ECCV’14, pp. 740–755, (2014). [54] B. Zoph et al., ‘Learning Data Augmentation Strategies for Object De-
[29] T-Y. Lin et al., ‘Feature Pyramid Networks for Object Detection ’, in tection’, CoRR, abs/1906.11172, (2019).
Proceedings of the IEEE Conference on Computer Vision and Pattern
Recognition, CVPR’17, pp. 936–944, (2017).
[30] W. Liu et al., ‘Ssd: Single shot multibox detector’, in Proceedings of
the European Conference on Computer Vision, volume 9905 of ECCV
2016, pp. 21–37, (2016).
[31] J. Minichino and J. Howse, Learning OpenCV 3 Computer Vision with
Python, Packt Publishing, 2015.
[32] T. E. Oliphant, A guide to NumPy, volume 1, Trelgol Publishing USA,
2006.
[33] C. Peng et al., ‘MegDet: A Large Mini-Batch Object Detector ’, in
Proceedings of the IEEE Conference on Computer Vision and Pattern
Recognition, CVPR’18, pp. 6181–6189, (2018).
[34] I. Radosavovic et al., ‘Data Distillation: Towards Omni-Supervised
Learning’, in Proceedings of the IEEE Conference on Computer Vision
and Pattern Recognition, CVPR’18, pp. 4119–4128, (2018).
[35] S. Ramachandran et al., ‘Using YOLO based deep learning network
for real time detection and localization of lung nodules from low dose
CT scans’, in Proceedings of Medical Imaging 2018: Computer-Aided
Diagnosis, p. 53, (2018).
[36] J. Redmon. Darknet: Open Source Neural Networks in C. http:
//pjreddie.com/darknet/, 2013–2016.
[37] J. Redmon et al., ‘You Only Look Once: Unified, Real-Time Object
Detection ’, in Proceedings of the IEEE Conference on Computer Vision
and Pattern Recognition, CVPR’16, pp. 779–788, (2016).
[38] J. Redmon and A. Farhadi, ‘Yolov3: An incremental improvement’,
CoRR, abs/1804.02767, (2018).
[39] S. Ren, K. He, R. Girshick, and J. Sun, ‘Faster R-CNN: Towards Real-
Time Object Detection with Region Proposal Networks’, Advances in
Neural Information Processing Systems, 28, 91–99, (2015).You can also read