Impact of Cumulus Parameterization on Model Convergence of Tropical Cyclone Destructive Potential Simulation at Grey-Zone Resolutions: A Numerical ...
←
→
Page content transcription
If your browser does not render page correctly, please read the page content below
atmosphere
Article
Impact of Cumulus Parameterization on Model
Convergence of Tropical Cyclone Destructive
Potential Simulation at Grey-Zone Resolutions:
A Numerical Investigation
Chen Ma 1 , Yuan Sun 2, *, Jia Liu 1 , Tim Li 1,3 and Zhong Zhong 2
 1   Key Laboratory of Meteorological Disaster, Ministry of Education (KLME)/Joint International Research
     Laboratory of Climate and Environmental Change (ILCEC)/Collaborative Innovation Center on Forecast
     and Evaluation of Meteorological Disasters (CIC-FEMD), Nanjing University of Information Science and
     Technology, Nanjing 210044, China; nuist-machen@foxmail.com (C.M.); liujia83324@126.com (J.L.);
     timli@hawaii.edu (T.L.)
 2   College of Meteorology and Oceanography, National University of Defense Technology, No.60,
     Shuanglong Rd., Nanjing 211101, China; zhong_zhong@yeah.net
 3   International Pacific Research Center and Department of Atmospheric Sciences,
     School of Ocean and Earth Science and Technology, University of Hawaii, Honolulu, HI 96822, USA
 *   Correspondence: sunyuan1214@126.com

 Received: 18 December 2018; Accepted: 7 February 2019; Published: 12 February 2019

 Abstract: The Weather Research Forecast model (WRF) is used to examine the destructive potential of
 tropical cyclone (TC) Shanshan (2006) at various horizontal resolutions (7.5 km–1 km) with different
 cumulus parameterization (CP) schemes. It is found that the calculated Power Dissipation Index
 (PDI) increases while the size-dependent destructive potential (PDS) decreases as the grid spacing
 decreases for all CP-scheme simulations, which indicates a weak model convergence in both PDI
 and PDS calculations. Moreover, it is change of the storm intensity and inner-core size that lead
 to the non-convergence of PDI and PDS respectively. At a higher resolution, convection becomes
 more explicitly resolved, which leads to larger diabatic heating. As a result, the radial pressure
 gradient force (PGF) increases, and the radius of maximum wind (RMW) decreases. The area of
 strong diabatic heating subsequently becomes closer to the TC center, which further increases the
 TC intensity and the PGF near the eyewall. With such a positive feedback loop, the PGF increases
 and the RMW decreases as the resolution increases. Note that a perfect model should converge
 well in the simulation of both TC intensity and size, and thus converge in the PDS. For some CP
 experiments, the calculated PDS convergence is relatively strong, but it is a result of offset between
 the non-convergent simulations of TC intensity and size. In contrast, the Grell–Freitas scheme exhibits
 a stronger convergence in the simulations of TC intensity and size, although the convergence in PDS
 is relatively weak, but is closer to the truth.

 Keywords: tropical cyclone size; WRF model convergence; tropical cyclone destructive potential

1. Introduction
     Tropical cyclones (TCs) are highly destructive natural disasters that occur on tropical oceans [1,2].
Zhai and Jiang investigate the US hurricane economic loss on TC intensity and size based on National
Hurricane Center (NHC) Extended Best Track database which TC size data on North Atlantic is
available since 1988 [3]. However, the TC size data on West North Pacific and East North Pacific
is available since 2001 in Joint Typhoon Warning Center (JTWC) dataset. Compared with the TC

Atmosphere 2019, 10, 74; doi:10.3390/atmos10020074                        www.mdpi.com/journal/atmosphere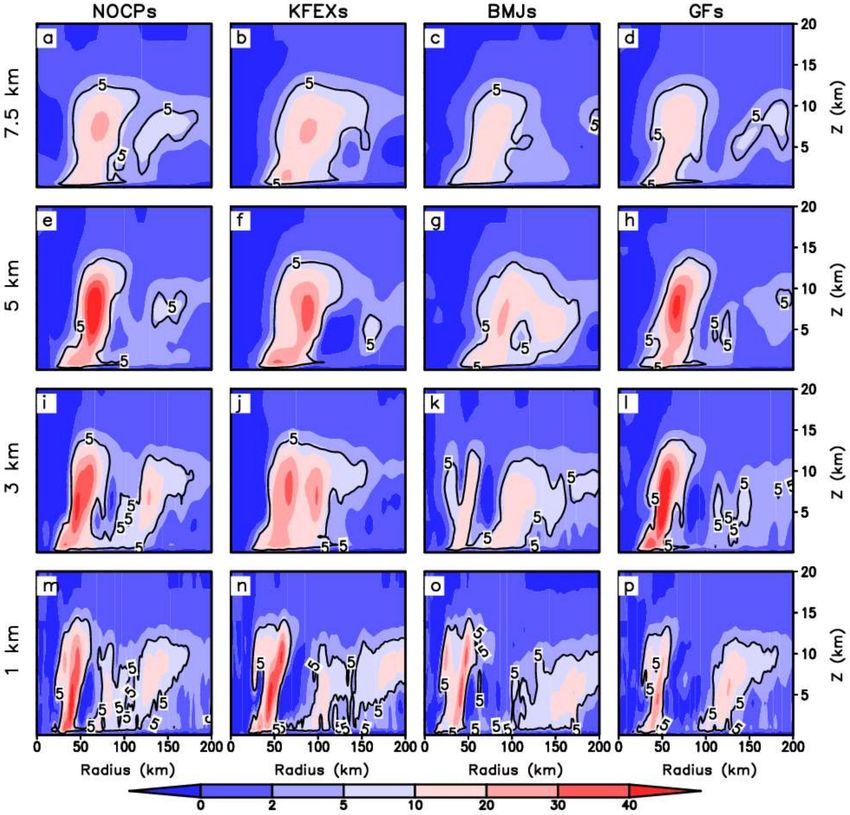
Atmosphere 2019, 10, 74                                                                              2 of 16

intensity and track data in best track datasets, the historical record of TC size is much less. Owing to
the lack of TC size information in observational data, the previous studies often ignored the effect of
TC size on its destructiveness and assumed a fixed TC dimension in calculating the TC destructiveness.
The power dissipation index (PDI), which is proposed by Emanuel [4], is widely used to estimate the
TC destructive potential [5–7]. However, as the PDI of a TC is defined as the sum of the cube of the
maximum wind speed (MWS), which is integrated during the TC lifetime, the PDI does not take into
account the effect of the TC size. Sun et al. defined an index of size-dependent destructive potential
(PDS) [8], which is dependent on both the TC intensity and TC size, in particular, the inner-core size
of TC.
      With advances in computation capability, numerical weather prediction models are able to run
at horizontal grid intervals within the range of 1–10 km [9]. Whether the high-resolution numerical
model can improve the simulation of TCs, however, remains a controversial issue. Sun et al. argued
that with increases in the model resolution [10], a key issue in numerical weather prediction is the
appropriateness of various cumulus parameterization (CP) schemes. Hammarstrand pointed out that
the prerequisite for the application of CP scheme is that the spatial scale of the convective updraft
must be much smaller than the horizontal grid interval of the model [11]. Most of the CP schemes
primarily used at present are designed based on the above concept proposed by Hammarstrand [11].
This assumption in the design of CP scheme induces many arguments about whether it is still necessary
to use CP scheme in high-resolution numerical weather prediction models. On the one hand, Gerard
proposed the concept of “grey-zone resolution”, which is used to describe the resolution at which
it is uncertain whether the CP scheme should be applied [12]. Yu and Lee further suggested that
the “grey-zone resolution” ranges with 1–5 km [13]. On the other hand, many studies showed
problems such as irresolvable convection and under prediction or over prediction of precipitation in
high-resolution simulations without the application of CP scheme. Thereby, it is suggested that the CP
scheme is still needed even in high-resolution simulations [14,15]. For high-resolution TC simulations,
Fierro et al. indicated that it is impossible to effectively improve the TC simulation by solely increasing
the model resolution without improving the description of various physical processes [16]. Results
of the previous studies showed that, the CP scheme is closely related to the model convergence in
simulating TC intensity [10,17]. They also suggested that, a perfect numerical model should produce
convergent TC structure and intensity simulation as the model resolution increases, despite of the fact
that the converged solution does not necessarily approach the truth. Therefore, finding or designing a
proper CP scheme which makes the model solution converged, is a prerequisite for a perfect model.
According to the results of large-eddy simulation of idealized TC, Rotunno et al. pointed out that the
simulated TC intensity increases significantly with increasing resolution and becomes non-convergent
especially under high-resolutions [18]. Bryan et al. conducted squall lines simulation with grid spacing
below 1 km, and found that the simulated squall lines varies with model resolution [19]. Sun et
al. revealed different convergent features of high-resolution TC intensity simulation using several
different CP schemes and analyzed the possible mechanisms behind [10,17]. They found a weak
convergence in simulations with most of the CP schemes, whereas the convergence is relatively strong
in the simulations with the Grell–Freitas (GF) scheme [20], which is a scale-aware scheme designed for
any resolution.
      The studies mentioned above have revealed that the simulated TC intensity increases with
increased resolution, eventually leading to non-convergent TC intensity simulation. However, the
property of convergence related to TC structure like the TC size has not been well studied. Since the TC
PDS is determined by not only the TC intensity but also the TC size, how the TC PDS will respond to
increasing resolution and how different the PDS is compared to the PDI remains unclear. In the present
study, we investigate the convergence of TC PDS simulation based on the case study of typhoon
Shanshan (2006) with several different CP schemes. Section 2 describes the model configuration and
experimental design. Section 3 shows the results of simulations using various CP schemes and at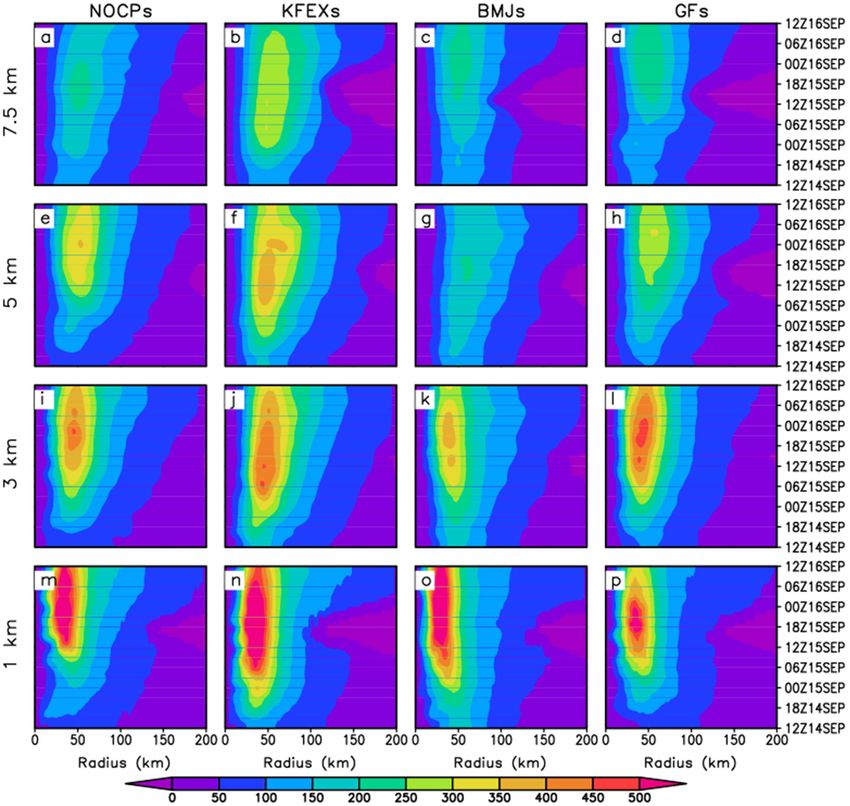
Atmosphere 2019, 10, 74                                                                                       3 of 16

different resolutions. Possible physical mechanisms that affect the convergence of TC PDS simulation
are explored in Section 4. Conclusions and discussion are presented in Section 5.

2. Model Configuration and Experimental Design
       Typhoon Shanshan was formed over the northwestern Pacific (16.7◦ N, 134.9◦ E) at 1200 UTC 10
September 2006. In the following 2 days, Shanshan continued to move westward and was upgraded to
an extremely severe typhoon by the Joint Typhoon Warning Center (JTWC) at 0000 UTC 12 September.
It then moved northward and reached eastern Taiwan Island (20.7◦ N, 124.6◦ E) at 1800 UTC 14
September. Subsequently, Shanshan turned to northeast and made landfall in Japan about 1000 UTC 17
September. Overall, Shanshan has a typical recurving track with high intensity and long lifetime, which
is illustrated by the JTWC best-track data [21]. Due to the high intensity and long duration, Shanshan
inflicted enormous life and property losses over Japan and its outlying Pacific islands. The loss of $2.5
billion caused by TC Shanshan made it the sixth costliest disaster in the world in 2006.
       In this study, the Weather Research and Forecasting model version 3.5 (WRFV3.5) is employed to
conduct a series of numerical experiments. Some important physical schemes include Monin–Obukhov
surface-layer scheme [22,23], Yonsei University planetary boundary layer scheme [24], and Lin
microphysical scheme [25]. The initial and boundary conditions are obtained from the 1◦ × 1◦ National
Centers for Environment Prediction final analysis data at 6-h intervals [26]. The TC bogus scheme in the
WRF model is used to refine the initial field [27].
       Four suites of experiments are carried out in this study. The difference among them lies on CP
schemes in the innermost domain, which are as follows: (1) without the CP scheme (NOCP), (2) the
Kain–Fritsch CP (KFEX) scheme [28,29] is applied, (3) the Betts–Miller–Janjić CP (BMJ) scheme is
used [30–33] and (4) the Grell and Freitas (GF) scheme is employed [20]. Each suite of experiments
includes simulations at resolutions of 1, 3, 5, and 7.5 km in the innermost domain. Table 1 lists the
model domain setting, which is triply-nested with the two inner domains (DM2, DM3) movable [27].
An extra nesting domain (DM4) with the highest resolution of 1 km is added for some high-resolution
experiments. The domain configuration can be found in Figure S1. During the integration, all the inner
domains (DM2, DM3, and DM4) can move following the movement of typhoon Shanshan. In order to
keep the parent domains consistent between all these suites, DM1 and DM2 cover the same areas in all
the experiments. The size of DM4 in the 1-km resolution runs is the same as that of the DM3 in 3 km,
5 km and 7.5 km resolution runs. All physical schemes and dynamical setup in the innermost domain
are the same in these suites of experiments except the CP scheme, which makes it convenient for us to
compare the performance of different CP schemes. Note that the GF scheme is a scale-aware scheme,
which is different from other CP schemes. As the model resolution increases, the GF scheme produces
smaller tendencies and more convection is resolved by the microphysical scheme. This scheme can
sufficiently remove moist instability for the entire grid point, and thus is somewhat different from other
conventional CP schemes. Sun et al. indicated that the GF scheme could yield convergent simulation
of TC intensity [17]. Thereby, in the following sections we pay more attention to the performance of
the GF scheme in the simulations of TC size and destructive potential in the high-resolution runs.

         Table 1. Domain settings for the four suites of simulations with different horizontal resolutions.

                Case      Grid Spacing         DM1             DM2            DM3             DM4
               7.5 km      45-15-7.5 km       55 × 75       100 × 100       105 × 105         none
                5 km        45-15-5 km        55 × 75       100 × 100       157 × 157         none
                3 km        45-15-3 km        55 × 75       100 × 100       261 × 261         none
                1 km       45-15-5-1 km       55 × 75       100 × 100       157 × 157       501 × 501

3. Performance of Different CP Schemes
     In this study, the simulated storms in all the experiments share a similar track (Figure 1), which
effectively reduces uncertainties caused by the effect of large-scale environmental field in these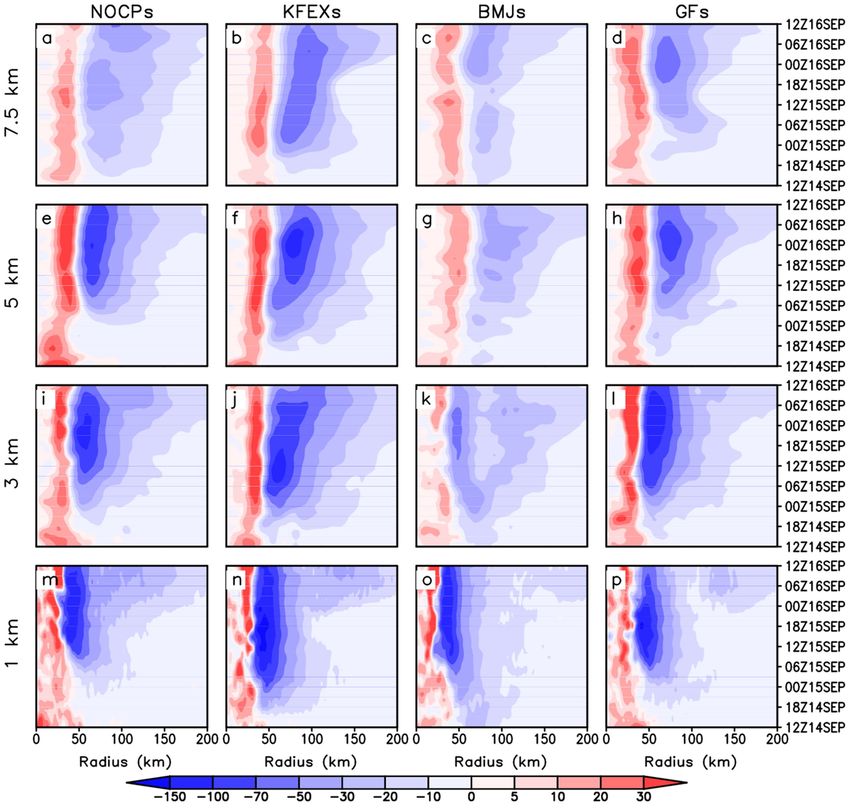
Atmosphere 2019, 10, 74                                                                                 4 of 16

experiments [34,35]. This makes it trustworthy to examine the sensitivity of the simulated TC structure
to the choice of horizontal resolution and CP scheme. Meanwhile, the simulated TC intensity and
size are also sensitive to the CP scheme and model resolution (Figures S2–S4). Since the simulated
TC reaches its maximum intensity at 0000 UTC 16 September, we define the period from 1800 UTC 15
September to 0600 UTC 16 September as the TC mature stage. Unless specified otherwise, this period
is used as the TC mature stage hereafter.

      Figure 1. Storm tracks at various resolutions simulated by (a) NOCPs, (b) KFEXs, (c) BMJs, (d) GFs.
      The black line is the observation data from JTWC.

      Emanuel defined a simplified power dissipation index as [4]:

                                                          3 dt
                                                    Rτ
                                            PDI =    0   Vmax                                               (1)

where V max is the maximum wind speed and τ is the lifetime of TC. Although the PDI index has been
widely applied, this index cannot account for the effect of TC size. The storm size is an important
parameter in estimating the extent of TC-induced damage. The TC size here we referred to is the mean
radius of hurricane-force wind (R33), which is an important damage potential parameter and thus
more suitable for the assessment of TC destructive potential. To take into account the TC size effect,
the storm size-dependent TC destructive potential (PDS) index proposed by Sun et al. is used in the
present study [8]:
                                           RτRA
                                    PDS = 0 0 0 CD ρ|V |3 dAdt                                    (2)

where CD is the surface drag coefficient, ρ is the surface air density, A0 is the area of hurricane-force
wind, |V| is the magnitude of surface wind, and τ is the lifetime of TC. The PDS represents the
total power of hurricane-force winds over its lifetime. Compared with changes in the PDI that only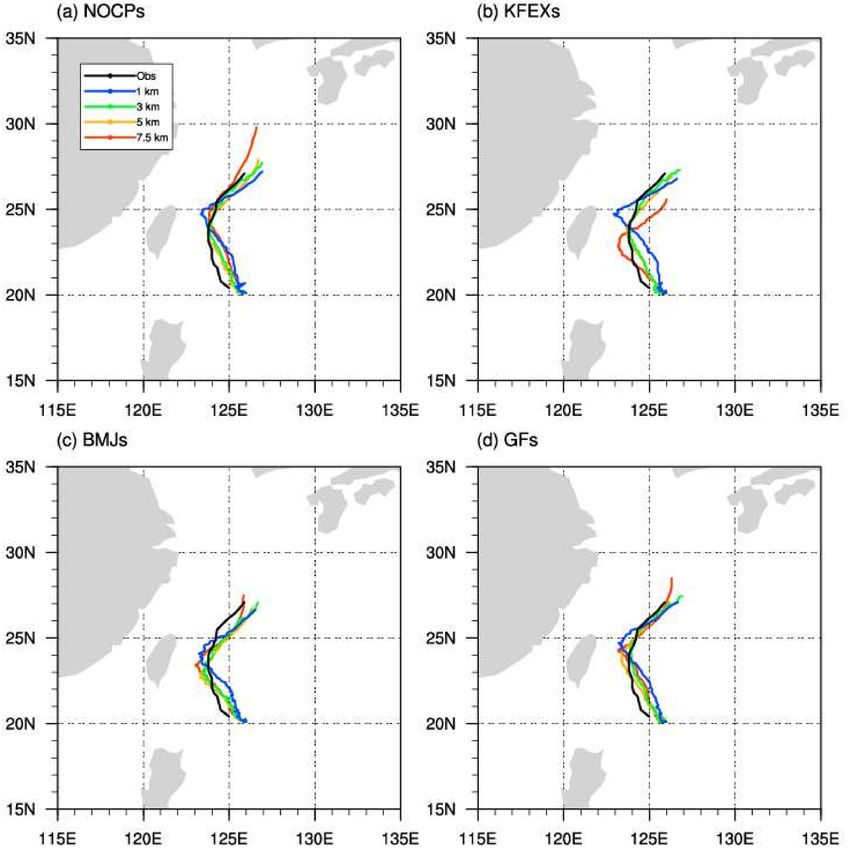
Atmosphere 2019, 10, 74                                                                                  5 of 16

considers the effect of TC intensity, changes in the TC PDS that considers effects of both the TC intensity
and TC size with increasing resolution might be different.
      Figure 2 presents changes in the domain-averaged MWS, PDI, radius of maximum wind (RMW),
R33 and PDS with increasing resolution in the innermost domain simulated with different CP schemes
and averaged in the TC mature stage from 1800 UTC 15 September to 0600 UTC 16 September.
The reason of using TC mature stage here is that, the destructive potential of a TC is a time integral
of TC intensity and size. Only when the intensity and size of TC reach its peak in the mature stage,
making the TC destructive potential meaningful. It shows clearly that the simulated TC intensifies with
increasing resolution (i.e., from 7.5 km to 5 km) in all the experiments with various CP schemes, which
is attributed to the intensification of convection. In the NOCP, KFEX and BMJ runs, the simulated
TC intensity and PDI index keep increasing with increases in the resolution, and the model becomes
non-convergent. In the GF runs, the simulated TC intensity and PDI remain relatively stable as the
resolution increases from 3 km to 1 km (Figure 2d,h), suggesting that the GF scheme converges well in
the simulation of TC intensity and PDI. As the resolution of the GF experiment is increased from 3 km
to 1 km, the MWS is decreasing while the PDI is increasing (Figure 2d,h). This is because the PDI is a
time integration variable that covers the whole TC lifetime rather than only the TC mature stage, and
the simulated MWS in the 1-km resolution run is stronger than that in the 3-km resolution run in the
TC developing phase (Figure S3d).

      Figure 2. Changes of time-averaged (a–d) MWS (m s−1 ), (e–h) PDI (1016 m3 s−2 ), (i–l) RMW (km),
      (m–p) R33 (km), (q–t) PDS (1014 kg m2 s−2 ) with resolution in the experiments using four CP schemes
      in the TC mature stage from 1800UTC 15 September to 0600 UTC 16 September. The time-average
      interval is one hour. The bar line is a range of one standard deviation.

      When considering the effect of the TC size, the calculated PDS at high-resolutions (i.e., from 3 km
to 1 km) in the NOCP, KFEX, BMJ and GF runs all decrease with increased resolution, which is opposite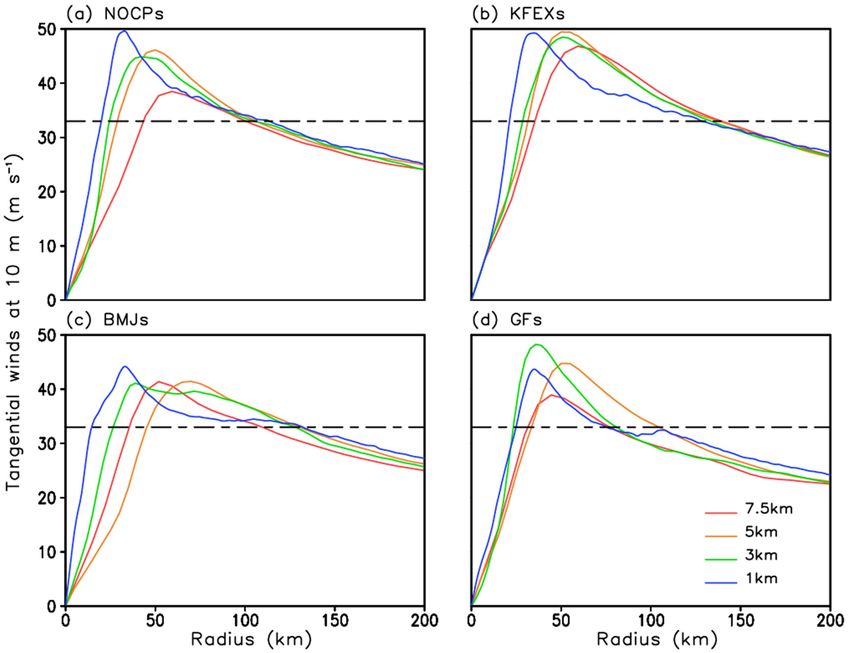
Atmosphere 2019, 10, 74 6 of 16
to the changes of the PDI (Figure 2e–h, and Figure 2q–t). It can be seen from the distribution of the
mean and standard deviation that the decrease of TC size is an objective phenomenon, rather than the
individual low values lowering the overall time average. Since the inner-core size is considered in
the PDS definition, we compare the model convergence for the simulations of RMW and R33, which
are two indexes that reflect the TC inner-core features. Note that R33 is more complicated than RMW
since it is related to not only RMW, but also other factors like MWS. As shown in Figure 2, the model
convergence in the NOCP, KFEX, and BMJ runs is weak in terms of both the RMW and R33. Further
analysis shows a relatively strong convergence of the RMW simulation in the GF experiment. However,
the simulated R33 decreases with increased resolution, which is possibly because the simulated TC
intensity slightly decreases under high-resolution (Figure 2d). Thereby, the PDS simulation is also
non-convergent in the GF experiment. Compared to the non-convergent PDI, the non-convergent
PDS is largely attributed to the non-convergent simulation of the TC inner-core size. Due to the
strong impact of TC inner-core size on the PDS convergence, it is necessary to investigate the weak
convergence of TC size in the four suites of experiments with different CP schemes.
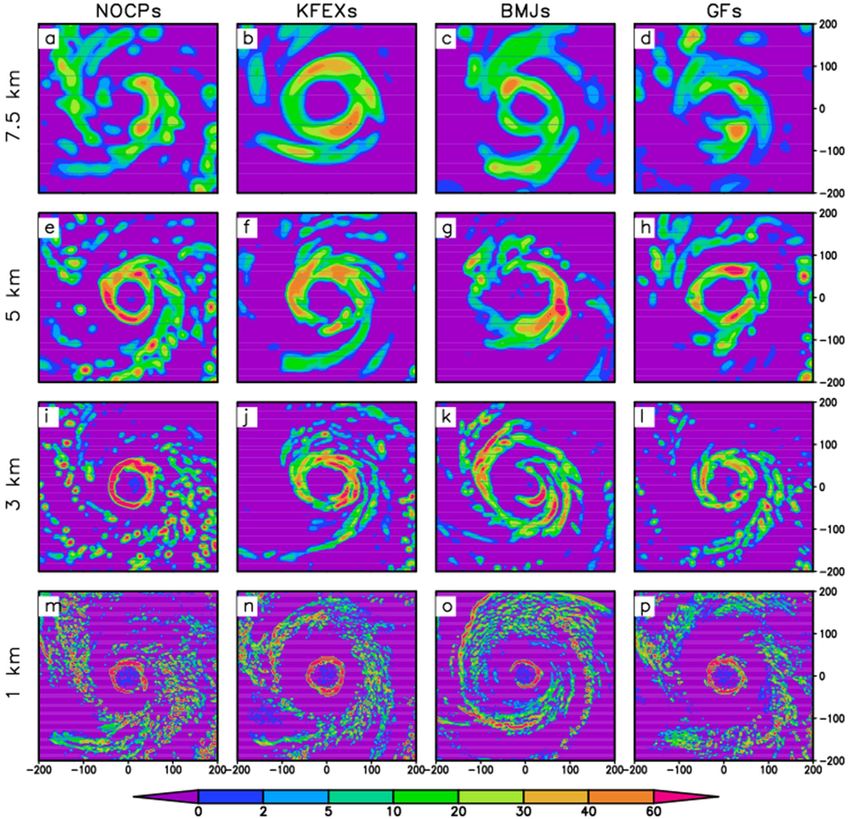
To further confirm the non-convergent feature in the simulation of the TC inner-core size with
various CP schemes, Figure 3 is presented to display changes in the heavy precipitation area with
resolutions from 7.5 km to 1 km in all the experiments with different CP schemes in the TC mature stage
from 1800 UTC 15 September to 0600 UTC 16 September. As strong convection near the TC eyewall
area is often accompanied by heavy precipitation, here we use the area with precipitation larger than
50 mm h−1 as the standard to measure the inner-core size. Similar to the situation for RMW, R33
and PDS, heavy precipitation area keeps decreasing with increased resolution in all the experiments
using the four CP schemes. The model convergence is especially weak in the NOCP, KFEX, and BMJ
experiments based on the degree of decrease in the heavy precipitation area with increased resolution.
The model convergence in the GF experiment is relatively strong, but the heavy precipitation area still
decreases with increased resolution, which is consistent with the model simulation of RMW and R33.
Thereby, in terms of the heavy precipitation area, the model is non-convergent in the simulation of TC
inner-core size with all the four CP schemes.
Figure 3. Changes of time-averaged heavy precipitation (greater than 50 mm h−1 ) area (km2 ) with
resolution in the experiments simulated by (a) NOCPs, (b) KFEXs, (c) BMJs, (d) GFs. The time-average
interval is one hour. The bar line is a range of one standard deviation.
Overall, the calculated TC PDS becomes non-convergent at high resolution when using all the
four CP schemes, which would lead to biases in the estimation of TC destructive potential. The major
reason for the non-convergent simulation of TC PDS is that the simulation of the TC inner core size is
not convergent. In the next section, we will further explore the possible reasons for the weak model
convergence in the simulation of the TC inner-core size.
4. Reasons for The Non-Convergent Simulation of TC Inner Core Size with Different CP Schemes
Generally speaking, the tangential wind profile of the TC is largely determined by the TC intensity
(i.e., MWS), TC inner-core size (i.e., RMW) and tangential wind slope outside the RMW. Based on the
theoretical study of Carr and Elsberry [36], the tangential wind slope outside the RMW is related to the
Coriolis parameter f, which actually reflects the latitude where the TC is located. In the present study,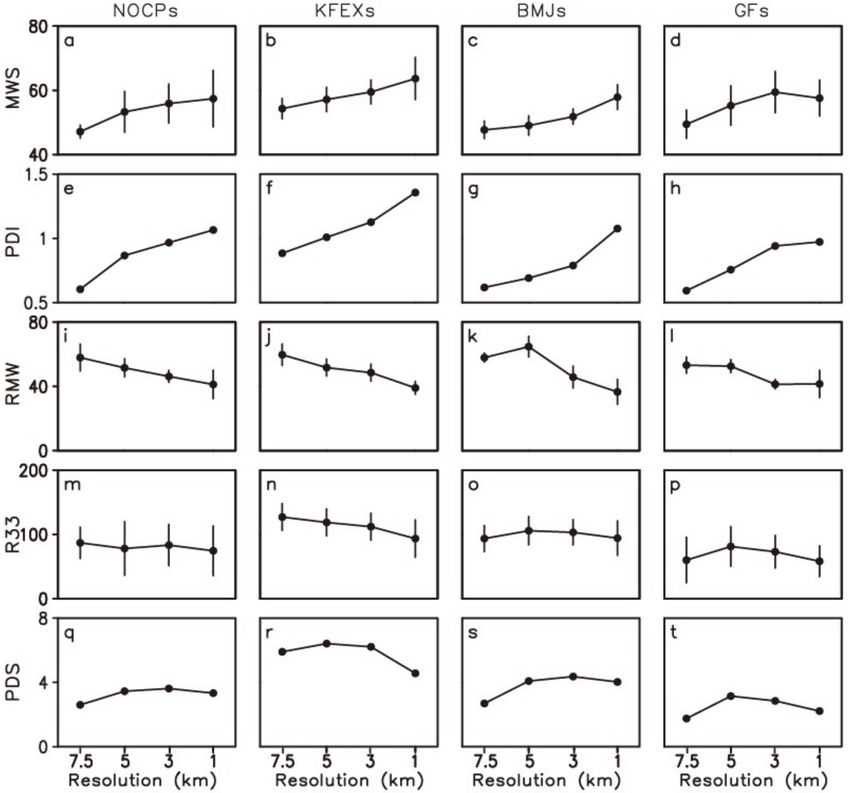
Atmosphere 2019, 10, 74                                                                                  7 of 16

the simulated typhoon tracks in all the experiments are similar (Figure 1), suggesting that the tangential
wind slopes outside the RMW are similar as well in these experiments. Sun et al. also indicated that
stronger convection along the TC eyewall leads to stronger outward flows in the upper troposphere,
which can induce raindrop evaporation in the middle troposphere and promote the formation of new
convection in the TC outer region and thus lead to the slope difference [8]. In other words, the slope
outside RMW is somehow related to the TC intensity. In order to disentangle the contributions of RMW
and MWS to the TC R33, Table 2 shows the statistics of regressions of R33 from all the experiments
data onto the RMW and MWS. Although the regression residual of RMW to R33 is small, the multiple
regression coefficients are statistically significant and explain 34% of the R33 when RMW and MWS
indices together. Thereby, the R33 is largely affected by the RMW and MWS. It is relatively easy to
understand why the MWS increases following the increase of model resolution. As suggested by Sun et
al., more convection within the TC eyewall can be resolved with increasing resolution [10]. The MWS
increases as convection intensifies within the eyewall. However, the mechanisms for changes in the TC
size (RMW) are more complicated compared to that for TC intensity (MWS). Thereby, we will further
investigate reasons for the weak convergence of simulated R33 from the perspective of the MWS and
RMW, and focus on the mechanism that affects the convergence of RMW. The simulations of the four
CP experiments are divided into two categories, i.e., results of the NOCP, KFEX and BMJ experiments
are the first category, and results of the GF experiments are the second category. In the first category,
the simulated TC intensity gradually increases while the RMW and R33 gradually decrease with
increasing resolution. In the second category, following the increase in model resolution, relatively
small changes are found in the simulated MWS and RMW while the R33 gradually decreases.

      Table 2. The residuals of the regression of R33 onto the RMW, MWS and the residuals of the bivariate
      regression of R33 onto the RMW and MWS indices for the all experiments data. The correlation
      coefficient between R33 and RMW is 0.19 and 0.39 between R33 and MWS.

                                            RMW        MWS        RMW + MWS
                                 R2          0.04       0.15           0.34
                              p-value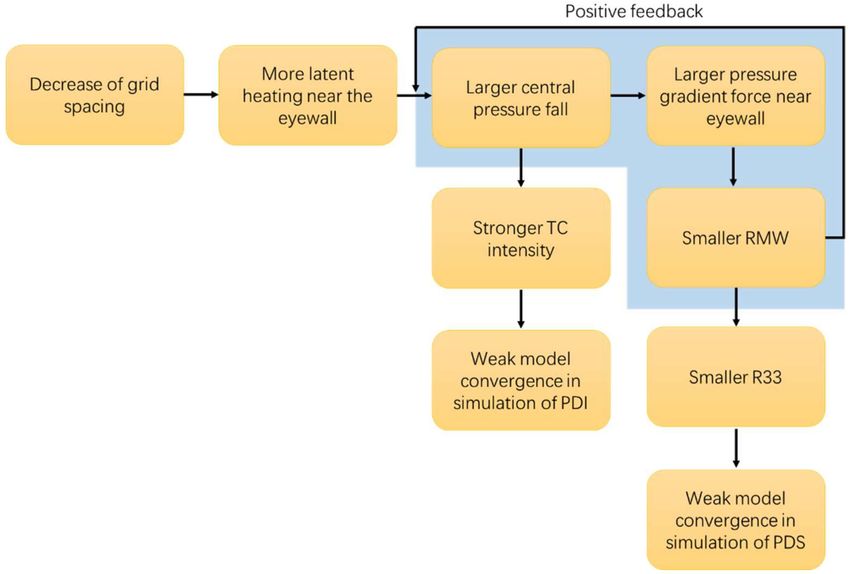
Atmosphere 2019, 10, 74                                                                                      8 of 16

      Figure 4. Horizontal cross sections of time-averaged diabatic heating (◦ C h−1 ) in the TC mature stage.
      The time-average interval is one hour. The model resolution is 7.5 km (a–d), 5 km (e–h), 3 km (i–l) and
      1 km (m–p) respectively.

     To further confirm the close relationship between simulated TC inner-core size and diabatic
heating, Figure 5 is presented to show the azimuthal-means and time-averaged cross sections of
the model simulated diabatic heating. Similar to those shown in Figure 4, when the resolution
increases form 7.5 km to 5 km, diabatic heating intensifies in all the four CP experiments as expected.
This is because when the resolution increases, more convection is resolved within the TC eyewall and
diabatic heating increases subsequently. When the model resolution further increases, i.e., grid spacing
decreases from 5 km to 1 km, diabatic heating in the TC eyewall area continues to intensify in the first
three experiments; meanwhile, the maximum heating is located closer to the TC center. This result
is consistent with the variations of model-simulated rainfall shown by Gentry and Lackmann [39].
In addition, the eyewall slope represented by the solid line decreases with height, indicating a decreased
TC inner core size. Hazelton and Hart use the radar reflectivity data to analyze the relationship between
azimuthal mean slope and TC intensity. Their result shows that the eye slope is more upright in the
stronger storms [40]. In fact, as the resolution increases, the eye slope of the simulated TCs decreases
in our first three experiments and the intensity is indeed enhanced. In the GF experiment (Figure 5l,p),
however, when the resolution increases from 3 km to 1 km, the maximum diabatic heating value
becomes smaller, and its distance to the TC center changes little, resulting in a relatively small change
in the horizontal distribution of diabatic heating. This may be an important reason for the relatively
strong convergence in the RMW simulation of the GF runs, which will be further discussed later.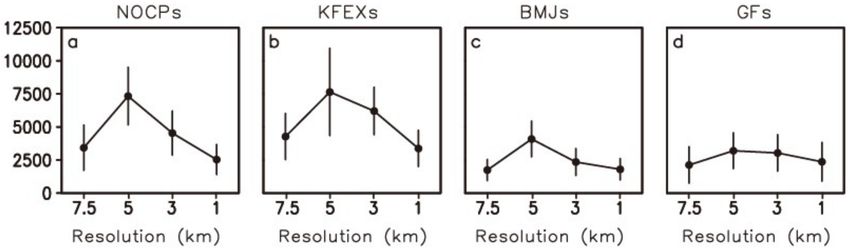
Atmosphere 2019, 10, 74                                                                                      9 of 16

      Figure 5. Azimuthal- and time-averaged cross-sections of the model-simulated diabatic heating (◦ C h−1 ;
      shaded) and the solid line represents the 5 ◦ C h−1 contour line of simulated diabatic heating in the TC
      mature stage. The model resolution is 7.5 km (a–d), 5 km (e–h), 3 km (i–l) and 1 km (m–p) respectively.

      Figure 6 shows the Hovmöller diagram of azimuthal-mean radial pressure gradient at 100-m
height. Note that the spatial and temporal distributions of diabatic heating are quite similar to those
of radial pressure gradient (figure omitted). As suggested by Hack and Schubert, the closer the
position of diabiatic heating to TC center, the larger the contribution it makes to the TC central pressure
fall [41]. In the simulations with coarse resolutions, e.g., 7.5 km and 5 km, the simulated maximum
value of diabatic heating is relatively small and located farther from the TC center. This contributes
to the smaller fall of the TC central pressure, and thus leads to weaker pressure gradient near the
eyewall [10,42]. In contrast, when the model resolution increases to 3 km and 1 km, the opposite is true.
The simulated maximum value of diabatic heating increases significantly and is located closer to the
TC center in the NOCP, KFEX and BMJ experiments, leading to great increases in the TC intensity and
thus the radial pressure gradient near the TC eyewall. In order to better understand the relationship
between the intensified radial pressure gradient and the decreased RMW as the grid spacing decreases
(see Figure 2), diagnostic analysis of radial velocity is conducted. The diagnostic equation used in the
present study is similar to that in Gopalakrishnan et al. [43], which is expressed as:

                                     dur    1 ∂p vt vt
                                         =−      +     + f vt − Dur                                              (3)
                                      dt    ρ ∂r   r

where r is the radial distance from the TC center, ur and vt are azimuthal-mean radial and tangential
winds, respectively, f is the Coriolis parameter, ρ and p are the air density and pressure, Dur
is parameterized subgrid scale diffusion term which includes friction and horizontal diffusions.
The inflow of radial wind is mainly concentrated below the height of 1 km (Figure S6), thereby the
Atmosphere 2019, 10, 74 10 of 16
vertical level of the radial velocity equation diagnosis is selected at the height of 100 m above the
surface. Previous studies have shown that the horizontal diffusion term above 100 m is quite small
and negligible in storm simulation. Equation (3) reflects the gradient wind imbalance outside the
eyewall [44,45]. This imbalance intensifies as the resolution increases, which is attributed to the
increase in pressure gradient force (Figure 6). Following the increase in model resolution, the stronger
radial pressure gradient force accelerates the radial inflow and leads to an inward contraction of the
RMW (Figure 6). This indicates that the decrease of RMW is contributed by the increase of pressure
gradient force as the model resolution increases. Figure 7 shows the azimuthal-mean net radial forcing
term. As the model resolution increases to 1 km, the diabatic heating near the eyewall increases in
the NOCP, KFEX and BMJ experiments, which reduces the pressure at the TC center and increases
the pressure gradient force (Figure 6m–o). In this situation, the net radial forcing term also becomes
larger according to Equation (3). As a result, the TC eyewall shrinks inward and the RMW reduces.
Moreover, due to the decrease in the RMW, the area of diabatic heating shifts closer to the TC center
and further decreases the TC central pressure [41]. The above results indicate that with the increase in
the model resolution, a positive feedback develops between decreases in the RMW and increases in the
pressure gradient, which leads to TC intensification and further decreases the RMW. The simulation
of RMW eventually becomes non-convergent as shown in Figure 2, which presents the results of
the experiments of NOCP, KFEX and BMJ. Meanwhile, the contraction of the RMW leads to large
centrifugal force and thus decelerates the radial inflow, preventing further contraction of the RMW [46].
Thereby, such a positive feedback loop keeps increasing the pressure gradient and decreasing the RMW
until a new equilibrium of radial force in the eyewall is reached. Nevertheless, for the GF scheme,
the diabatic heating only slightly decreases as the model resolution increases, and the area of diabatic
heating changes little (Figure 5p). With small changes in net radial forcing term, the simulation of the
RMW remains convergent.
Figure 6. Hovmöller diagrams of the azimuthal-averaged radial pressure gradient (kg m−2 s−1 h−1 ) at
100 m height. The model resolution is 7.5 km (a–d), 5 km (e–h), 3 km (i–l) and 1 km (m–p) respectively.Atmosphere 2019, 10, 74 11 of 16
Figure 7. Hovmöller diagrams of the azimuthal-averaged net radial forcing term (m s−1 h−1 ) at 100 m
height. The model resolution is 7.5 km (a–d), 5 km (e–h), 3 km (i–l) and 1 km (m–p) respectively.
In the GF experiment, only small changes are found in the TC inner core size (i.e., RMW) as the
resolution increases. However, the calculated PDS is still non-convergent because of the decrease
in the R33, which is determined by both the MWS and RMW. Figure 8 shows the azimuthal-mean
radial distribution of tangential wind at 10-m height above the ground. The dashed line represents
the tangential wind speed of 33 m s−1 . When the model resolution increases from 7.5 km to 3 km,
the simulated RMW decreases but the maximum tangential wind increases in all the experiments.
However, when the model resolution increases from 3 km to 1 km, simulations with different CP
schemes become quite different. Contrary to the results simulated with the other three CP schemes,
the diabatic heating simulated with the GF scheme decreases as the resolution increases, especially
the diabatic heating in the eyewall (Figure 5p). This is because the relatively strong outer convection
suppresses the development of inner convection in the TC eyewall [44], which leads to relatively weak
TC intensity in the 1-km run. Meanwhile, the RMW remains unchanged in the 1-km resolution run
compared to that in the 3-km resolution run. The above features contribute to the convergence of the
RMW simulation with the GF scheme (Figure 2). It is exactly that R33 becomes smaller based on the
theory of Carr and Elsberry [36], as the RMW remains unchanged and the intensity (MWS) decreases in
the GF experiment when the model resolution increases to the finest (i.e., 1 km). This eventually leads
to the non-convergent simulation of PDS. In the other three suites of experiments with different CP
schemes (Figure 8a–c), the RMW decreases and the MWS increases as the model resolution increases.
Simulations of the above two factors (i.e., RMW and MWS), which affect the simulation convergence
of R33, are not convergent. Thereby, compared to that in the GF experiment, the relatively strong
convergence of R33 simulation in the NOCP and BMJ experiments is obtained by wrong reasons and
thus are not trustworthy. Comparison of the four CP schemes reveals that the NOCP and BMJ schemesAtmosphere 2019, 10, 74 12 of 16
cannot well simulate the TC intensity and TC size; thereby, their relatively better performance in the
convergence of calculated PDS is a result of offset between counteracting behaviors of other variables.
A perfect model should be able to yield strong convergent simulation of both the TC intensity and
TC size, and thus strong convergent simulation of PDS. Compared to the other three CP schemes, the
simulation of the GF scheme is more trustworthy.
Figure 8. Radial distributions of the azimuthal-mean tangential wind (m s−1 ) at 10-m height in the TC
mature stage simulated by (a) NOCPs, (b) KFEXs, (c) BMJs, (d) GFs. The dash line represents 33m s−1 .
5. Summary and Discussion
The present study investigates the convergence of WRF simulation of the destructive potential of
TC Shanshan (2006) using four different CP schemes. It is found that as the model resolution increases,
the PDI increases while the PDS decreases to various degrees in all the experiments with the four CP
schemes. The differences in the simulation convergence between the two TC destructive potential
indexes lie in the fact that the TC inner core size is considered in the PDS computation but not in the
PDI. Apparently, the TC inner-core size imposes great impacts on the PDS simulation. The increase
in the calculated PDI at higher resolution is attributed to larger TC intensity at higher resolution.
When considering the TC inner core size, decreases in the PDS at higher resolution are associated with
decreases in the TC inner-core size at higher resolution.
Since the TC inner-core size makes great contributions to the non-convergence of the TC PDS
simulation, the present study is focused on the convergence issue of TC inner-core size simulation,
especially the RMW. Physical mechanisms for the non-convergent PDS, which decreases as the
resolution increases, are explored (Figure 9). Diagnostic analysis of radial winds is conducted to
investigate the reasons for different features of convergence in the TC inner-core size simulation using
different CP schemes. It is found that in the NOCP, KFEX, and BMJ experiments, when the resolution
gradually increases from 7.5 km to 1 km, more convection is resolved, and the simulated maximum
diabatic heating near the TC eyewall becomes larger, leading to rapid pressure decrease and pressureAtmosphere 2019, 10, 74 13 of 16
gradient increase in the corresponding area. On the one hand, the above processes keep increasing the
simulated TC intensity, and result in stronger non-convergence of the PDI simulation. On the other
hand, larger pressure gradient force would reduce the RMW according to the gradient wind balance
equation. The area of diabatic heating becomes closer to the TC center due to the decrease in the RMW,
leading to larger pressure decrease in the TC center. Such a positive feedback loop keeps increasing the
pressure gradient and decreasing the RMW until a new stable equilibrium of radial force in the eyewall
is reached. As a result, the model simulation of the TC inner core size becomes non-convergent, which
eventually leads to non-convergent PDS simulation.
Figure 9. Schematic diagram summarizing the possible reasons for the dependence of model convergence
in simulations of the TC PDI and PDS. Blue shading indicates the positive feedback of smaller RMW on
central pressure fall.
Contrary to the simulations with the above three CP schemes, the RMW simulation converges
well with the GF scheme. With this scheme, the area of diabatic heating does not shrink inward as the
resolution increases, and the maximum diabatic heating only changes slightly. As a result, the model
well converges for simulations of the RMW, TC intensity, and PDI. However, the convergence of the
PDS simulation is less satisfactory. This is because the simulated TC intensity weakens as the resolution
increases since the simulated maximum diabatic heating becomes smaller. As a result, the R33 keeps
decreasing and the simulation becomes non-convergent. Comparison of the four CP schemes reveals
that the NOCP and BMJ schemes cannot well simulate the TC intensity and TC size; thereby, their
relatively better performance in the convergence of PDS simulation is a result of cancelation between
other variables. A perfect model should be able to yield strong convergent simulation of both the TC
intensity and TC size, and thus strong convergent simulation of the PDS. Compared to the other three
CP schemes, the simulation of the GF scheme is more trustworthy.
Supplementary Materials: The following are available online at http://www.mdpi.com/2073-4433/10/2/74/s1,
Figure S1: Setting of nested model domains for 1 km resolution experiments. The movable domains D2, D3 and
D4 are shown at their initial positions. Figure S2: Temporal evolutions of minimum sea level pressure (MSLP)
in the sensitivity experiments: (a) NOCPs, (b) KFEXs, (c) BMJs, and (d) GFs. The black line is the observation
data from JTWC. Figure S3: Temporal evolutions of maximum 10-meter wind speed (MWS) in the sensitivity
experiments: (a) NOCPs, (b) KFEXs, (c) BMJs, and (d) GFs. The black line is the observation data from JTWC.
Figure S4: Temporal evolutions of the radius of maximum wind at 10-meter height (RMW) in the sensitivity
experiments: (a) NOCPs, (b) KFEXs, (c) BMJs, and (d) GFs. The black line is the observation data from JTWC.Atmosphere 2019, 10, 74 14 of 16
Figure S5: Rainfall rate (inches h-1) from TRMM TMI/PR at 0431 UTC 16 September 2006. Figure S6: Azimuthal-
and time-averaged cross-sections of radial wind (m s-1) in the TC mature stage.
Author Contributions: Data curation, C.M. and J.L.; Formal analysis, C.M., Y.S. and J.L.; Funding acquisition,
T.L.; Investigation, C.M., Y.S., J.L., T.L. and Z.Z.; Methodology, C.M., Y.S., T.L. and Z.Z.; Project administration,
Y.S.; Writing—original draft, C.M.
Funding: This work was jointly supported by China NSF grant 41605072, NSFC grants 41630423, Jiangsu projects
BK20160768, China National Key R&D Program 2015CB453200, NOAA NA18OAR4310298, NSF AGS-1643297,
NSFC grants 41875069, NRL grant N00173-16-1-G906, and NSF 41675077. This work was supported in part by
China Scholarship Council (CSC) under the Grant CSC N201808320282. This is SOEST contribution number 10650,
IPRC contribution number 1363, and ESMC contribution number 249.
Acknowledgments: The authors thank the three reviewers and the academic editor for their constructive
comments which benefit to improve the manuscript.
Conflicts of Interest: The authors declare no conflict of interest.
References
1. Pielke, A., Jr.; Gratz, J.; Landsea, C.W.; Collins, D.; Saunders, M.; Musulin, R. Normalized hurricane damage
in the United States: 1900–2005. Nat. Hazards Rev. 2008, 9, 29–42. [CrossRef]
2. Peduzzi, P.; Chatenoux, B.; Dao, H.; De Bono, A.; Herold, C.; Kossin, J.; Mouton, F.; Nordbeck, O. Global
trends in tropical cyclone risk. Nat. Clim. Chang. 2012, 2, 289–294. [CrossRef]
3. Zhai, A.R.; Jiang, J.H. Dependence of U.S. hurricane economic loss on maximum wind speed and storm size.
Environ. Res. Lett. 2014, 9, 064019. [CrossRef]
4. Emanuel, K.A. Increasing destructiveness of tropical cyclones over the past 30 years. Nature 2005, 436,
686–688. [CrossRef] [PubMed]
5. Vecchi, G.A.; Swanson, K.L.; Soden, B.J. Whither hurricane activity? Science 2008, 322, 687–689. [CrossRef]
[PubMed]
6. Knutson, T.R.; McBride, J.L.; Chan, J.; Emanuel, K.; Holland, G.; Landsea, C.; Held, I.; Kossin, J.P.; Srivastava, A.K.;
Sugi, M. Tropical cyclones and climate change. Nat. Geosci. 2010, 3, 157–163. [CrossRef]
7. Lin, Y.; Zhao, M.; Zhang, M. Tropical cyclone rainfall area controlled by relative sea surface temperature.
Nat. Commun. 2015, 6, 6591. [CrossRef] [PubMed]
8. Sun, Y.; Zhong, Z.; Li, T.; Yi, L.; Hu, Y.; Wan, H.; Chen, H.; Liao, Q.; Ma, C.; Li, Q. Impact of ocean warming
on tropical cyclone size and its destructiveness. Sci. Rep. 2017, 7, 8154. [CrossRef] [PubMed]
9. Lean, H.W.; Clark, P.A.; Dixon, M.; Roberts, N.M.; Fitch, A.; Forbes, R.; Halliwell, C. Characteristics of
highresolution versions of the Met Office Unified Model for forecasting convection over the United Kingdom.
Mon. Weather Rev. 2008, 136, 3408–3424. [CrossRef]
10. Sun, Y.; Yi, L.; Zhong, Z.; Hu, Y.; Ha, Y. Dependence of model convergence on horizontal resolution and
convective parameterization in simulations of a tropical cyclone at greyzone resolutions. J. Geophys. Res. Atmos.
2013, 118, 7715–7732. [CrossRef]
11. Hammarstrand, U. Questions involving the use of traditional convection parameterization in NWP models
with higher resolution. Tellus 1998, 50A, 265–282. [CrossRef]
12. Gerard, L. An integrated package for subgrid convection, clouds and precipitation compatible with
meso-gamma scales. Q. J. R. Meteor. Soc. 2007, 133, 711–730. [CrossRef]
13. Yu, X.; Lee, T.-Y. Role of convective parameterization in simulations of a convection band at grey-zone
resolutions. Tellus 2010, 62, 617–632. [CrossRef]
14. Kotroni, V.; Lagouvardos, K. Evaluation of MM5high resolution real-time forecasts over the urban area of
Athens, Greece. J. Appl. Meteorol. 2004, 43, 1666–1678. [CrossRef]
15. Deng, A.; Stauffer, D.R. On improving 4-km mesoscale model simulations. J. Appl. Meteorol. Climatol. 2006,
45, 361–381. [CrossRef]
16. Fierro, A.O.; Rogers, R.F.; Marks, F.D. The impact of horizontal grid spacing on the microphysical and
kinematic structures of strong tropical cyclones simulated with the WRF-ARW model. Mon. Weather Rev.
2009, 137, 3717–3743. [CrossRef]
17. Sun, Y.; Yi, L.; Zhong, Z.; Ha, Y. Performance of a new convective parameterization scheme on model
convergence in simulations of a tropical cyclone at gray-zone resolutions. J. Atmos. Sci. 2014, 71, 2078–2088.
[CrossRef]Atmosphere 2019, 10, 74 15 of 16
18. Rotunno, R.; Chen, Y.; Wang, W.; Davis, C.; Dudhia, J.; Holland, G.J. Large-eddy simulation of an idealized
tropical cyclone. Bull. Amer. Meteor. Soc. 2009, 90, 1783–1788. [CrossRef]
19. Bryan, G.H.; Wyngaard, J.C.; Fritsch, J.M. Resolution requirements for the simulation of deep moist
convection. Mon. Weather Rev. 2003, 131, 2394–2416. [CrossRef]
20. Grell, G.A.; Freitas, S. A scale and aerosol aware stochastic convective parameterization for weather and air
quality modeling. Atmos. Chem. Phys. Discuss. 2014, 14, 5233–5250. [CrossRef]
21. Joint Typhoon Warning Center Best Track Data. Available online: http://www.metoc.navy.mil/jtwc/jtwc.
html?western-pacific (accessed on 20 December 2018).
22. Paulson, C.A. The mathematical representation of wind speed and temperature profiles in the unstable
atmospheric surface layer. J. Appl. Meteorol. 1970, 9, 857–861. [CrossRef]
23. Beljaars, A.C.M. The parameterization of surface fluxes in large-scale models under free convection. Q. J. R.
Meteor. Soc. 1994, 121, 255–270. [CrossRef]
24. Hong, S.Y.; Noh, Y.; Dudhia, J. A new vertical diffusion package with an explicit treatment of entrainment
processes. Mon. Weather Rev. 2006, 134, 2318–2341. [CrossRef]
25. Lin, Y.-L.; Farley, R.D.; Orville, H.D. Bulk parameterization of the snow field in a cloud model. J. Clim. Appl.
Meteorol. 1983, 22, 1065–1092. [CrossRef]
26. NCEP FNL Operational Model Global Tropospheric Analyses, continuing from July 1999. Available online:
https://rda.ucar.edu/datasets/ds083.2/index.html?hash=!access (accessed on 17 April 2018).
27. Skamarock, W.C.; , and Coauthors. A Description of the Advanced Research WRF Version 3. NCAR Tech.
Note NCAR/TN-4751STR. 2008, p. 113. Available online: http://www.mmm.ucar.edu/people/skamarock/
(accessed on 18 December 2018).
28. Kain, J.S. The Kain-Fritsch convective parameterization: An update. J. Appl. Meteorol. 2004, 43, 170–181.
[CrossRef]
29. Kain, J.S.; Fritsch, J.M. A one-dimensional entraining/detraining plume model and its application in
convective parameterization. J. Atmos. Sci. 1990, 47, 2784–2802. [CrossRef]
30. Betts, A.K. A new convective adjustment scheme. Part I: Observational and theoretical basis. Q. J. R.
Meteor. Soc. 1986, 112, 677–692. [CrossRef]
31. Betts, A.K.; Miller, M.J. A new convective adjustment scheme. Part II: Single column tests using GATE wave,
BOMEX, ATEX and arctic air-mass data sets. Q. J. R. Meteor. Soc. 1986, 112, 693–709. [CrossRef]
32. Janjić, Z.I. The step-mountain eta coordinate model: Further developments of the convection, viscous
sublayer and turbulence closure schemes. Mon. Weather Rev. 1994, 122, 927–945. [CrossRef]
33. Janjić, Z.I. Comments on “Development and evaluation of a convection scheme for use in climate models”.
J. Atmos. Sci. 2000, 57, 3686. [CrossRef]
34. Ma, Z.; Fei, J.; Huang, X.; Cheng, X. Contributions of surface sensible heat fluxes to tropical cyclone. Part I:
evolution of tropical cyclone intensity and structure. J. Atmos. Sci. 2015, 721, 120–140. [CrossRef]
35. Ma, Z.; Fei, J.; Cheng, X.; Wang, Y.; Huang, X. Contributions of surface sensible heat fluxes to tropical cyclone.
Part II: The sea spray processes. J. Atmos. Sci. 2015, 72, 4218–4236. [CrossRef]
36. Carr, L.E.; Elsberry, R.L. Models of tropical cyclone wind distribution and beta-effect propagation for
application to tropical cyclone track forecasting. Mon. Weather Rev. 1997, 125, 3190–3209. [CrossRef]
37. Wang, B.; Li, T. A simple tropical atmosphere model of relevance to short-term climate variations. J. Atmos. Sci.
1993, 50, 260–284. [CrossRef]
38. Sun, Y.; Zhong, Z.; Lu, W.; Hu, Y. Why are tropical cyclone tracks over the western North Pacific sensitive
to the cumulus parameterization scheme in regional climate modeling? A case study for Megi (2010).
Mon. Weather Rev. 2014, 142, 1240–1249. [CrossRef]
39. Gentry, M.S.; Lackmann, G.M. Sensitivity of simulated tropical cyclone structure and intensity to horizontal
resolution. Mon. Weather Rev. 2010, 138, 688–704. [CrossRef]
40. Hazelton, A.T.; Hart, R.E. Hurricane eyewall slope as determined from airborne radar reflectivity data:
Composites and case studies. Wea. Forecast. 2013, 28, 368–386. [CrossRef]
41. Hack, J.J.; Schubert, W.H. Nonlinear response of atmospheric vortices to heating by organized cumulus
convection. J. Atmos. Sci. 1986, 43, 1559–1573. [CrossRef]
42. Black, P.G.; Holland, G.J. The boundary layer of Tropical Cyclone Kerry (1979). Mon. Weather Rev. 1995, 123,
2007–2028. [CrossRef]Atmosphere 2019, 10, 74 16 of 16
43. Gopalakrishnan, S.G.; Marks, F., Jr.; Zhang, X.J.; Bao, J.-W.; Yeh, K.-S.; Atlas, R. The experimental HWRF
system: A study on the influence of horizontal resolution on the structure and intensity changes in tropical
cyclones using an idealized framework. Mon. Weather Rev. 2011, 139, 1762–1784. [CrossRef]
44. Wang, Y. How do outer spiral rainbands affect tropical cyclone structure and intensity? J. Atmos. Sci. 2009,
66, 1250–1273. [CrossRef]
45. Emanuel, K.A. An air–sea interaction theory for tropical cyclones. Part 1: Steady-state maintenance. J. Atmos. Sci.
1986, 43, 585–604. [CrossRef]
46. Xu, J.; Wang, Y. Sensitivity of tropical cyclone innercore size and intensity to the radial distribution of surface
entropy flux. J. Atmos. Sci. 2010, 67, 1831–1852. [CrossRef]
© 2019 by the authors. Licensee MDPI, Basel, Switzerland. This article is an open access
article distributed under the terms and conditions of the Creative Commons Attribution
(CC BY) license (http://creativecommons.org/licenses/by/4.0/).You can also read


