Monitoring Mineral-Associated Organic Matter in Tropical Pastures using Near Infrared Spectroscopy
←
→
Page content transcription
If your browser does not render page correctly, please read the page content below
Brazilian Journal of Analytical Chemistry
2021, Volume 8, Issue 32, pp 78–90
doi: 10.30744/brjac.2179-3425.AR-10-2021

ARTI CLE

 Monitoring Mineral-Associated Organic Matter
 in Tropical Pastures using Near Infrared
 Spectroscopy
 Felipe Bachion de Santana1 , André Marcelo de Souza2*      , Fabiano de Carvalho
 Balieiro , Mirelly Mioranza , Renato Aragão Ribeiro Rodrigues2 , Ronei Jesus Poppi1
         2                  3
                                                                                                                         †
 1
   Instituto de Química, Universidade Estadual de Campinas, Caixa Postal 6154, CEP 13084-971, Campinas, SP,
  Brazil
 2
   Empresa Brasileira de Pesquisa Agropecuária (Embrapa Solos), R. Jardim Botânico, 1024, Rio de Janeiro, RJ,
  CEP 22460-000, Brazil
 3
   Universidade Federal Fluminense, CEP 24020-141, Niterói, RJ, Brazil

 † In memoriam (1961 – 2020)

                                                                 In order to confirm that the mitigation of
                                                                 greenhouse gas emissions could indeed be
                                                                 achieved by farmers, determinations of soil
                                                                 organic carbon (SOC) in total and stabilized
                                                                 fractions are essential, proving the
                                                                 effectiveness of the sustainable practices
                                                                 adopted by the farmer. In this sense, this
                                                                 study proposes an analytical methodology
                                                                 based on near infrared spectroscopy (NIRS)
                                                                 and partial least squares regression (PLSR)
                                                                 as an alternative for the measurement of
                                                                 stabilized and total soil organic carbon
                                                                 (SOC) in agricultural production systems. A
                                                                 set of 122 samples of four different land
uses were sampled and physically fractionated. Total organic carbon for both fractions (mineral-associated
stable fraction and particulated organic matter - labile fraction) were determined by the dry combustion
method. In order to eliminate the extra step regarding soil fractionation to determine the stabilized SOC
content, this study investigated different strategies to build the regression model based on partial least
squares regression for the determination of the stabilized SOC from the total soil fraction. Two strategies
presented the same accuracy as the reference method used to determine the stabilized SOC content in
stabilized fraction, with root mean square error in validation of 1.47 g/dm3. These results indicate that both
strategies proposed can determine simultaneously the total and stabilized SOC from the total soil fraction,
thus eliminating the fractionation phase.

Cite: de Santana, F. B.; de Souza, A. M.; Balieiro, F. C.; Mioranza, M.; Rodrigues, R. A. R.; Poppi, R. J. Monitoring Mineral-
Associated Organic Matter in Tropical Pastures using Near Infrared Spectroscopy. Braz. J. Anal. Chem., 2021, 8 (32), pp 78–90.
doi: http://dx.doi.org/10.30744/brjac.2179-3425.AR-10-2021

Submitted 18 January 2021, Resubmitted 20 March 2021, Accepted 26 April 2021, Available online 21 May 2021.

                                                             78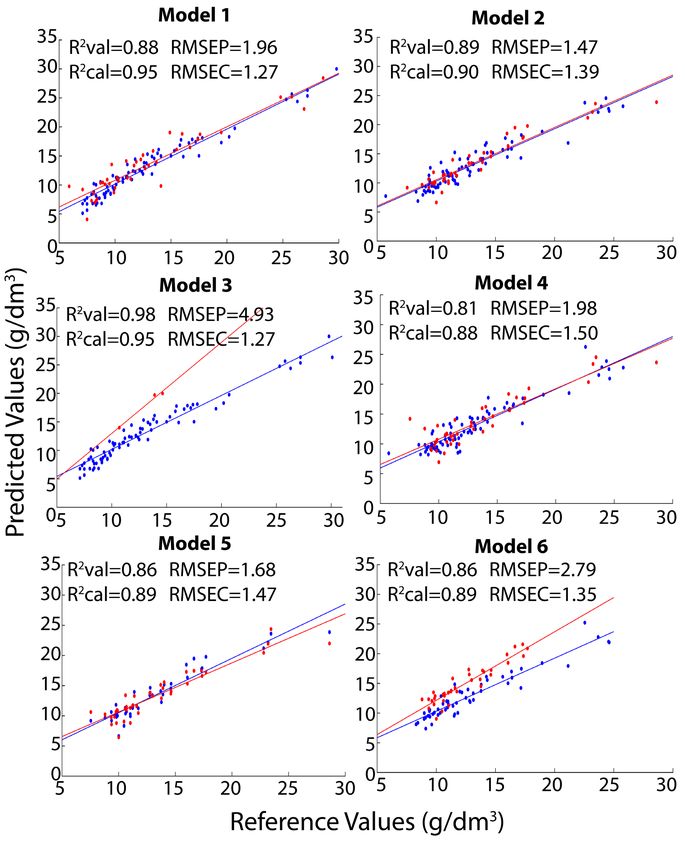
Braz. J. Anal. Chem., 2021, 8 (32), pp 78–90.

Keywords: soil stabilized fraction; soil organic carbon; near infrared spectroscopy; multivariate calibration

INTRODUCTION
    The ABC Plan (Agricultura de Baixa Emissão de Carbono - Low Carbon Agriculture) is part of a strategy
adopted by the Brazilian Government for reducing greenhouse gas (GHG) emissions from agriculture. This
policy aims to encourage the farmers to adopt technologies and sustainable production systems to ensure
GHG emissions reduction [1]. The main goals of the ABC Plan are to expand the integrated crop-livestock-
forest systems to 4 million hectares, and the area with zero-tillage to 8 million ha, rehabilitate 15 million ha
of degraded pastures, planting more 3 million ha of forests and increase the adoption of biological nitrogen
fixation in more 5.5 million ha by 2020.
    In order to attest that the mitigation of GHG emissions could indeed be achieved by farmers, soil
organic carbon (SOC) testing and monitoring would become an essential part of the process to prove
the effectiveness of the adoption of such sustainable practices that support the program. By this way,
the demand for SOC analysis would significantly increase and an analytical methodology to measure the
additionality of SOC sequestration of any technology or project adopted has become a key factor for the
implementation of ABC Plan.
    Soil organic matter (SOM) has been characterized by chemical and physical fractionation. Both tries to
minimize the heterogeneity of the soil organic components in terms of composition, availability to soil biota
and environmental functions [2]. The choice of fractionation methods depends on the study objectives.
Chemical fractionation is based in different solubility of humic substances to alkaline and acid solutions
and normally is used to chemical characterization of specific organic soil compounds or fraction (mainly
humic acid fraction) and land use impacts, while physical fractionation is used to quantify and describe
the compartments of SOM linked to nutrient cycling and C sequestration [2,3]. The relationship between
SOM and soil physical constituents could be studied at two level of organization: SOM associated with
mineral particles (sand, silt, and clay) – particle-size fractionation and SOM associated with macro and
microaggregates – aggregate fractionation approach [4].
    In the tropics, despite the higher SOM turnover, the particulate organic matter (POM) pools (more labile)
make up a relatively small proportion of SOM in comparison to organo-mineral (clay in special) fraction
and the mean residence time, or the half-life of C (in years) increase as fraction size decreases [4]. In
other words, the lower C-turnover of mineral-organic associated matter (clay + silt associated fraction)
comprises the most stable compartment of soil.
    Considering SOC analysis for fertility purposes, the standard sample preparation procedures that have
been practiced for decades (based on Walkley–Black or dry combustion) are able to assess the bulk
organic carbon in the soil sample, without considering the proportion of these labile and stable fractions
[5,6]. This means that new steps regarding to soil fractionation are necessary to determine the labile and
stable C.
    However, all reference methods to fractionate soil organic carbon are cost intensive and laborious. The
combination of an extra soil fractionation step with traditional method of SOC analysis (Walkley–Black or
dry combustion) would result in an expensive, time-consuming and waste generation ~ 600,000 L/year in
Brazil [5]; consequently, restricts their use on a large scale [5,7].
    This procedure is very contradictory, since on the one hand the GHG emissions could be mitigated by
the adoption of the ABC Plan, on the other hand more pollution could be generated by increasing demand
for SOC analysis that would negatively impact the environment. All these factors could eventually restrict
the implementation of ABC Plan, requiring drastic changes in the methodologies for SOC analysis.
    The implementation of near infrared spectroscopy (NIRS) technologies could become an effective
solution to overcome these methodological issues that have been blocking the ABC Plan from reaching
the next level. Several papers and documents that have been published over the last decade, such as
those produced by FAO [8], recommend the use NIRS for SOC analysis [9–12].

                                                      79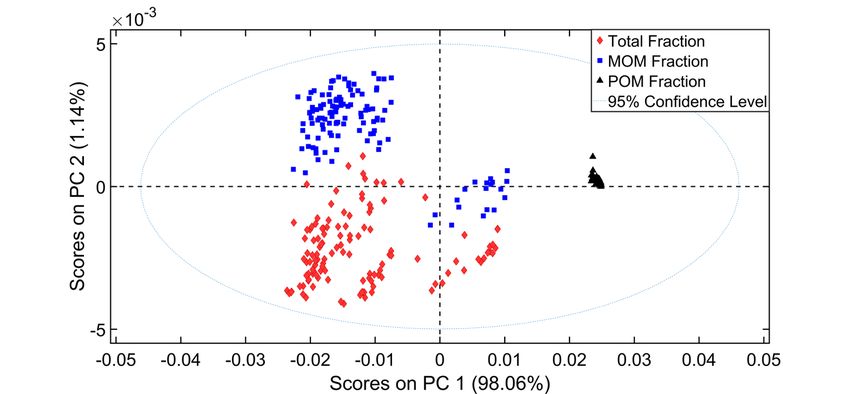
de Santana, F. B.; de Souza, A. M.; Balieiro, F. C.; Mioranza, M.; Rodrigues, R. A. R.; Poppi, R. J.

    In a previous study, de Santana and collaborators [5] compared the accuracy and precision in
SOM determinations by the Walkley–Black and NIR methodology using a vast vis-NIR soil spectral
library (~ 43,000 samples). The methodology developed was validated by a proficiency assay for fertility
laboratories coordinated by Embrapa soils (Brazilian Agricultural Research Corporation). The results
obtained shows that the vis-NIR spectroscopy can determinate the SOM content in Brazilian soils with the
same accuracy and precision than the Walkley–Black method [5]. It is important to highlight that the SOC
analysis was performed on the total fraction of the sample (bulk soil).
    In other study, Jaconi and collaborators [12] evaluated and optimized the use of NIRS to predict SOC
content in fractions with the constraint that the carbon fractions (labile and stabilized) should add up to
100% (total organic carbon content). Through employing log-ratio transformation, it was demonstrated that
the NIRS models could be suitable to predict soil carbon fractions with high accuracy in a wide range of
soil types and land-use types.
    Following the studies developed by the group, the present study aims to contribute to the discussion
regarding analytical methodology to quantify the most stable fraction of SOC, contributing to the
implementation of ABC Plan. In this paper we proposed an effective, fast, cheap, and sustainable
methodology without extra sample preparation to quantify the mineral associated C content in soils under
sustainable management employing NIRS and partial least squares regression (PLSR). In addition, another
innovation of this article is the use of different strategies to improve the SOC stabilized determinations from
the NIR spectra of bulk soil.

MATERIAL AND METHODS
Study site
   The experimental area is in a thematic center of Embrapa (Brazilian Agricultural Research Corporation,
Embrapa), Embrapa Dairy Cattle, Coronel Pacheco’s Municipality, Minas Gerais State, Brazil, (21°33′22′′S,
43°06′16′′W, an altitude of 410 m). According to the Köppen climate classification, the region fits the Cwa
type (mesothermal), with a well-defined dry season (autumn-winter) and rainy season (spring-summer)
[13]. Annual rainfall (average of 30 years) is around 1,600 mm, of which approximately 90% occurs in
the summer season. Annual temperatures varied from 24.3 to 31.7 ºC (maximum) and 11.4 to 19.7 ºC
(minimum). The soil class of the experimental area is “Latossolo Vermelho Amarelo distrófico” according
to the Brazilian Soil Classification System [14], with a clay texture which corresponds to Typic hapludox
according to the Soil Survey Manual [15]. The local relief is characterized by mountainous topography with
a slope of approximately 30%.

Land uses and characterization
   A set of 122 samples of four different types of land were collected from (1) silvopastoral system (SPS),
(2) managed pasture of Brachiaria decumbens (brachiaria managed pasture -BMP), (3) degraded pasture
of brachiaria (BDP), and (4) native vegetation (NV). The SPS was established in November 1997 and it
is composed with the tropical perennial grass brachiaria. The tree component of SPS was composed by
the species of Eucalyptus grandis Hill ex Maiden, Acacia mangium Willd (acacia) and Mimosa artemisiana
Heringer & Paula (mimosa), all of them planted alternately in the North/South direction (planting row)
aiming to prevent surface erosion. In the planted row, seedlings were planted with 3 m of spacing.
   The objective of nitrogen-fixing species (acacia and mimosa) in SPS is to provide shade or shelter to
the animals and nitrogen biologically fixed (N2) and other nutrients, to the eucalyptus and brachiaria. The
BMP maintain reasonable grass productivity due to appropriate grazing regime. The history of the use of
correctives and fertilizers used in this area is organized in the Table I.

                                                                80
Braz. J. Anal. Chem., 2021, 8 (32), pp 78–90.

                 Table I. Management history of the Silvopastoral System in Coronel Pacheco - MG

       Year                Management

                           At the moment of the introduction of the trees, the guandu beans (Cajanus cajan)
       1997                were planted, among the wooded strips, in order to be incorporated into the soil, as
                           green manure, before the flowering of the plants.

       1998 - 2000         The pastures remained closed to guarantee the initial growth of the tree species.

                           The pastures were used for the grazing of dry cows, respecting periods of occupation
       2001 - 2002
                           of 5 days and resting of 45 days.

                           The grazing management was carried out under rotational stocking and without
       2003 - 2010
                           fertilization.

                           Under continuous stocking and with application of 64 kg/ha of N and K2O and 16 kg/
       2011 - 2013
                           ha of P2O5 per year, divided into two equal applications during the summer.
                           There were no additional fertilizer or corrective applications, characterized by a low
       2013 - 2016         input and extensive system (low rate of grazing and lenient grazing). By this way we
                           guarantee the sustainability of the pasture after 18 years of implantation.

   The DPB was characterized to presents low productivity for animal grazing due to high weed infestation,
bare soil and/or soil erosion. The NV belongs to the ecosystem of the Atlantic Forest [16] without any
exploitation or anthropic interference at least in the last 40 years.

Soil sampling design
   The soil sampling strategy was designed for two main purposes: soil organic matter physical fractionation
and to study the soil C distribution in the soil profile. As all the systems (SPS, BMP, BDP and NV) were
immersed in a mountainous landscape we divided them into three sub-areas considering the slope of the
terrain: upper, mid and lower third of the slope.
   In the SPS, the tree component has a great influence on soil chemical and physical attributes. To cover
these influences, we select three different positions to collect soils samples in SPS: inside the ranks of
trees, tree border (under canopy influence) and the middle of two ranks. Under BMP, BDP and NV three
and under SPS nine trenches were opened. The soil samples were collected in seven different depths in
each area for assessment of 0-10, 10-20, 20-30, 30-40, 40-60, 60-80 and 80-100 cm of soil layers.

Soil sample preparation
   All soil samples were oven dried at 40 °C for 48 h, then a rubber mallet was used to break the soil
clusters, and for the granulometry standardization the soils were sieved using a 2 mm sieve [6].

Physical fractionation
   The bulk soil samples were physically fractionated according to the procedure of Cambardella & Elliott
(1992) [2] with some adaptations in the sample weight [17]. Briefly, 20 g of soil were placed in plastic
bottles and 60 mL of NaOH 1.0 g L-1 was added. The mixture was shaken for 16 h in a horizontal shaker,
at 160 oscillations min-1. Then, the entire content was placed on a 53 μm sieve and washed with a weak jet
of demineralized water. The material retained on the sieve is defined as particulate organic matter (POM)
(> 53 μm) known as labile fraction; on the other hand, the material that passed the sieve is defined as the
mineral-associated organic matter (MOM), also known as stabilized fraction. Both fractions were dried at
60 °C.

                                                           81
Monitoring Mineral-Associated Organic Matter in Tropical Pastures using Near Infrared Spectroscopy Soil organic carbon analysis After the physical fractionation step, the soil samples were grounded to a fine powder (
Braz. J. Anal. Chem., 2021, 8 (32), pp 78–90.

External parameter orthogonalization (EPO)
   The EPO method aims to remove the effect of external parameters in spectra. In this study we adapted
the EPO to remove the labile SOC fraction from the total soil fraction (bulk). The EPO method will remove
the labile SOC fraction (POM) from the bulk by projecting the NIR spectra into a portion of spectral space
which is orthogonal to POM spectra [25,26].
   The EPO method assumes that spectra matrix X can be decomposed into two subspaces, a useful
subspace related to target chemical responses and a parasitic component related to the part of the
spectra that is not related to the target chemical responses as illustrated in Equation 2

                                                                  Equation 2

                             where      is an independent residual matrix.

   The initial step to build the EPO model is to calculate (labile fraction/POM), which is the difference
between the spectra of total and the stabilized fractions (MOM). In the next step, the PCA model is build
using and are obtained the scores and the loadings , and using these loadings we can calculate the
scores (for new samples (validation samples). By multiplying is obtained , which is the part of the soil
spectra related to POM fraction. Considering that is irrelevant, it is possible to calculate the stabilized
fraction by subtracting the original spectra from (POM fraction) [27]. Finally, the PLSR model is built using
the matrix (spectra of MOM fraction) and the SOC content in MOM fraction.

Strategies to build the PLSR models
   The 122 soil samples (all set) were firstly organized in ascending order of concentration and then for
each group of three samples in sequence, the first two were selected to be used in calibration set (66.67%)
and the remaining one was used in the validation set (33.33%). Two references PLSR model (Classical
strategy) were built, and four different strategies were evaluated to determine the SOC content in MOM
fraction from the NIR spectra of bulk soil (total fraction). These strategies were proposed to avoid the extra
step regarding to soil fractionation.
   The classical strategies to determine SOC content in the bulk soil and MOM fractions were named
Model 1 and Model 2 (Figure 1). In the Model 1, the matrix (X1) was measured on soil total fraction (bulk).
About 67% of these samples were used in calibration (Xcal1) and 33% of these samples were used in
validation (Xval1). Reference values (Ycal1 and Yval1) were the SOC measured in the soil total fraction. In the
Model 2, the matrix (X2) was measured on MOM fraction. Again about 67% of these samples were used
in calibration (Xcal2) and 33% of these samples were used in validation (Xval2). Reference values (Ycal2 and
Yval2) was the SOC measured in the MOM fraction.

                                Figure 1. Classical strategy to build PLS models in both
                                         subsets: total and stabilized fractions.

                                                          83
de Santana, F. B.; de Souza, A. M.; Balieiro, F. C.; Mioranza, M.; Rodrigues, R. A. R.; Poppi, R. J.
The four strategies evaluated here to determine the SOC content in MOM fraction (Y2) from the bulk
soil spectra (X1) were named Model 3, Model 4, Model 5, and Model 6, as represented in Figure 2. In the
Model 3, the calibration samples (Xca11 and Ycal1) were the spectra measured on soil total fraction and the
SOC measured in the soil total fraction, in other words is the calibration of Model 1. While the validation
samples (Xval2 and Yval2) were spectra measured on MOM fraction and the SOC measured in the MOM
fraction, that is the validation of Model 2.
Figure 2. Strategies adopted to determine the SOM content in
the MOM fraction from the bulk soil spectra.
In Model 4, the calibration dataset was composed by the spectral data set Xcal1 (obtained on soil total
fraction) and the Ycal2 (SOC measured in the MOM fraction), the validation dataset is formed by the same
logic, using Xval1 and Yval2. The predicted value, Ypred4, correspond to the SOC content in MOM fraction.
In Model 5, it was used the Model 1 to determine Ypred1, and then, a linear correlation between the
reference values of stabilized Ycal2 and total soil organic carbon Ycal1 were used to determine Ypred5, which
is the SOC in MOM fraction. Finally, in the Model 6, it was used the EPO methodology to decompose the
XTotal fraction in to XMOM and XPOM, then it was used the XMOM fraction to build the PLSR model. To build the EPO
model, about 30% of the calibration samples were used.
RESULTS AND DISCUSSION
The average of the NIR spectra of the total, POM and MOM fractions of soil are shown in Figure 3.
It is possible to observe that the spectra of total and MOM fractions are very similar, while the spectra
of POM fraction are very different due to majority presence of sand [28]. The spectra of total and MOM
fractions show essentially absorptions at 1200-1500, 1800–2000 and 2200–2400 nm, common to most
soil NIR spectra already reported in several publications [5,28]. The NIR spectra contain fewer absorptions
bands when compared to MIR spectroscopy, due to the broad and overlapping bands, making it difficult
to interpret. However, NIR spectra are influenced by the information of organic and inorganic components
present in the soil, including SOC content.
84Braz. J. Anal. Chem., 2021, 8 (32), pp 78–90.
Figure 3. NIR spectra of total, MOM and POM fractions.
A visual inspection along the full spectrum suggests that there is no difference in the NIR spectra of the
total and MOM fractions, but a refined comparation between these 3 fractions can be performed through
the analysis of scores values of PCA [20]. The scores values of PCA are presented in Figure 4, showing
a clear differentiation between POM and others fractions along the PC1 axis, while the PC2 shows the
difference between the MOM and total fraction.
Figure 4. Scores values of PCA from total, MOM and POM soil fractions.
The scores of the total and MOM fractions are not grouped, indicating that these spectra are different
and consequently a PLSR model build using the NIR spectra of the total fraction is not able to directly
determine the content of SOC in MOM fraction. To solve this problem, we used the four strategies previously
described, thus eliminating the additional soil fractionation step.
Figure 5 presents the scatter plots showing the reference versus predicted values by each strategy
proposed (Models 1 to 6), the accuracy parameters and the number of outliers samples obtained for each
model are organized in Table II. The efficiency in determine the stabilized SOC by each strategy will be
compared to the PLSR model build using the NIR spectra of stabilized fraction and the SOC content in this
fraction (Model 2).
85Monitoring Mineral-Associated Organic Matter in Tropical Pastures using Near Infrared Spectroscopy
Figure 5. Scatter plots of reference versus PLSR predict values for each reference model and all strategies proposed.
86Braz. J. Anal. Chem., 2021, 8 (32), pp 78–90.
Table II. Accuracy parameters and excluded samples for the strategies proposed
No. of No. excluded
Strategy RMSE (g/dm3) R2
samples samples
Calibration 81 1.27 0.95 1
Model 1
Validation 41 1.96 0.88 0
Calibration 81 1.39 0.90 1
Model 2
Validation 41 1.47 0.89 0
Calibration 81 1.27 0.95 1
Model 3
Validation 41 - - 38
Calibration 81 1.50 0.88 1
Model 4
Validation 41 1.98 0.81 1
Calibration 81 1.47 0.89 1
Model 5
Validation 41 1.68 0.86 0
Calibration 54 1.35 0.89 0
Model 6
Validation 41 2.79 0.86 5
It is observed that the strategy Model 3 shows a poor performance since 38 of the 41 validation samples
were considered outliers by the PLSR model. This result was already expected, because as observed by
the PCA scores of Figure 4, the spectra of SOC in MOM fractions are significantly different, resulting in
outlier samples.
The strategies Model 4 and Model 5 presented slopes of the calibration (blue) and validation (red)
lines equivalent, as well as the values of RMSEC and RMSEP, indicating a good concordance between
the calibration and validation sets. Also, these two strategies showed results very similar to the Model 2,
reference model to determine the stabilized fraction. The Model 6 presented the RMSEP value almost
twice times higher than Model 2, indicating lower accuracy compared to the reference model.
However, it is noteworthy that the comparison of the regression models should not be based only in a
visual inspection on the scatter plots of reference versus predict values and in the accuracy parameters. A
statistical test must be applied to verify if there are significant differences between the strategies proposed
(Models 3 to 6) and the reference model (Model 2).
Many authors compare the regression models using an F-test, this test consisted in divided the RMSEPA
by RMSEPB and then compare the value with an F-distribution (Fisher–Snedecor distribution) with nA and
nB degrees of freedom [29]. However, this test is conservative, requiring the independence of prediction
errors between models, which cannot be guaranteed since in general we can have tendency (positive
or negative) in both models. By this way, in this study we used the randomization test suggested by
H. van der Voet [29], to compare the errors (based on RMSEP) in the determinations of the stabilized
SOC by each strategy in the validation set. The main advantage of this test is that assumptions about
normality or homoscedasticity of the data are not required (distribution-free). A MATLAB code for applying
the randomization test in binary comparations can be found in [30], more details about this test can be
found in [29,30].
The randomization test was performed by binary comparisons between each strategy proposed
and the reference model - Model 2. There is no reason to compare the strategy Model 3 with the
reference calibration model, since more than 90% of the samples were excluded from the validation
87de Santana, F. B.; de Souza, A. M.; Balieiro, F. C.; Mioranza, M.; Rodrigues, R. A. R.; Poppi, R. J.
set, thus only 3 binary comparisons were performed. The randomization test was carried out with a
significance level of probability of 0.05, the null (H0) and alternative (H1) hypothesis evaluated were:
H0: RMSEPstrategy = RMSEPReference calibration model (accuracy is equal);
H1: RMSEPstrategy ≠ RMSEPReference calibration model (accuracy is not equal).
The results obtained for each randomization test are organized in Table III. The strategies Model 4
and Model 5 used to determine the stabilized SOC from the NIR spectra of total fraction shows the same
predictive accuracy (p-value > 0.05) to the reference PLSR model built using the NIR spectra of MOM
fraction. In other words, the strategies Model 4 and Model 5 are able to determine stabilized SOM from
the NIR spectra of bulk soils with the same accuracy of the reference model, thus eliminating the extra
step regarding soil fractionation to determine the stabilized SOC. It is worth mentioning that the Model 6,
which uses the EPO method to remove the liable fraction from the total soil fraction spectra, did not present
results as good as the reference model, however it is observed that this strategy was able to minimize the
prediction errors in stabilized SOC from the NIR spectra of total soil fraction.
Table III. p-values of randomization t-test for all binary comparations
Binary comparation p-value for validation set
Model 4 x Model 2 0.12
Model 5 x Model 2 0.38
Model 6 x Model 2 1x10⁻⁵
CONCLUSIONS
This study presented four different strategies to determine the stabilized SOC content using the NIR
spectra of total soil fraction (bulk soil) and multivariate calibration model based on PLSR. Among the four
strategies proposed two of them (Models 4 and 5) could determine the stabilized SOC content with the
same accuracy of the PLSR reference model, thereby eliminating the extra soil fractionation step that is
essential to the monitoring of the carbon sequestration potential by agroecosystems that adopt ABC Plan
technologies.
Based on the results obtained and all the advantages reported in this study, this environmentally friendly
methodology can contribute for the implementation of the National Plan for Low Carbon Emission in
Agriculture (ABC Plan), since the methodology could reduce the cost, time required, and wastes generated
in SOC determinations.
In Memoriam
On the 25th of April, 2020, prof. Ronei Jesus Poppi passed away having the same destiny as millions
of people who have lost their lives along the sanitarian crisis that afflicted the world. Ronei was a good
friend, a shy and sweet person who was always surrounded by his students. His influence is felt on the
field he has devoted his career. He will be sorely missed by his family, friends and the worldwide scientific
community.
Conflicts of interest
There are no conflicts to declare.
88Braz. J. Anal. Chem., 2021, 8 (32), pp 78–90.
Acknowledgements
The authors thank “Instituto Nacional de Ciência e Tecnologia de Bioanalítica” (INCTBio), “Conselho
Nacional de Desenvolvimento Científico e Tecnológico” CNPq, Brazil, [465389/2014-7; 303994/2017-
7; 307434/2020-6], “Coordenação de Aperfeiçoamento de Pessoal de Nível Superior” (CAPES, Brazil,
Finance Code 001) and “Fundação de Amparo à Pesquisa do Estado de São Paulo” [FAPESP, Brazil,
2014/508673] for financial support.
REFERENCES
1. Ministério da Agricultura, Pecuária e Abastecimento. Plano Setorial de Mitigação e Adaptação às Mudanças
Climáticas para Consolidação da Economia de Baixa Emissão de Carbono na Agricultura – PLANO
ABC. Brasília: MAPA/ACS, 2012. Available at: http://www.agricultura.gov.br/assuntos/sustentabilidade/
plano-abc/plano-abc-agricultura-de-baixa-emissao-de-carbono [Accessed 16 January 2021].
2. Cambardella, C. A.; Elliott, E. T. Soil Sci. Soc. Am. J., 1992, 56, pp 1-777 (https://doi.org/10.2136/
sssaj1992.03615995005600030017x).
3. Roscoe, R.; Machado, P. L. O. de A. Fracionamento Físico do Solo em Estudos da Matéria Orgânica.
Embrapa agropecuária Oeste, Dourados, MS, 2002.
4. Feller, C.; Beare, M. H. Geoderma, 1997, 79, pp 69-116 (https://doi.org/10.1016/S0016-7061(97)00039-6).
5. de Santana, F. B.; de Souza, A. M.; Poppi, R. J. Sci. Total Environ., 2019, 658, pp 895-900 (https://doi.
org/10.1016/j.scitotenv.2018.12.263).
6. Teixeira, P. C.; Donagemma, G. K.; Fontana, A. I.; Teixeira, W. G. Manual de métodos de analise de solo.
Embrapa, Brasília, 2017. Available at: https://ainfo.cnptia.embrapa.br/digital/bitstream/item/181717/1/
Manual-de-Metodos-de-Analise-de-Solo-2017.pdf [Accessed 16 January 2021].
7. Rossel, R. A. V.; Hicks, W. S. Eur. J. Soil Sci., 2015, 66, pp 438-450 (https://doi.org/10.1111/ejss.12237).
8. Lefèvre, C.; Rekik, F.; Alcantara, V.; Wiese, L. Soil Organic Carbon: the hidden potential. Food and
Agriculture Organization (FAO). Rome, 2017. Available at: http://www.fao.org/3/i6937e/i6937e.pdf
[Accessed 16 January 2021].
9. de Santana, F. B.; de Souza, A. M.; Poppi, R. J. Spectrochim. Acta - Part A Mol. Biomol. Spectrosc.,
2018, 191, pp 454-462 (https://doi.org/10.1016/j.saa.2017.10.052).
10. Stenberg, B.; Rossel, R. A. V.; Mouazen, A. M.; Wetterlind, J.; Mouazen, M.; Wetterlind, J. Adv. Agron.,
2010, 107, pp 163-215 (https://doi.org/10.1016/S0065-2113(10)07005-7).
11. Rossel, R. A. V.; Behrens, T.; Ben-Dor, E.; Brown, D. J.; Demattê, J. A. M.; Shepherd, K. D.; Shi, Z.;
Stenberg, B.; Stevens, A.; Adamchuk, V.; et al. Earth-Science Rev., 2016, 155, pp 198-230 (https://doi.
org/10.1016/j.earscirev.2016.01.012).
12. Jaconi, A.; Poeplau, C.; Ramirez-Lopez, L.; Van Wesemael, B.; Don, A. Eur. J. Soil Sci., 2019, 70, pp
127-139 (https://doi.org/10.1111/ejss.12761).
13. Alvares, C. A.; Stape, J. L.; Sentelhas, P. C.; De Moraes Gonçalves, J. L.; Sparovek, G. Meteorol.
Zeitschrift, 2013, 22, pp 711-728 (https://doi.org/10.1127/0941-2948/2013/0507).
14. EMBRAPA Sistema brasileiro de classificação de solos; Solos, E., Ed.; 5th ed.; Rio de Janeiro - Brasil,
2018.
15. United States Department of Agriculture (USDA), Natural Resources Conservation Service. Keys to
soil taxonomy, 12th Ed., Washington, 2014. Available at: https://www.nrcs.usda.gov/wps/portal/nrcs/
detail/soils/survey/class/taxonomy/?cid=nrcs142p2_053580 [Accessed 16 January 2021].
16. Ab’Sáber, A. N. Domínios morfoclimáticos e províncias fitogeográficas do Brasil. “Departamento de
Geografia, Universidade de São Paulo”, 1967.
17. Bongiovanni, M. D.; Lobartini, J. C. Geoderma, 2006, 136, pp 660-665 (https://doi.org/10.1016/j.
geoderma.2006.05.002).
18. Savitzky, A.; Golay, M. J. E. Anal. Chem., 1964, 36, pp 1627-1639 (https://doi.org/10.1021/ac60214a047).
19. Bro, R.; Smilde, A. K. Anal. Methods, 2014, 6, pp 2812-2831 (https://doi.org/10.1039/c3ay41907j).
20. Pasquini, C. Anal. Chim. Acta, 2018, 1026, pp 8-36 (https://doi.org/10.1016/j.aca.2018.04.004).
89Monitoring Mineral-Associated Organic Matter in Tropical Pastures using Near Infrared Spectroscopy
21. Geladi, P.; Kowalski, B. R. Anal. Chim. Acta, 1986, 185, pp 1-17 (https://doi.org/10.1016/0003-
2670(86)80028-9).
22. Haaland, D. M.; Thomas, E. V. Anal. Chem., 1988, 60, pp 1193-1202 (https://doi.org/10.1021/
ac00162a020).
23. Westad, F.; Marini, F. Anal. Chim. Acta, 2015, 893, pp 14-24 (https://doi.org/10.1016/j.aca.2015.06.056).
24. American Society for Testing Materials. ASTM E1655-17. Standard Practices for Infrared Multivariate
Quantitative Analysis. West Conshohocken, PA, US, 2017.
25. Roger, J. M.; Chauchard, F.; Bellon-Maurel, V. Chemom. Intell. Lab. Syst., 2003, 66, pp 191-204
(https://doi.org/10.1016/S0169-7439(03)00051-0).
26. de Santana, F. B.; de Giuseppe, L. O.; de Souza, A. M.; Poppi, R. J. Microchem. J., 2019, 145, pp
1094-1101 (https://doi.org/10.1016/j.microc.2018.12.027).
27. Minasny, B.; McBratney, A. B.; Bellon-Maurel, V.; Roger, J. M.; Gobrecht, A.; Ferrand, L.; Joalland, S.
Geoderma, 2011, 167-168, pp 118-124 (https://doi.org/10.1016/j.geoderma.2011.09.008).
28. Stenberg, B.; Rossel, R. A. V.; Mouazen, M.; Wetterlind, J. Adv. Agron., 2010, 107, pp 163-215 (https://
doi.org/10.1016/s0065-2113(10)07005-7).
29. van der Voet, H. Chemom. Intell. Lab. Syst., 1994, 25, pp 313-323 (https://doi.org/10.1016/0169-
7439(94)85050-X).
30. Olivieri, A. C. Anal. Chim. Acta, 2015, 868, pp 10-22 (https://doi.org/10.1016/j.aca.2015.01.017).
90You can also read