Root characteristics of spring wheat under drip irrigation and their relationship with aboveground biomass and yield
←
→
Page content transcription
If your browser does not render page correctly, please read the page content below
www.nature.com/scientificreports
OPEN Root characteristics of spring
wheat under drip irrigation
and their relationship
with aboveground biomass
and yield
Rui Chen, Xing‑peng Xiong & Wen‑han Cheng*
The objectives of this two-year field experiment were (1) to study the effect of irrigation frequency
and irrigation amount on the root characteristics of drip-irrigated spring wheat (Triticum aestivum L.)
and (2) to determine the relationship between these root characteristics and aboveground biomass
and yield. A split-plot design was used with two wheat cultivars (Xinchun 6 and Xinchun 22). The
irrigation treatments consisted of three irrigation intervals (D1, 13 d; D2, 10 d; and D3, 7 d) and three
water amounts (W1, 3750 m3/ha; W2, 6000 m3/ha; and W3, 8250 m3/ha). The results showed that
root length density (RLD) and root weight density (RWD) were greater at 0–20 cm than at 20–40 cm
at flowering. The RLD was greater in D1 and D2 than in D3 in the shallow soil layer and did not differ
among the treatments with different irrigation frequencies in deep soil. The RLD at the 0–20 cm depth
of W3 was 17.9% greater than that of W2 and 53.8% greater than that of W1, and the RLD trend was
opposite at the 20–40 cm depth. The root–shoot ratio was significantly higher in D2 than in the other
treatment, whereas the RLD, RWD, leaf Pn and LAI were significantly greater in D3. Leaf Pn and LAI
both increased as the irrigation amount increased. Regression analysis showed a natural logarithmic
relationship between RWD and aboveground biomass (R2 > 0.60, P < 0.05) and binomial relationships
of the RWD at 0–20 cm depth (R2 = 0.43, P < 0.05) and the RLD at 20–40 cm depth (R2 = 0.34, P < 0.05)
with grain yield. We found that with the optimum irrigation amount (W2), increasing drip irrigation
frequency can increase wheat root length and root weight and aboveground biomass accumulation,
thereby improving yield and water use efficiency.
The availability of water for agriculture is decreasing worldwide. As a consequence, agricultural researchers are
being asked to identify ways to produce more food with less w ater1–3. Drip irrigation is one of the best methods
for improving agricultural water use efficiency (WUE)4,5. More than 3.7 million ha of cropland is drip irrigated
worldwide6. Although most commonly used for horticultural crops, drip irrigation technology has now been
adapted for many row crops, including cotton, maize, and w heat7–10.
Roots take up water and nutrients that are essential for crop growth. The importance of roots increases under
water-limited conditions11,12. Root growth and spatial distribution are sensitive to soil water content13. Some
drought-resistant crops overcome moisture stress by adjusting their root distribution when water availability is
limited14. Irrigation methods have a significant effect on the root distribution in a soil profile15. In flood-irrigated
systems, water is uniformly applied over a broad area of soil. This results in a deep and wide root distribution.
In contrast, in drip-irrigated systems, water is applied to only a small part of the soil volume, and plant roots are
mainly concentrated in this wetted part. Drip irrigation also has an effect on root distribution. In sweet corn, the
root length density was found to be highest with surface drip irrigation at 0–30 cm depth, while the root length
density was higher with underground drip irrigation below 30 cm16. Notably, the increase in root mass below
30 cm did increased the total dry matter on the ground.
Irrigation frequency also has a significant effect on root development. For example, the in zone for root uptake
moved upward as the irrigation frequency of winter wheat increased3. Conversely, when irrigation frequency
was reduced, bent grass developed a larger and deeper root system when irrigation frequency was r educed17.
Jingchu University of Technology, Jingmen 448000, Hubei, China. *email: kaven_53@163.com
Scientific Reports | (2021) 11:4913 | https://doi.org/10.1038/s41598-021-84208-7 1
Vol.:(0123456789)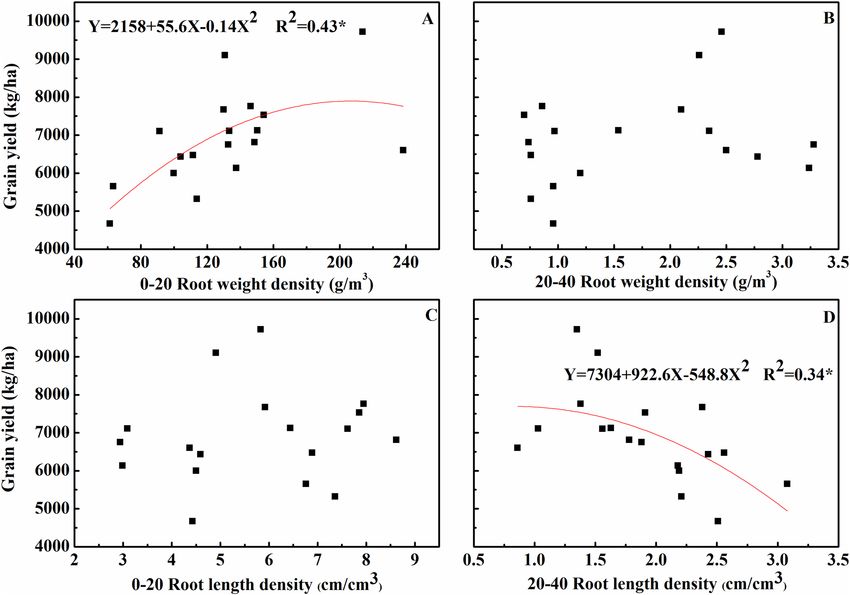
www.nature.com/scientificreports/
Mean temp Rainfall
(°C) (mm)
2013 2014 2013 2014
April 14.3 12.5 38.1 44.5
May 19.3 20.8 26.0 22.2
June 23.5 24.8 29.2 7.90
July 25.0 24.9 14.4 2.90
Table 1. Monthly mean temperature and monthly rainfall at Shihezi from April 1 until harvest in 2013 and
2014.
Year
Variable 2013 2014
Clay (%) 21 ± 1.35 20 ± 1.05
Silt (%) 35 ± 2.42 33 ± 2.31
Sand (%) 44 ± 1.38 47 ± 1.56
pH 7.54 ± 0.54 7.21 ± 0.35
Organic matter (mg/kg) 24.6 ± 1.49 25.7 ± 1.03
Alkaline-N (mg/kg) 75.13 ± 3.57 71.39 ± 2.11
Olsen-P (mg/kg) 21.58 ± 2.01 22.64 ± 1.97
Available K (mg/kg) 157 ± 12 170 ± 14
Bulk density (g/cm3) 1.27 ± 0.27 1.15 ± 0.17
Saturated volumetric water content (%) 23.7 ± 0.5 22.9 ± 1.4
Table 2. Selected soil physical and chemical properties (0–60 cm depth) in the experiment plots.
Researchers have performed experiments on the distribution and growth of sorghum roots in response to irriga-
tion frequency. To reduce the effect of other factors on root growth, an experiment was conducted in a room with
controlled temperature and artificial lighting. The results showed that root penetration depth was not limited,
but root length density was proportionally lower in the upper profile of the less frequently irrigated treatments18.
Wheat is one of the world’s most important agricultural crops and is vital for food security19. Researchers
have predicted that wheat yields must double by 2050 to meet future demands (FAO, 2009). Wheat is produced
in many arid and semiarid regions around the world, including the Xinjiang Uyghur Autonomous Region in
northwest China. Water shortages are a major constraint on wheat production in these areas. Irrigation is often
needed to ensure high yields and stable production. The Food and Agriculture Organization of the United
Nations estimates that nearly 8% of irrigated land uses sprinklers or microirrigation (FAO, 2009). Wheat is
grown on 1.14 × 10⁶ ha in Xinjjiang Province. Two-thirds of this area is drip irrigated with water amounts ranging
between 3000 and 7500 m3/ha. However, little is known about root growth and its relationship to water relations
and the yield of drip-irrigated wheat in Xinjiang Province.
The objectives of these two years of field experiments were (1) to study the effect of irrigation frequency and
irrigation amount on the root characteristics of drip-irrigated spring wheat (Triticum aestivum L.) and (2) to
determine the relationship between these root characteristics and aboveground biomass and yield.
Materials and methods
Experimental site and experimental design. The field experiment was conducted during the 2013 and
2014 growing seasons at the Shihezi University Agronomy Experiment Station, Xinjiang Province, China (44°
26.5′ N, 86° 01′ E). The climate at the site climate was introduced in a previous paper20. The mean temperature
during the wheat growing season was 20.6 °C during both growing seasons20. The precipitation amounts during
the wheat growing seasons were 108 mm in 2013 and 78 mm in 2014 (Table 1). The soil type is gray desert soil
according to the Chinese classification system and a Calcaric Fluvisol according to the FAO/UNESCO system
(FAO, 1998). The physicochemical properties of the soil were similar in both years (Table 2).
A split-plot design was used with the drip irrigation interval as the main plot factor and irrigation amount
as the split-plot factor. The irrigation intervals were 13 d (D1), 10 d (D2), and 7 d (D3). The irrigation amounts
were 3750 m3/ha (W1), 6000 m3/ha (W2), and 8250 m3/ha (W3). Every irrigation amount is shown in Table 3.
The treatments were replicated three times.
The spring wheat (Triticum aestivum L.) cultivar Xinchun 6 used in both 2013 and 2014. This cultivar was
chosen because it performed well under drip irrigation in preliminary tests. A second spring wheat cultivar, Xin-
chun 22, was included in the experiment in 2014. The seeding rate of both cultivars was 618 kg/ha. Preliminary
studies indicated that this rate resulted in the highest yield of drip-irrigated spring wheat at the experimental site.
The area of each main plot was 18.9 m2. The area of each split-plot was 6.3 m2. There were 14 rows of wheat
in each split-plot. The rows were 3 m long, and the intrarow spacing was 0.15 m. There were two wheat rows
Scientific Reports | (2021) 11:4913 | https://doi.org/10.1038/s41598-021-84208-7 2
Vol:.(1234567890)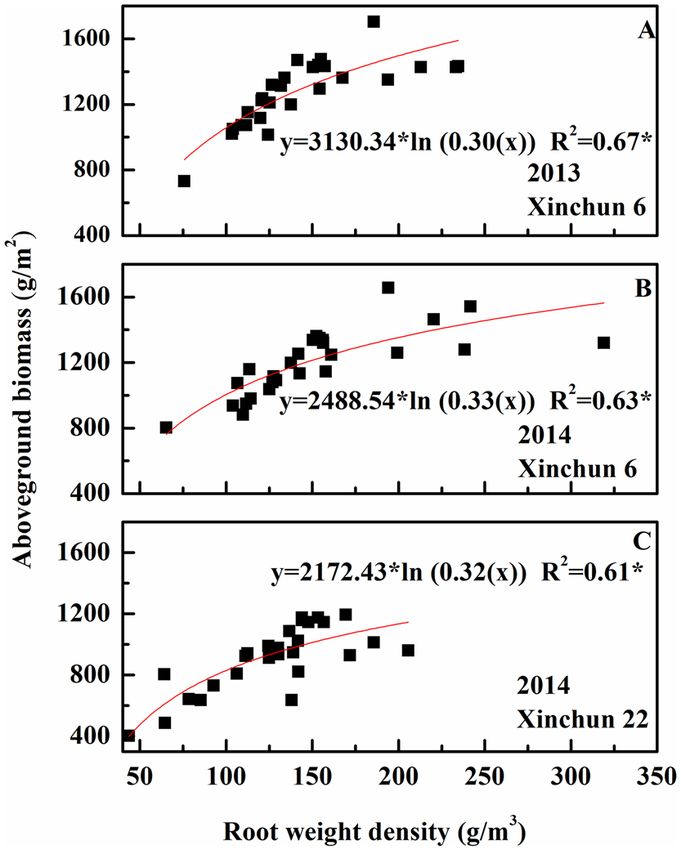
www.nature.com/scientificreports/
Treatment
Year Cultivar D W LAI Root–shoot ratio RDMPLA Specific root length SLA
1 2.91 ± 0.23c 0.10 ± 0.002c 3.27 ± 0.31b 0.08 ± 0.01ab 186.00 ± 20.8a
1 2 3.54 ± 0.19ab 0.10 ± 0.002c 1.98 ± 0.11de 0.08 ± 0.01a 191.13 ± 21.28a
3 4.04 ± 0.15a 0.12 ± 0.002bc 1.50 ± 0.06ef 0.07 ± 0.01ab 165.35 ± 12.83ab
1 2.81 ± 0.17c 0.11 ± 0.006bc 4.74 ± 0.32a 0.05 ± 0.01b 134.92 ± 14.61b
2 2 3.93 ± 0.23ab 0.12 ± 0.03b 2.05 ± 0.11d 0.08 ± 0.01ab 146.57 ± 9.90ab
3 4.10 ± 0.23a 0.15 ± 0.01a 2.00 ± 0.12d 0.05 ± 0.003b 162.62 ± 14.87ab
2013 Xinchun 6
1 3.39 ± 0.15bc 0.10 ± 0.002c 2.64 ± 0.12c 0.07 ± 0.001ab 149.90 ± 12.19ab
2 4.01 ± 0.22a 0.10 ± 0.004c 1.40 ± 0.07 fg 0.08 ± 0.01ab 142.85 ± 13.64b
3 4.04 ± 0.24a 0.10 ± 0.004c 0.94 ± 0.05 g 0.05 ± 0.001ab 142.87 ± 9.85b
3
D ns ns *** ns *
W *** * *** * ns
D*W ns ns *** ns ns
1 2.91 ± 0.17f. 0.11 ± 0.01b 3.29 ± 0.22b 0.09 ± 0.01a 216.02 ± 16.10a
1 2 3.48 ± 0.21e 0.11 ± 0.01b 1.99 ± 0.12c 0.07 ± 0.01abc 229.27 ± 23.52a
3 4.48 ± 0.30c 0.11 ± 0.002b 1.44 ± 0.09de 0.06 ± 0.003bcd 241.44 ± 14.86a
1 3.95 ± 0.31de 0.12 ± 0.01b 3.90 ± 0.41a 0.06 ± 0.01bcd 256.02 ± 25.37a
2 2 5.04 ± 0.13ab 0.16 ± 0.004a 1.60 ± 0.04 cd 0.07 ± 0.01abcd 258.23 ± 23.07a
3 4.66 ± 0.08bc 0.19 ± 0.03a 1.78 ± 0.03 cd 0.04 ± 0.01d 270.13 ± 17.41a
Xinchun 6
1 4.40 ± 0.08 cd 0.12 ± 0.001b 2.05 ± 0.04c 0.08 ± 0.01ab 234.40 ± 18.39a
2 5.11 ± 0.09ab 0.11 ± 0.002b 1.07 ± 0.02e 0.06 ± 0.01abcd 237.87 ± 21.47a
3 5.50 ± 0.10a 0.11 ± 0.01b 0.69 ± 0.13f. 0.04 ± 0.01 cd 274.85 ± 32.51a
3
D *** * *** ns ns
W *** * *** ** ns
D*W ** ns ** ns ns
2014
1 2.59 ± 0.19e 0.13 ± 0.001b 2.69 ± 0.17b 0.09 ± 0.02ab 199.35 ± 19.15bc
1 2 3.03 ± 0.12de 0.14 ± 0.02b 1.86 ± 0.08 cd 0.1 ± 0.02a 214.09 ± 13.85bc
3 3.75 ± 0.22bc 0.12 ± 0.001b 1.41 ± 0.08d 0.09 ± 0.01a 192.03 ± 18.19c
1 3.26 ± 0.18 cd 0.13 ± 0.03b 3.25 ± 0.18a 0.06 ± 0.01ab 229.95 ± 22.25bc
2 2 4.30 ± 0.11a 0.13 ± 0.01b 2.20 ± 0.06c 0.06 ± 0.003ab 216.69 ± 20.09bc
3 4.01 ± 0.14ab 0.21 ± 0.01a 1.89 ± 0.07c 0.06 ± 0.005ab 276.16 ± 31.32b
Xinchun 22
1 3.44 ± 0.32 cd 0.12 ± 0.002b 2.67 ± 0.26b 0.05 ± 0.004b 193.99 ± 20.29c
2 4.21 ± 0.11ab 0.14 ± 0.01b 1.99 ± 0.06c 0.05 ± 0.01b 246.32 ± 29.57bc
3 4.38 ± 0.18a 0.13 ± 0.004b 1.73 ± 0.07d 0.05 ± 0.003b 358.01 ± 38.42a
3
D *** ns *** ** *
W *** ns *** ns *
D*W ns * ns ns *
Table 3. Shoot and root characteristics at flowering as affected by drip irrigation frequency and amount.
Abbreviations: LAI leaf area index, RDMPLA root dry weight per unit leaf area, SLA specific leaf area, ns
represents no significance at the 0.05 probability level. *Represents significance at the 0.05 probability level.
**Represents significance at the 0.01 probability level.
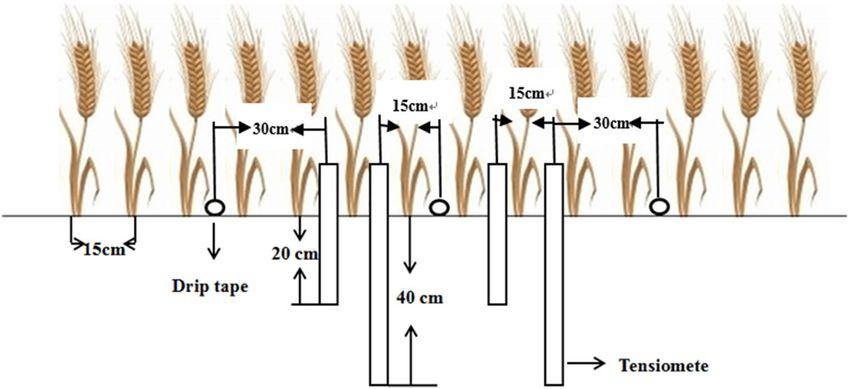
on each side of every drip tape (Fig. 1, the spacing between the drip tapes was 60 cm). There was a 30 cm space
between each emitter. The emitter discharge rate was 3.20 l/h. Water movement between the plots was prevented
by burying waterproof membranes to a depth of 80 cm below the soil surface between each plot. The plots were
irrigated after wheat emerged (April 10, 2013 and April 6, 2014).
The plots were fertilized with 600 kg/ha urea and 225 kg/ha diammonium phosphate [(NH4)2HPO4]. Twenty-
five percent of the urea (i.e., 150 kg/ha) and all of the P fertilizer were applied at sowing. The remainder of the
urea was applied at the following times: 15% at the three-leaf stage, 30% at jointing, 30% at booting stage, 15%
at flowering, and 10% at grain fi lling20.
Soil water potential. Four tensiometers (Irrometer Company, Riverside, CA, USA) were installed in each
split plot to monitor soil water potential. Two tensiometers were installed 15 cm from the drip tape, one at the
0–20 cm depth and one at the 20–40 cm depth. The other two tensiometers were installed 30 cm from the drip
tape, also at depths of 0–20 and 20–40 cm. Soil moisture was measured just before and after each irrigation event
(Fig. 1).
Scientific Reports | (2021) 11:4913 | https://doi.org/10.1038/s41598-021-84208-7 3
Vol.:(0123456789)www.nature.com/scientificreports/
Figure 1. Sketch map showing the relative positions of the drip laterals, the wheat rows, and the Watermark
tensiometers.
Root weight density (RWD) and root length density (RLD). Root morphology was assessed at flow-
ering during 2013 and 2014 using the core sampling method21. Three hills were collected from the 0–40 cm
depth of each split plot using a soil corer (5 cm diam). The samples were divided into 0–20 and 20–40 cm depths
and then washed with tap water on a 0.5 mm mesh screen. Grass roots and other organic debris were removed
from the samples. The roots were then digitally analyzed using a flatbed image scanner (Epson V500; Epson
America, Inc., San Jose, CA, USA) as described by Kato et al.22. The root lengths were determined with Win-
RHIZO commercial software (Regent Instruments, Montreal, QC, Canada). After scanning, the samples were
dried in an oven at 75 °C for 72 h and then weighed. Using data from the above measurements, we calculated
root length density (RLD, root length per volume of soil, cm/cm3), root weight density (RWD, root weight per
volume of soil, g/m3) and specific root length (the ratio of root length to root weight, m/g).
Leaf area index at flowering (LAImax), dry matter, and grain yield. The aboveground plant sam-
ples were collected along with roots at flowering. The samples were separated into leaves, stems, and panicles.
The green leaf area was measured with an LI-3100 leaf area meter (LI-COR Inc., Lincoln, NE, USA). The samples
were dried in an oven at 75 °C for at least 72 h and then weighed. Specific leaf area (SLA) was calculated by divid-
ing leaf weight by leaf area23. The root:shoot ratio (dry weight basis) and the root dry weight per unit leaf area
(RDMPLA) were also calculated. Grain yield was determined from a 1 m 2 area in each split plot and adjusted
to a moisture content of 0.14 g H2O/g fresh weight. Panicle dry weight and yield components were determined
using three subsamples from three 1 m2 areas in each split plot.
Net photosynthetic rate (Pn). The Pn of five flag leaves in each subplot was measured using a LI-6400
portable open-flow gas exchange system (Li-COR Inc., NE, USA) under 1800 μmol/m2/s light intensity from a
owering20.
red/blue LED light source between 10:30 and 12:30 h on three consecutive days during fl
Crop evapotranspiration (ETc) and water use efficiency (WUE). Crop evapotranspiration (ETc) was
determined using the soil water balance method described in our previous paper20. Water use efficiency (WUE)
was calculated by dividing grain yield by ETc20.
Statistical analysis. The data were analyzed using the generalized linear model (GLM) procedure (SPSS
16.0). Differences between means were compared using Fisher’s least significant difference (LSD) tests at the 5%
probability level20.
Results
Soil water potential. Soil water potentials decreased as the soil dried between irrigation events and then
increased to near their original level after irrigation. The fluctuations were greater at depths of 0–20 cm than at
depths of 20–40 cm (Figs. 2, 3).
At the 0–20 cm depth, there were differences among irrigation amounts and irrigation frequency before every
irrigation event. The D3 plot had the highest water potentials than the D2 and D1 treatments under the W2
and W3 treatments, and the irrigation frequency was not different under the W1 treatment. Compared with the
different irrigation amounts before irrigation, the soil water potentials decreased in the order W3 > W2 > W1.
At depths of 0–20 cm, the maximum water potentials ranged between − 5 and − 40 kPa. The maximum soil
water potentials were generally not affected by either irrigation frequency or irrigation amount; the exceptions
were in the D2 and D3 plots in 2013 (Fig. 2). The minimum soil water potentials ranged between − 80 and
− 160 kPa. Minimum soil water potentials decreased in the order W3 > W2 > W1. The differences in minimum
water potential among W1, W2, and W3 were larger in the D2 and D3 plots than in the D1 plots.
Scientific Reports | (2021) 11:4913 | https://doi.org/10.1038/s41598-021-84208-7 4
Vol:.(1234567890)www.nature.com/scientificreports/
Figure 2. Temporal changes in soil water potential in the 0–20 cm depth under ‘Xinchun 6’. (A) Soil water
potential under D1 treatment in 2013. (B) Soil water potential under D1 treatment in 2014. (C) Soil water
potential under D2 treatment in 2013. (D) Soil water potential under D2 treatment in 2014. (E) Soil water
potential under D3 treatment in 2013. (F) Soil water potential under D3 treatment in 2014.
The maximum water potentials in the 20–40 cm depth ranged between − 20 and − 100 kPa (Fig. 3). These
values were slightly lower than those at depths of 0–20 cm (Figs. 2, 3). The maximum soil water potentials in
the 20–40 cm depth were similar in the D1, D2, and D3 plots (Fig. 3). There were some differences in maximum
soil water among W1, W2, and W3 in 2013 but not in 2014. The minimum soil water potentials ranged between
− 40 and − 160 kPa. The minimum water potentials decreased in the order W3 > W 2 > W1, with the largest dif-
ferences being in the D1 plots in 2014.
At 20–40 cm depth, we observed that the D3 plot had the highest water potentials compared with the D2
and D1 treatments. Compared with the different irrigation amounts before irrigation, the soil water poten-
tials decreased in the order W3 > W2 > W1.D3W3 had the highest water potential before every irrigation in all
treatments.
Root characteristics. The root length density in the 0–20 cm depth ranged between 2.99 and 9.13 cm/cm3
(Fig. 4). The RLD of the two cultivars was significantly affected by irrigation frequency and irrigation amount in
the two years. The RLD in the D1 plots was 2–27% greater than that in the D2 plots and 49–106% greater than
that in the D3 plots of Xinchun 6. The RLD was greatest in D1W3 and least in D3W1. The RLD decreased in the
order W3 > W2 > W1. The RLD in the D2 plots was 8% greater than that in the D1 plots and 48% greater than
that in the D3 plots of Xinchun 22. The RLD of Xinchun 22 was greatest in D2W3 and least in D3W1. The RLD
generally decreased in the order W3 > W2 > W1.
The root length density in the 20–40 cm depth ranged between 0.86 and 3.11 cm/cm3 (Fig. 4). The RLD of
the two cultivars was significantly affected by irrigation frequency and irrigation amount in the two years. The
RLD in the D1 plots was 21.5–25.1% greater than that in the D2 plots and 59.5–33.5% greater than that in the
D3 plots of the two cultivars. The RLD decreased in the order W1 > W2 > W3. The RLD was greatest in D1W1
and least in D3W3.
The root weight density ranged between 61.3 and 238.4 g/m3 at depths of 0–20 cm (Fig. 5). The RWDs of the
two cultivars were significantly affected by irrigation frequency and irrigation amount over the two years. The
RWD in the D3 plots was 36.7–11.9% greater than that in the D2 plots and 51.1–56.7% greater than that in the
Scientific Reports | (2021) 11:4913 | https://doi.org/10.1038/s41598-021-84208-7 5
Vol.:(0123456789)www.nature.com/scientificreports/
Figure 3. Temporal changes in soil water potential in 20–40 cm depth under ‘Xinchun 6’. (A) Soil water
potential under D1 treatment in 2013. (B) Soil water potential under D1 treatment in 2014. (C) Soil water
potential under D2 treatment in 2013. (D) Soil water potential under D2 treatment in 2014. (E) Soil water
potential under D3 treatment in 2013. (F) Soil water potential under D3 treatment in 2014.
D1 plots of the two cultivars. The RWD decreased in the order W3 > W2 > W1. The RWD was greatest in D3W3
and least in D1W1.
At 20–40 cm depth, the RWD ranged between 0.70 and 4.73 g/m3. The RWD in the D3 plots was 70.3–27.5%
greater than that in the D2 plots and 229.7–137.1% greater than that in the D1 plots of the two cultivars. The RWD
of both cultivars was greatest in D3W1 and lowest in D1W3. The RWD decreased in the order W1 > W2 > W3.
Irrigation amount, but not irrigation frequency, had significant effects on the specific root length of Xinchun
6 in both years (Table 3). In 2013, the specific root length was greatest in W2. In 2014, the specific root length
was greatest in both W1 and W2. In contrast to Xinchun 6, irrigation frequency significantly affected the specific
root length of Xinchun 22. The specific root length in the D1 plots was 26.7–42.6% greater than that in the D2
plots and 20.6–60.2% greater than that in the D3 plots.
Aboveground biomass. Irrigation frequency and irrigation amount significantly affected the stem, leaf,
and spike dry weights of Xinchun 6 (Fig. 6). The dry weights were generally greatest in the D3 plots and least in
the D1 plots. The exception was that stem dry weights in the D1 plots were greater than those in the D2 plots in
2014. The dry weights generally decreased in the order W3 > W2 > W1 in the D1 plots (Fig. 6). In the D2 and D3
plots, stem, leaf, and spike dry weights were greater in W2 than in W3. Irrigation frequency, but not irrigation
amount, significantly affected the stem, leaf, and spike dry weights of Xinchun 22. The dry weights were gener-
ally greatest in the D3 plots and least in the D1 plots.
Photosynthesis and LAI. Leaf Pn was significantly affected by irrigation frequency, irrigation amount,
and their interaction (Fig. 7). The leaf Pn in the D3 plots was 17.6–6.30% greater than that in the D2 plots and
39.1–24.7% greater than that in the D1 plots. Leaf Pn decreased in the order W3 > W2 > W1, with W3 being
8.30–8.93% greater than that in W2 and 15.2–19.6% greater than that in W1. For both cultivars, leaf Pn was
greatest in D3W3 and least in D1W1.
The LAI was significantly affected by irrigation frequency in 2014 but not in 2013 (Table 3). In 2014, the LAI
in the D3 plots was 9.89–3.89% greater than that in the D2 plots and 38.1–28.5% greater than that in the D1 plots.
Irrigation amount significantly affected LAI in both years. The LAI decreased in the order W3 > W2 > W1, with
W3 being 6.01–6.19% greater than that in W2 and 33.6–30.0% greater than that in W1. In 2014, LAI was always
Scientific Reports | (2021) 11:4913 | https://doi.org/10.1038/s41598-021-84208-7 6
Vol:.(1234567890)www.nature.com/scientificreports/
Figure 4. Root length density at flowering as affected by irrigation frequency and amount. (A) The root
length density of ‘Xinchun 6’ in the 0–20 cm depths in 2013. (B) The root length density of ‘Xinchun 22’ in the
0–20 cm depths in 2014. (C) The root length density of ‘Xinchun 6’ in the 0–20 cm depths in 2014. (D) The root
length density of ‘Xinchun 6’ in the 20–40 cm depths in 2013. (E) The root length density of ‘Xinchun 22’ in the
20–40 cm depths in 2014. (F) The root length density of ‘Xinchun 6’ in the 20–40 cm depths in 2014. Error bars
represent ± SE (n = 10). Bars within a panel with a different letter are significantly different at P < 0.05.
greatest in the D3W3 treatment and least in the D1W1 treatment. The LAI of Xinchun 6 was 20% greater than
that of Xinchun 22. The change of LAI was similar with leaf Pn.
The SLA of Xinchun 6 was significantly affected by irrigation frequency in 2013 but not in 2014. In 2013, the
SLA in the D1 plots was 22.1% greater than that in the D2 plots and 24.5% greater than that in the D3 plots. The
irrigation amount and interaction effects on the SLA of Xinchun 6 were not significant in either year. Irrigation
frequency, irrigation amount, and their interaction had significant effects on the SLA of Xinchun 22. The SLA
in the D3 plots was 10.5% greater than that in the D2 plots and 31.9% greater than that in the D1 plots. The SLA
decreased in the order W3 > W2 > W1, with that in W3 being 32.6% greater than that in W2 and 22.0% greater
than that in W1.
Relationship between grain yield and root characteristic. The root/shoot ratio of Xinchun 6 was
significantly affected by irrigation frequency in 2013, being 15.6–16.7% greater in the D2 plots than in the D1
and D3 plots. The irrigation amount significantly affected the root/shoot ratio of Xinchun 6 in 2014. The root/
shoot ratio was 8.54–7.87% greater in W3 than in W1 and W2. In both cultivars, D2W3 had the greatest root/
shoot ratio. Irrigation frequency and irrigation amount both had significant effects on RLDPMA. The RLDPMA
was 20.4–55.7% greater in D2 than in D1 and D3. The RLDPMA generally decreased in the order W1 > W2 > W3.
In both cultivars, D2W1 had the highest RLDPMA (Table 3).
Regression analysis indicated a significant relationship between RWD at the 0–20 cm depth and grain yield
(R2 = 0.43) of Xinchun 6. In contrast, grain yield increased as RWD at the 0–20 cm depth increased. Regres-
sion analysis also indicated a significant relationship between the RLD at 20–40 cm depth and the grain yield
(R2 = 0.34) of Xinchun 6, and the grain yield increased as the RLD at 20–40 cm depth decreased. The relationship
was best described by a binomial function (Fig. 8).
Grain yield and its components. Irrigation frequency significantly affected the panicle number of both
cultivars in both years (Table 4). Averaged across irrigation amounts, panicle numbers in the D3 plots were
4–38% greater than in the D1 plots and 11–14% greater than in the D2 plots. Irrigation amount also had signifi-
cant effects on panicle number. In Xinchun 6, panicle numbers in W3 were 36.5–19.7% greater than those in W1
Scientific Reports | (2021) 11:4913 | https://doi.org/10.1038/s41598-021-84208-7 7
Vol.:(0123456789)www.nature.com/scientificreports/
Figure 5. Root weight density at flowering as affected by irrigation frequency and amount. (A) The root
weight density of ‘Xinchun 6’ in the 0–20 cm depths in 2013. (B) The root weight density of ‘Xinchun 22’ in the
0–20 cm depths in 2014. (C) The root weight density of ‘Xinchun 6’ in the 0–20 cm depths in 2014. (D) The root
weight density of ‘Xinchun 6’ in the 20–40 cm depths in 2013. (E) The root weight density of ‘Xinchun 22’ in the
20–40 cm depths in 2014. (F) The root weight density of ‘Xinchun 6’ in the 20–40 cm depths in 2014. Error bars
represent ± SE (n = 10). Bars within a panel with a different letter are significantly different at P < 0.05.
and 25.5–6.09% greater than those in W2. In Xinchun 22, panicle numbers in W2 were 5.9% greater than those
in W1 and 42.5% greater than those in W2.
Irrigation frequency significantly affected the spikelet number of Xinchun 6 in 2013 and Xinchun 22 in 2014.
Irrigation amount significantly affected the spikelet number of both cultivars in both years. Spikelet numbers were
generally greatest in W2. The exception was that in the D1 plots in 2014, W3 had the greatest spikelet number.
The 1000 grain weight was significantly affected by irrigation frequency in both years. Averaged across irri-
gation amounts, the 1000 grain weight in the D1 plots was 5.01% greater than that in the D2 plots and 15.4%
greater than that in the D3 plots. The irrigation amount significantly affected the 1000 grain weight of Xinchun
6 but not Xinchun 22. The 1000 grain weights tended to be highest in W1. The 1000 grain weights were similar
in W2 and W3.
Grain yield was significantly affected by irrigation frequency in 2013. Averaged across irrigation amounts,
the yield in the D3 plots was 3.29% greater than that in the D2 plots and 32.5% greater than that in the D1 plots.
Irrigation amount had significant effects on yield in both years. In 2013, grain yields decreased in the order
W3 > W2 > W1. In 2014, grain yield decreased in the order W3 > W2 > W1 in the D1 plots. In the D2 and D3
plots, grain yields decreased in the order W2 > W3 > W1.
WUE and ETc. The WUE was significantly affected by irrigation frequency and irrigation amount in 2013
but only by irrigation amount in 2014 (Table 5). The WUE in D3 was 8.33% greater than that in D2 and 28.4%
greater than that in D1. The WUE in W1 was 14.9% greater than that in W2 and 66.2% greater than that in W3.
The WUE was greatest in D3W1 in 2013 and D2W1 in 2014. The WUE was lowest in D1W3 in 2013 and D3W3
in 2014.
The ETc was similar in 2013 and 2014 (Table 5). The irrigation amount significantly affected ETc, but the
irrigation frequency and interaction effects were not significant. Averaged across years and irrigation frequency
treatments, the ETc in W1 was 77.4% less than that in W2 and 27.9% less than that in W3.
Scientific Reports | (2021) 11:4913 | https://doi.org/10.1038/s41598-021-84208-7 8
Vol:.(1234567890)www.nature.com/scientificreports/
Figure 6. Dry weight of different wheat organs at flowering as affected by irrigation frequency and amount.
(A1) The stem dry matter of ‘Xinchun 6’ in 2013. (B1) The leaf dry matter of ‘Xinchun 6’ in 2013. (C1) The spike
dry matter of ‘Xinchun 6’ in 2013. (A2) The stem dry matter of ‘Xinchun 6’ in 2014. (B2) The leaf dry matter of
‘Xinchun 6’ in 2014. (C2) The spike dry matter of ‘Xinchun 6’ in 2014. (A3) The stem dry matter of ‘Xinchun
22’ in 2014. (B3) The leaf dry matter of ‘Xinchun 22’ in 2014. (C3) The spike dry matter of ‘Xinchun 22’ in 2014.
Error bars represent ± SE (n = 10). Bars within a panel with a different letter are significantly different at P < 0.05.
Discussion
The soil water potential at different soil depths is directly affected by the irrigation m ethod24. In our study, the
soil water potentials at both 0–20 and 20–40 cm decreased rapidly after irrigation and then returned to near
their original level after irrigation (Figs. 2, 3). This indicated that all of the treatment combinations met the water
demands of the wheat.
Plant growth depends largely on the absorption and utilization of soil water. The importance of plant roots as
suppliers of water and minerals has been discussed by many researchers25–28. Root system architecture is affected
by temporal changes in the soil environment, including soil m oisture29–31. Compared with flood irrigation prac-
tices, drip irrigation increases root growth in the surface soil. A previous report indicated that high-frequency
drip irrigation restricted cotton root growth to the upper 30–40 cm depth of the soil profile32. Therefore, only
the 0–40 cm depth was considered in this study.
Researchers commonly use RLD and RWD to characterize root s ystems33. Both the RLD and RWD were
greater at the 0–20 cm depth than at the 20–40 cm depth. Similar results were found in flood irrigation s tudies34.
The proportion of the root system in the 20–40 cm depth was greater in W1 than in either W2 or W3. This indi-
cated that W1 could lead to better use of stored soil water. The amount of water at the 0–20 cm depth was not
enough for plant growth when irrigation was less frequent. Root length increased when the plants were irrigated
less frequently. This enabled plants to take up water from lower soil depths.
Roots grow long because roots can use deep water in soil. Our research suggested that the majority of wheat
roots were in the 0–20 cm depth in this drip-irrigated system. However, wheat responded to drier soil conditions
in W1 by increasing the root length at 20–40 cm depth. Our study showed that SRL had different performances
in the two cultivars. This may be caused by the different changes in root morphology and structure. Research
Scientific Reports | (2021) 11:4913 | https://doi.org/10.1038/s41598-021-84208-7 9
Vol.:(0123456789)www.nature.com/scientificreports/
Figure 7. Leaf net photosynthetic rate (Pn) at early grain filling stage as affected by irrigation frequency and
amount. (A) Pn of Xinchun 6 in 2013. (B) Pn of Xinchun 6 in 2014. (C) Pn of Xinchun 22 in 2014. Leaf Pn was
calculated across five replicates for each day and then averaged for three days. Error bars represent ± SE (n = 10).
Bars within a frame with a different letter are significantly different at P < 0.05.
Figure 8. Relationship between the grain yield of Xinchun 6 and root characteristic. (A) Relationship between
root weight density in 0–20 cm depth and grain yield. (B) Relationship between root weight density in 20–40 cm
depth and grain yield. (C) Relationship between root length density in 0–20 cm depth and grain yield. (D)
Relationship between root weight density in 20–40 cm depth and grain yield.
Scientific Reports | (2021) 11:4913 | https://doi.org/10.1038/s41598-021-84208-7 10
Vol:.(1234567890)www.nature.com/scientificreports/
Treatment
Year Cultivar D W Effective panicles (no./m2) Spikelets per panicle 1000 grain weight (g) Grain yield (kg/ha)
1 303 ± 7.81d 24.8 ± 0.940c 52.2 ± 1.46a 5670 ± 187c
1 2 347 ± 17.7d 28.1 ± 1.60bc 46.9 ± 2.07b 6320 ± 385c
3 535 ± 33.7b 26.6 ± 1.01c 40.7 ± 1.58e 7310 ± 508b
1 439 ± 11.7c 24.9 ± 1.35c 45.8 ± 1.03bc 6000 ± 369c
2 2 456 ± 11.51c 31.8 ± 1.94ab 42.2 ± 1.76cde 7100 ± 447b
3 541 ± 25.0b 28.6 ± 1.28bc 42.5 ± 0.60cde 7760 ± 539b
2013 Xinchun 6
1 490 ± 13.3bc 25.7 ± 1.37c 44.4 ± 0.79bcd 6750 ± 443bc
2 537 ± 19.9b 35.2 ± 1.61a 42.6 ± 0.81cde 9100 ± 450a
3 607 ± 26.1a 34.0 ± 1.07a 41.3 ± 0.98de 9720 ± 472a
3
D *** *** ** **
W *** *** *** **
D*W ** ns ** ns
1 437 ± 11.3e 22.8 ± 2.12c 51.6 ± 1.55a 5650 ± 462c
1 2 523 ± 16.27d 24.3 ± 2.14c 48.2 ± 2.54ab 6470 ± 539abc
3 552 ± 11.6d 26.4 ± 3.18bc 43.8 ± 1.73bc 7530 ± 409ab
1 568 ± 10.9c 26.9 ± 1.70bc 45.6 ± 1.16bc 6430 ± 472abc
2 2 616 ± 26.4b 35.0 ± 1.97a 47.5 ± 3.27abc 7670 ± 376a
3 688 ± 21.7a 23.3 ± 1.41c 42.4 ± 2.12 cd 7120 ± 244a
Xinchun 6
1 568 ± 20.8c 22.2 ± 1.74c 46.2 ± 1.93abc 6130 ± 140bc
2 635 ± 23.5b 30.9 ± 2.76ab 35.0 ± 1.93e 7110 ± 899ab
3 640 ± 24.3b 27.0 ± 2.25bc 37.5 ± 1.16de 6600 ± 802ab
3
D *** ns *** ns
W *** ** *** *
D*W ** * * ns
2014
1 674 ± 9.68 fg 29.9 ± 2.21abc 31.4 ± 3.44ab 5680 ± 286bcd
1 2 740 ± 4.53c 30.2 ± 1.93abc 30.7 ± 2.32ab 6410 ± 305abc
3 766 ± 1.80b 36.1 ± 3.00a 31.9 ± 2.40ab 7330 ± 311a
1 661 ± 7.87 g 26.2 ± 2.10bc 29.8 ± 2.32ab 5140 ± 570 cd
2 2 684 ± 4.80ef 33.2 ± 3.18a 33.6 ± 1.71a 6960 ± 513ab
3 700 ± 6.67de 30.9 ± 2.40abc 29.4 ± 2.34ab 5870 ± 407bcd
Xinchun 22
1 707 ± 3.60d 24.6 ± 1.60c 26.4 ± 2.50b 5050 ± 220d
2 739 ± 8.72c 32.3 ± 2.49ab 27.1 ± 1.72ab 6050 ± 558abcd
3 819 ± 3.33a 24.9 ± 1.61c 26.4 ± 2.52b 5520 ± 764 cd
3
D *** * * ns
W *** * ns **
D*W *** ns ns ns
Table 4. Wheat grain yield and yield components as affected by drip irrigation frequency and amount. ns
represents no significance at the 0.05 probability level. *Represents significance at the 0.05 probability level.
**Represents significance at the 0.01 probability level.
suggests that a higher SRL would be associated with increases in the number of growing root tips and thinner
secondary branches35.
Drought-induced changes in the root-shoot ratio can indicate drought tolerance. Drought stress reduces
wheat yield, root growth, and shoot dry weight and increases the root-shoot r atio36,37. It was similar with our
study. Some researchers have reported a highly significant positive correlation between root dry weight and
shoot dry weight. We observed no correlation between RWD and leaf dry matter, shoot dry matter, or spike dry
matter (data not shown). However, there was a significant positive correlation between RWD and aboveground
biomass (Fig. 9).
Photosynthesis is the basis of biomass accumulation and yield38. Water stress is an important factor affecting
photosynthesis39. Previous studies indicated that moderate and severe water stress reduced Pn in the flag leaf
heat40. Similarly, flag leaf Pn in this study decreased as irrigation frequency and irrigation amount
of spring w
decreased (Fig. 7). Some studies indicate that water stress increases abscisic acid concentrations in xylem, result-
ing in stomatal closure41. Other researchers report that Pn decreases due to nonstomatal factors. Specifically,
progressive downregulation or inhibition of metabolic processes leads to decreased RuBP content, which inhibits
photosynthetic CO2 assimilation42. Additional studies are required to determine the mechanism that caused the
decreases in Pn as irrigation frequency and irrigation amount decreased.
Scientific Reports | (2021) 11:4913 | https://doi.org/10.1038/s41598-021-84208-7 11
Vol.:(0123456789)www.nature.com/scientificreports/
Treatment Treatment
Year D W WUE (kg/m3) ETc (mm) Year D W WUE (kg/m3) ETc (mm)
1 0.82a 566c 1 1.03a 546c
1 2 0.70b 764b 1 2 0.85ab 762b
3 0.69b 982a 3 0.79b 955a
1 1.09a 548c 1 1.18a 543a
2 2 0.93ab 767b 2 2 1.01a 761b
3 0.79b 984a 3 0.73b 971a
2013 2014
1 1.24a 543c 1 1.14a 539c
2 1.21ab 748b 2 0.94a 755b
3 1.01b 960a 3 0.68b 976a
3 3
D * ns D ns ns
W ** ** W ** **
D*W ns ns D*W ns ns
Table 5. Water use efficiency (WUE) and crop evapotranspiration (ETc) of spring wheat cultivar ‘Xinchun
6’ as affected by irrigation frequency and amount. ns represents no significance at the 0.05 probability level.
*Represents significance at the 0.05 probability level. **Represents significance at the 0.01 probability level.
Figure 9. Relationship between root weight density and aboveground biomass in 2013 and 2014. (A)
Relationship between root weight density and aboveground biomass of Xinchun 6 in 2013. (B) Relationship
between root weight density and aboveground biomass of Xinchun 6 in 2014. (C) Relationship between root
weight density and aboveground biomass of Xinchun 22 in 2014.
Grain filling in wheat depends on two main sources: (1) current assimilates produced by leaf and stem pho-
tosynthesis and (2) mobilization of stored carbohydrates and N 43. The dry weights at flowering decreased in the
order stem > leaf > spike. There was no significant difference in plant organ dry weight between W2 and W2.
Irrigation frequency also had no significant effect on organ dry weight (Fig. 6). Previous studies have shown
owering44.
that wheat grain yield is closely related to dry matter accumulation, transport, and distribution after fl
Root growth and distribution patterns have a major influence on crop production. Many researchers have
studied the influence of roots on yield, water and nutrient absorption. Other studies have examined the effect
of, as well as environmental and regulatory effects on root cultivation t echniques28. Previous studies have shown
that the amount of roots in deep soil must be increased to obtain greater rice and wheat y ields45. Under drought
stress, wheat mainly uses deep soil moisture to meet water demands46. Therefore, deep roots have an important
influence on wheat yield, shallow root systems and the role of small middle roots, with no correlation between
the total root and yield. We also wanted to determine the relationship between root characteristics and yield.
Scientific Reports | (2021) 11:4913 | https://doi.org/10.1038/s41598-021-84208-7 12
Vol:.(1234567890)www.nature.com/scientificreports/
In our research, RWD at 0–20 cm depth and RLD at 20–40 cm depth were correlated with drip-irrigated wheat
yield (Fig. 8). However, the R squared values were less than 0.5. This may be because root growth at only one
growth stage (flowering) was measured in this study. Flowering time is an important trait in wheat breeding, as
it affects adaptation and yield p otential47. We should conduct more research on different stages of root growth
and determine the relationship between root growth and yield of drip-irrigated wheat in the future.
Due to the influence of geographical location, topography and landform, the spatial distribution of annual
precipitation in Xinjiang is extremely uneven. Some studies indicate that from 1961 to 2013, the annual precipita-
tion in all regions of Xinjiang showed a significant increasing trend. The temporal variation trend of precipitation
in Xinjiang is bounded by 1 98648. Before 1986, there was less precipitation, which was a dry period, and after
1986, there was more precipitation, which was a wet period. The monthly precipitation in northern Xinjiang
shows a bimodal distribution, with the main peak appearing from May to J uly49, which happens to be the peak
of water demand for spring wheat. Therefore, the irrigation volume and frequency set by this research will need
to be adjusted appropriately in different years. This will also be a problem that we need to solve in our next work.
Conclusion
Our results indicate that the RLD was greater in D1 and D2 than in D3 in the shallow soil layer and in deep soil.
The RWD and root-shoot ratio were greater in D2 than in D1 and D3. Drip-irrigated wheat responded to drier
soil conditions by increasing the proportion of roots deeper in the soil, so wheat maintained the majority of the
roots near the soil surface regardless of water deficit stress. We found that with the optimum irrigation amount,
increasing drip irrigation frequency increased wheat root length and root weight and increased aboveground
biomass accumulation, thereby improving yield and water use efficiency.
Received: 30 September 2020; Accepted: 8 February 2021
References
1. Liu, J., Williams, J. R., Zehnder, A. J. & Yang, H. GEPIC—modelling wheat yield and crop water productivity with high resolution
on a global scale. Agric. Syst. 94, 478–493 (2007).
2. Fischer, R. et al. Wheat yield progress associated with higher stomatal conductance and photosynthetic rate, and cooler canopies.
Crop Sci. 38, 1467–1475 (1998).
3. Ahmed, N., Chowdhry, M. A., Khaliq, I. & Maekawa, M. The inheritance of yield and yield components of five wheat hybrid
populations under drought conditions. Indones. J. Agric. Sci. 8(2), 53. https://doi.org/10.21082/ijas.v8n2.2007.53-59 (2013).
4. Sezen, S. M., Yazar, A. & Eker, S. Effect of drip irrigation regimes on yield and quality of field grown bell pepper. Agric. Water
Manag. 81, 115–131 (2006).
5. Ali, M. H., Hoque, M., Hassan, A. & Khair, A. Effects of deficit irrigation on yield, water productivity, and economic returns of
wheat. Agric. Water Manag. 92, 151–161 (2007).
6. Zhang, J. W. Description of the Present Situation and Suggestion of Drip-Irrigation Industry Development (2015).
7. Singandhupe, R., Rao, G., Patil, N. & Brahmanand, P. Fertigation studies and irrigation scheduling in drip irrigation system in
tomato crop (Lycopersiconesculentum L.). Eur. J. Agron. 19, 327–340 (2003).
8. Ayars, J. et al. Subsurface drip irrigation of row crops: a review of 15 years of research at the Water Management Research Labora-
tory. Agric. Water Manag. 42, 1–27 (1999).
9. Payero, J. O., Tarkalson, D. D., Irmak, S., Davison, D. & Petersen, J. L. Effect of irrigation amounts applied with subsurface drip
irrigation on corn evapotranspiration, yield, water use efficiency, and dry matter production in a semiarid climate. Agric. Water
Manag. 95, 895–908 (2008).
10. Heitkämper, K., Stehle, T. & Schick, M. Working time requirement for different field irrigation methods. Int. J. Agric. Manag. 4,
50–54 (2015).
11. Robertson, M., Fukai, S., Ludlow, M. & Hammer, G. Water extraction by grain sorghum in a sub-humid environment. II. Extrac-
tion in relation to root growth. Field Crops Res. 33, 99–112 (1993).
12. Asseng, S., Ritchie, J., Smucker, A. & Robertson, M. Root growth and water uptake during water deficit and recovering in wheat.
Plant Soil 201, 265–273 (1998).
13. Xue, Q., Zhu, Z., Musick, J., Stewart, B. & Dusek, D. Root growth and water uptake in winter wheat under deficit irrigation. Plant
Soil 257, 151–161 (2003).
14. King, J. et al. Modelling cereal root systems for water and nitrogen capture: towards an economic optimum. Ann. Bot. 91, 383–390
(2003).
15. Tripathi, R. & Mishra, R. Wheat root growth and seasonal water use as affected by irrigation under shallow water table conditions.
Plant Soil 92, 181–188 (1986).
16. Phene, C. et al. Effect of high frequency surface and subsurface drip irrigation on root distribution of sweet corn. Irrig. Sci. 12,
135–140 (1991).
17. Jordan, J. et al. Effect of irrigation frequency on turf quality, shoot density, and root length density of five bentgrass cultivars. Crop
Sci. 43, 282–287 (2003).
18. Merrill, S. D. & Rawlins, S. Distribution and growth of sorghum roots in response to irrigation frequency. Agron. J. 71, 738–745
(1979).
19. Fragasso, M., Iannucci, A. & Papa, R. Durum wheat and allelopathy: toward wheat breeding for natural weed management. Front.
Plant Sci. 4, 375 (2013).
20. Chen, R. et al. Lateral spacing in drip-irrigated wheat: the effects on soil moisture, yield, and water use efficiency. Field Crops Res.
179, 52–62 (2015).
21. He, H. et al. Rice root system spatial distribution characteristics at flowering stage and grain yield under plastic mulching drip
irrigation (PMDI). JAPS J. Anim. Plant Sci. 24, 290–301 (2014).
22. Kato, Y., Okami, M., Tajima, R., Fujita, D. & Kobayashi, N. Root response to aerobic conditions in rice, estimated by Comair root
length scanner and scanner-based image analysis. Field Crops Res. 118, 194–198 (2010).
23. Montesano, F. F. et al. Tensiometer-based irrigation management of subirrigated soilless tomato: effects of substrate matric potential
control on crop performance. Front. Plant Sci. 6, 1150 (2015).
24. Letey, J. Advances in Soil Science 277–294 (Springer, 1985).
25. Tsutsumi, D., Kosugi, K. & Mizuyama, T. Root-system development and water-extraction model considering hydrotropism. Soil
Sci. Soc. Am. J. 67, 387–401 (2003).
Scientific Reports | (2021) 11:4913 | https://doi.org/10.1038/s41598-021-84208-7 13
Vol.:(0123456789)www.nature.com/scientificreports/
26. Sarker, A., Erskine, W. & Singh, M. Variation in shoot and root characteristics and their association with drought tolerance in
lentil landraces. Genet. Resour. Crop Evol. 52, 89–97 (2005).
27. Carmi, A. & Heuer, B. The role of roots in control of bean shoot growth. Ann. Bot. 48, 519–528 (1981).
28. Izzi, G., Farahani, H., Bruggeman, A. & Oweis, T. In-season wheat root growth and soil water extraction in the Mediterranean
environment of northern Syria. Agric. Water Manag. 95, 259–270 (2008).
29. Hashimoto, M. & Komatsu, S. Proteomic analysis of rice seedlings during cold stress. Proteomics 7, 1293–1302 (2007).
30. Garwood, E. & Sinclair, J. Use of water by six grass species. 2. Root distribution of use of soil water. J. Agric. Sci. UK 93, 25–35
(1979).
31. Guo, Z. & Shao, M. Soil water carrying capacity of vegetation and soil desiccation in artificial forestry and grassland in semi-arid
regions of the Loess Plateau. Acta Ecol. Sin. 23, 1460–1647 (2002).
32. Plant, Z., Carmi, A. & Grava, A. Cotton growth and production under drip-irrigation restricted soil wetting. Irrig. Sci. 9, 143–156
(1988).
33. Chassot, A., Stamp, P. & Richner, W. Root distribution and morphology of maize seedlings as affected by tillage and fertilizer
placement. Plant Soil 231, 123–135 (2001).
34. Li, Q., Dong, B., Qiao, Y., Liu, M. & Zhang, J. Root growth, available soil water, and water-use efficiency of winter wheat under
different irrigation regimes applied at different growth stages in North China. Agric. Water Manag. 97, 1676–1682 (2010).
35. Nicotra, A., Babicka, N. & Westoby, M. Seedling root anatomy and morphology: an examination of ecological differentiation with
rainfall using phylogenetically independent contrasts. Oecologia 130, 136–145 (2002).
36. Barraclough, P., Kuhlmann, H. & Weir, A. The effects of prolonged drought and nitrogen fertilizer on root and shoot growth and
water uptake by winter wheat. J. Agron. Crop Sci. 163, 352–360 (1989).
37. Chaudhuri, U., Kirkham, M. & Kanemasu, E. Root growth of winter wheat under elevated carbon dioxide and drought. Crop Sci.
30, 853–857 (1990).
38. Muchow, R. & Davis, R. Effect of nitrogen supply on the comparative productivity of maize and sorghum in a semi-arid tropical
environment II. Radiation interception and biomass accumulation. Field Crops Res. 18, 17–30 (1988).
39. Fukai, S. & Cooper, M. Development of drought-resistant cultivars using physiomorphological traits in rice. Field Crops Res. 40,
67–86 (1995).
40. Lu, C. & Zhang, J. Effects of water stress on photosystem II photochemistry and its thermostability in wheat plants. J. Exp. Bot. 50,
1199–1206 (1999).
41. Heitholt, J., Johnson, R. & Ferris, D. Stomatal limitation to carbon dioxide assimilation in nitrogen and drought-stressed wheat.
Crop Sci. 31, 135–139 (1991).
42. Flexas, J. & Medrano, H. Drought-inhibition of photosynthesis in C3 plants: stomatal and non-stomatal limitations revisited. Ann.
Bot. 89, 183–189 (2002).
43. Plaut, Z., Butow, B., Blumenthal, C. & Wrigley, C. Transport of dry matter into developing wheat kernels and its contribution to
grain yield under post-anthesis water deficit and elevated temperature. Field Crops Res. 86, 185–198 (2004).
44. Cox, M. C., Qualset, C. O. & Rains, D. W. Genetic variation for nitrogen assimilation and translocation in wheat. I. Dry matter
and nitrogen accumulation. Crop Sci. 25, 430–435 (1985).
45. Lopes, M. S. & Reynolds, M. P. Partitioning of assimilates to deeper roots is associated with cooler canopies and increased yield
under drought in wheat. Funct. Plant Biol. 37, 147–156 (2010).
46. Uga, Y. et al. Control of root system architecture by DEEPER ROOTING 1 increases rice yield under drought conditions. Nat.
Genet. 45, 1097–1102 (2013).
47. Langer, S. M., Longin, C. F. H. & Würschum, T. Flowering time control in European winter wheat. Front. Plant Sci. 5, 537 (2014).
48. Jiang, Y. et al. Climatic characteristics and historical evolution of precipitation in different time scales in Xinjiang from 1961 to
2013. J. Glaciol. Geocryol. 36(6), 1363–1375 (2014).
49. Hu, D. Multivariate Spatiotemporal Kriging Interpolation and Spatiotemporal Analysis of Precipitation in Xinjiang. Ph.D. disserta-
tion, Wuhan University (2019).
Acknowledgements
This work was supported by the Natural Science Foundation of Hubei Provincial Department of Education
(Grant No: Q20184304), Science and Technology Plan Project of Jingmen City (Grant No: 2018YFZD027), the
Natural Science Foundation of Jingchu University of Technology (Grant No: QDB201704) and the Natural Sci-
ence Foundation of Jingchu University of Technology (Grant No: QDB201703).
Author contributions
Conceived and designed the experiments: R.C., W.C. Performed the experiments: R.C., W.C. Analyzed the data:
R.C., W.C. Wrote the paper: R.C., W.C., X.X.
Competing interests
The authors declare no competing interests.
Additional information
Correspondence and requests for materials should be addressed to W.C.
Reprints and permissions information is available at www.nature.com/reprints.
Publisher’s note Springer Nature remains neutral with regard to jurisdictional claims in published maps and
institutional affiliations.
Open Access This article is licensed under a Creative Commons Attribution 4.0 International
License, which permits use, sharing, adaptation, distribution and reproduction in any medium or
format, as long as you give appropriate credit to the original author(s) and the source, provide a link to the
Creative Commons licence, and indicate if changes were made. The images or other third party material in this
article are included in the article’s Creative Commons licence, unless indicated otherwise in a credit line to the
material. If material is not included in the article’s Creative Commons licence and your intended use is not
permitted by statutory regulation or exceeds the permitted use, you will need to obtain permission directly from
the copyright holder. To view a copy of this licence, visit http://creativecommons.org/licenses/by/4.0/.
© The Author(s) 2021
Scientific Reports | (2021) 11:4913 | https://doi.org/10.1038/s41598-021-84208-7 14
Vol:.(1234567890)You can also read