Snow gliding and glide-snow avalanches: recent outcomes from two experimental test sites in Aosta Valley (northwestern Italian Alps) - Nat ...
←
→
Page content transcription
If your browser does not render page correctly, please read the page content below
Nat. Hazards Earth Syst. Sci., 19, 2667–2676, 2019
https://doi.org/10.5194/nhess-19-2667-2019
© Author(s) 2019. This work is distributed under
the Creative Commons Attribution 4.0 License.

Snow gliding and glide-snow avalanches: recent outcomes from two
experimental test sites in Aosta Valley (northwestern Italian Alps)
Margherita Maggioni1,2 , Danilo Godone2,3 , Barbara Frigo4 , and Michele Freppaz1,2
1 DISAFA,   University of Turin, Grugliasco (TO), 10095, Italy
2 NatRisk, University of Turin, Grugliasco (TO), 10095, Italy
3 IRPI, National Research Council, Turin, 10135, Italy
4 DISEG, Politecnico di Torino, Turin, 10129, Italy

Correspondence: Margherita Maggioni (margherita.maggioni@unito.it)

Received: 6 April 2019 – Discussion started: 22 May 2019
Revised: 10 September 2019 – Accepted: 24 October 2019 – Published: 28 November 2019

Abstract. Snow gliding and glide-snow avalanches are gain-       1   Introduction
ing importance among scientists as global warming might
induce conditions favourable to those phenomena. Our aim         Snow gliding processes have recently gained importance
is to analyse such processes with a particular focus on the      among scientists as climate change might influence the snow
potential driving factors associated with the soil conditions.   cover and the related processes, leading to a reduction of
We equipped two experimental test sites in the Aosta Valley      dry snowpacks and an increase in wet ones (Castebrunet et
region (NW Italy) with glide-snow shoes, temperature and         al., 2014). Already in the past, scientists have studied snow
volumetric liquid water content (VLWC) sensors in the soil       gliding and glide-snow avalanches – see review papers by
and in the basal snowpack layer; snow and weather parame-        Höller (2014) and Ancey and Bain (2015) – but current
ters were also collected by automatic weather stations and at    and future climate change might generate scenarios prone to
manual snow measuring sites.                                     such processes; therefore they are again gaining importance.
   In the two monitoring seasons 2013–2014 and 2014–             In fact, increase in the air temperature and in the snowfall
2015 we registered nine glide-snow avalanches, two cold          limit (Hartmann et al., 2013) may influence the snow cover,
and seven warm events, which were characterized by differ-       which might become denser and wetter, also due to more fre-
ent snow and soil conditions. In the only warm glide-snow        quent rain on snow events, in particular close to 2000 m a.s.l.
avalanche event, which presented a continuous gliding be-        (Morán-Tejeda et al., 2016).
fore, the daily glide rate showed a significant exponential         A deep knowledge of the most important driving factors
relationship with the soil VLWC. We also found, though           of such phenomena deserves attention, in order to be able to
without a general trend, that gliding and non-gliding peri-      eventually predict and manage them in the optimum way. Al-
ods (either considering warm and cold periods separately or      ready In der Gand and Zupancic (1966) state that snow glid-
together) were characterized by significantly different pre-     ing occurs on a smooth ground surface, a lowermost layer
disposing factors.                                               of wet snow and a temperature at the snow–ground inter-
   This study contributes to the assessment of the importance    face of 0 ◦ C. Based on different driving factors, some sci-
of soil VLWC, which seems to be one of the most important        entists elaborated models to predict snow gliding distances
driving factors for gliding processes. Therefore, it supports    (e.g. Leitinger et al., 2008) or to identify areas prone to snow
the need, already suggested by other scientists, for analysing   gliding (e.g. Maggioni et al., 2016).
such processes with an interdisciplinary approach which in-         The approach commonly used for studying snow gliding
tegrates snow and soil sciences.                                 and glide-snow avalanches starts from the distinction be-
                                                                 tween cold and warm temperature events (Clarke and Mc-
                                                                 Clung, 1999). This distinction is based on the origin of liq-
                                                                 uid water at the snow–soil interface: in a cold event, the nec-

Published by Copernicus Publications on behalf of the European Geosciences Union.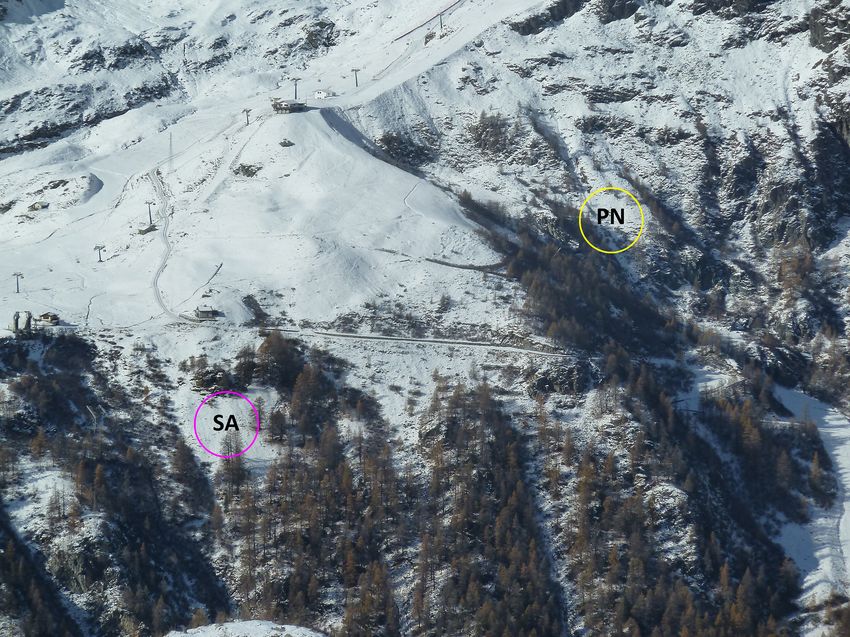
2668 M. Maggioni et al.: Snow gliding and glide-snow avalanches
essary wet snow–soil interface originates either from snow
melting at basal layers of the snowpack or from water suc-
tion from the soil; in a warm event, the water originates from
melting processes at the snow surface, percolates through the
snowpack and ponds at the snow–soil interface. However,
Margueritat (2016) recently registered cases of snow glid-
ing in wintertime (cold events) without a basal layer of wet
ground grains, but in certain cases with a basal layer made of
faceted particles.
The most recent studies by Ceaglio et al. (2017) and
Fromm et al. (2018) underline the importance of soil mois-
ture as a driving factor for snow gliding. In particular,
Ceaglio et al. (2017) found a strong relation between glide-
snow rate and moisture at the snow–soil interface for cold
temperature events, also with a possible contribution of soil
liquefaction, while Fromm et al. (2018) found that soil mois-
ture and temperature had a significant influence on snow glid-
ing in both warm and cold periods.
As in Ceaglio et al. (2017) and Fromm et al. (2018), this
work, using an experimental approach, starts from data gath-
ered at two test sites and aims at giving a contribution to the
ongoing scientific discussion on the most important driving
factors for snow gliding and glide-snow avalanches. Our goal
is to quantify the linkages between soil water content and
snow gliding processes and to assess the factors predispos-
ing the glide avalanche release, under different meteorologi-
cal and snowpack conditions (warm vs. cold events).
2 Data and methods
2.1 Study area
The study area is located within the MonterosaSki resort in
the NE of the Aosta Valley region (NW Italian Alps), in the
Monte Rosa massif, close to the LTER site Istituto Mosso
(https://deims.org/17210eba-d832-4759-89fa-9ff127cbdf6e,
last access: 21 November 2019). From the data taken at the
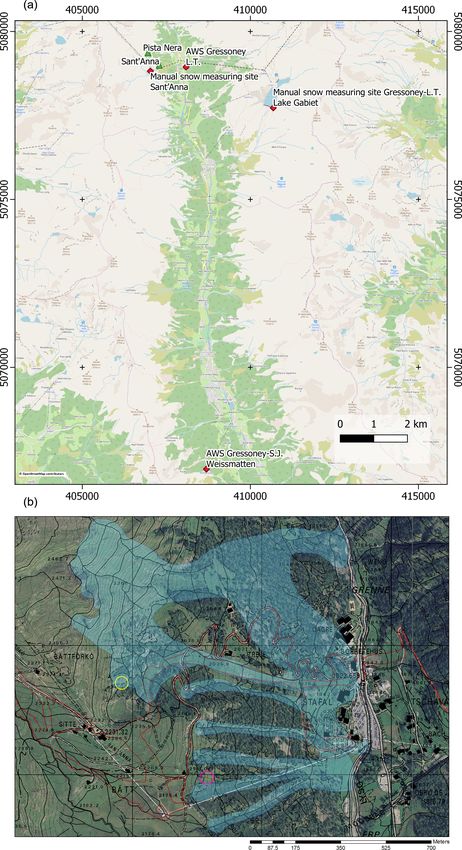
weather station Gressoney-L.T. (1837 m a.s.l.), which has Figure 1. (a) Location of the two test sites (green triangles), the
the longest time series among the different weather stations automatic weather stations and the manual snow measuring sites
present in the area (Fig. 1a), the long-term mean precipita- (red diamonds). Source: https://www.openstreetmap.org/copyright.
tion (including the snow water equivalent) is 1111 mm yr−1 © OpenStreetMap contributors 2019. Distributed under a Creative
(1927–2017), the mean annual air temperature is 4.2 ◦ C Commons BY-SA License. (b) Location of the two test sites “Pista
(1971–2017) and the average cumulative snowfall is 398 cm Nera” and “Sant’Anna”, shown with the yellow and pink circles
(in red the ski runs of the MonterosaSki resort are reported, while
(1981–2010).
the light blue polygons represent the perimeter of the maximum
Two test sites were equipped in the study area for mea- avalanche events registered in the Avalanche Cadastre of the Aosta
suring snow gliding and snow and soil properties (Fig. 1b). Valley region).
The site “Pista Nera” is a slope at about 2230 m a.s.l. with
an average inclination of 40◦ with an ESE aspect. The soil
is classified as Cambisol and is characterized by a liquid
limit (LL) in the topsoil (0–10 cm depth) and in the under- ineus). The site “Sant’Anna” is a slope at about 2120 m a.s.l.
lying soil horizon (10–20 cm depth) equal to 53 % and 47 %, with an average inclination of 36◦ with an east aspect. The
respectively. The slope is covered by a mountain grassland soil is classified as Regosol, with a liquid limit of 84 % and
(Festuca scabriculmis) with sparsely low dwarf shrubs (Ju- 76 % in the topsoil and in the underlying soil horizon, respec-
niperus nana, Calluna vulgaris and Rhododendron ferrug- tively. The dominant plant species are Festuca rubra s.l. and
Nat. Hazards Earth Syst. Sci., 19, 2667–2676, 2019 www.nat-hazards-earth-syst-sci.net/19/2667/2019/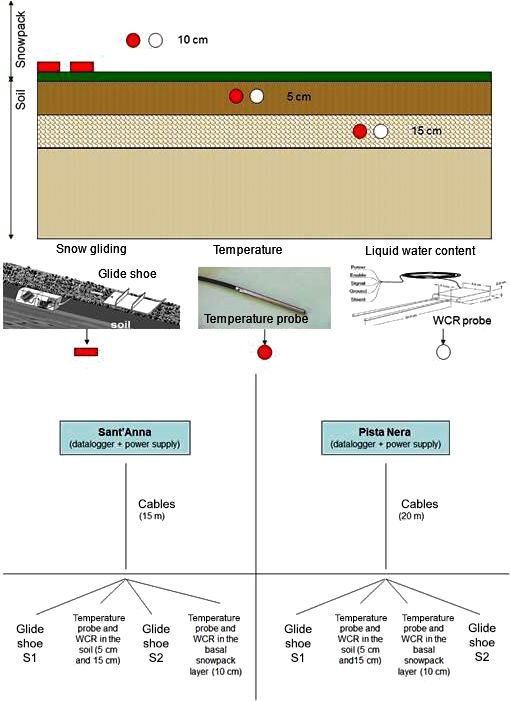
M. Maggioni et al.: Snow gliding and glide-snow avalanches                                                                      2669

Figure 2. Winter view of the study area: in the circles the location
of the two test sites Pista Nera (PN) and Sant’Anna (SA) is shown.

Agrostis tenuis. The glide-snow avalanches released from the
Pista Nera site can reach the ski run below (Figs. 1b and 2)
and therefore need a careful monitoring.

2.2   Data collection

The data were collected during the hydrological years 2013–
2014 and 2014–2015. Snow and meteorological parameters
(snow depth, precipitation, air temperature, and wind speed
and direction) were provided by the automatic weather sta-             Figure 3. Set-up of the experimental test sites.
tion (AWS) “Gressoney-S.J. – Weissmatten”, which has been
operational since 2002 and is placed 12 km further south
from the study site at 2038 m a.s.l. (Fig. 1a). The new snow           tent probes (Campbell-CS616 – water content reflectometers,
amount in 24 h was gathered from the manual snow measur-               WCRs) were placed in the basal layer of the snowpack and at
ing site Gressoney-L.T. – Lake Gabiet (2370 m a.s.l.) 4 km             two different soil depths (5 and 15 cm). The scheme of the in-
east from the study sites (Fig. 1a). These two stations are con-       strumental set-up for both sites is given in Fig. 3. Moreover,
sidered representative of the snow and weather conditions for          a webcam was continuously monitoring the possible glide
the study site. In particular, we realized from previous analy-        crack formation and evolution at the Pista Nera site.
sis how the time of evolution of the snow depth for the study             The manager of the ski area security monitored the spe-
site is similar to that measured at Gressoney-S.J. – Weissmat-         cific conditions at the study sites: for example, when a glide
ten.                                                                   avalanche occurred, he informed us so that we could record
   To describe the physical properties of the snowpack, we             the characteristics of the event and reset the instrumentation.
used the weekly snow profiles made at the manual snow mea-             The reset of the instrumentation consisted in checking the po-
suring site Sant’Anna, very close (less than 1 km) to the study        sitions of the temperature sensors and the WCR probes and,
sites (Fig. 1a), by the Corpo Forestale Valdostano (forestry           when possible in terms of safety standards, in repositioning
office). Moreover, after specific gliding events, we performed         the glide shoes involved in the avalanche.
ad hoc snow surveys at the study sites. Observations were
performed according to Fierz et al. (2009).                            2.3   Data analysis
   At the two test sites, instrumentation was installed for
measuring snow gliding and snow and soil properties                    During the two monitoring seasons, we selected different pe-
(Fig. 3). At each test site, two glide-snow shoes, connected           riods for the analyses of the data registered by each single
to potentiometers (Sommer® ), were placed within the area              glide shoe at the two test sites (Table 1). In fact, the four
where glide cracks were observed in the past. In addition              glide shoes showed different patterns (see later in Sect. 3).
to the glide-snow shoes, temperature sensors (Campbell –               Moreover, the periods for the analyses were also chosen ac-
107 temperature probe) and volumetric liquid water con-                cording to the specific snow conditions observed at the sites,

www.nat-hazards-earth-syst-sci.net/19/2667/2019/                              Nat. Hazards Earth Syst. Sci., 19, 2667–2676, 2019
2670                                                                M. Maggioni et al.: Snow gliding and glide-snow avalanches

Table 1. Periods of analyses for each single glide shoe at the           Concerning glide-snow avalanche events, we explore pos-
two test sites during the two monitoring seasons. Dates are in        sible differences between driving factors measured at the mo-
day/month/year; N indicates the number of data in the correspond-     ment of the events (semi-hourly data) for warm and cold
ing period.                                                           events, applying the Wilcoxon–Mann–Whitney test.
                                                                         We executed univariate (Mann–Whitney U test) and mul-
 Period                    Glide-snow shoe    Cold/warm      N        tivariate (classification trees) statistical analyses to explore
 Pista Nera                                                           differences between periods of gliding (identified as those
                                                                      days with a daily glide rate greater than 0.5 cm d−1 for at
 31/10–21/11/2013          S1 and S2          cold          22
                                                                      least one glide shoe) and periods of no gliding. Initially, we
 19/12/2013–6/03/2014      S1 and S2          cold          78
 7–18/03/2014              S1 and S2          warm          12
                                                                      considered the whole dataset at once and then we classified
 23–28/03/2014             S1 and S2          warm           6        into cold and warm periods at the two test sites, in order to
 19–22/04/2014             S1 and S2          warm           4        investigate the potential differences in the driving factors.
 27–29/04/2014             S1 and S2          warm           3           We also checked potential relationships between glide rate
 28/10–8/11/2014           S1 and S2          warm          12        and soil VLWC.
 9–12/11/2014              S2                 warm           4           In addition to the above-mentioned quantitative analyses,
                                                                      we also made a qualitative description of the two monitoring
 Sant’Anna
                                                                      seasons, trying to explain some patterns found in the regis-
 31/10–24/11/2013          S1 and S2          cold          25        tered values for specific days.
 19/12/2013–6/03/2014      S1 and S2          cold          78
 7/03–09/05/2014           S1 and S2          warm          64
 28/10–13/11/2014          S1 and S2          warm          17
 15–30/11/2014             S1 and S2          warm          16        3     Results and discussion
 1–24/12/2014              S2                 warm          24
 25/12/2014–6/03/2015      S2                 cold          72        3.1    Predisposing factor for glide avalanche events
 7/03–22/04/2015           S2                 warm          47
                                                                      Figures 4–7 report the pattern of the registered variables
                                                                      along the two monitoring seasons at the two test sites. In to-
                                                                      tal, we registered nine glide-snow avalanches. Other events
                                                                      occurred during the first season but were only observed
which influenced the significance of the registered tempera-          through field surveys without measurements by the glide-
ture and volumetric liquid content (VLWC) parameters. For             snow shoes. Among the measured events, two have been
example, after a glide avalanche event, identified as a large         classified as cold events and seven as warm events (among
sudden glide shoe movement and/or from field survey, the in-          which one was related to a rain-on-snow episode). Often the
strumentation was reset but the site remained with no snow            events occurred suddenly without appreciable snow gliding
until the next snowfall; therefore this period could not be con-      before.
sidered for analysis. In periods of no analyses the data regis-          The two cold glide-snow avalanche events were recorded
tered by the WCR probe in the basal snowpack layer might              in late autumn 2013 at both sites, while the warm events
show unrealistic values.                                              were recorded in both autumn and spring. In the literature
   We considered daily values, which were obtained by av-             (e.g. Dreier et al., 2016), cold events were usually associated
eraging the 30 min values for all parameters, except for the          with the beginning of the winter season, while warm ones
daily glide-snow rate, which was calculated as the difference         were only associated with the end. But the beginning of sea-
of the cumulative gliding at 23:30 local time between two             son 2014–2015 was meteorologically an exception. In fact,
consecutive days.                                                     November 2014 was the second warmest (air temperature
   As WCR probes were mainly designed to measure volu-                3.1 ◦ C above the average) and the rainiest (378 % more than
metric liquid water content in soils, we were able to trans-          the average) November of the previous 57 years in the NW
form the values recorded by the instrument place in the basal         Italian region (ARPA Piemonte, 2015). The conditions were
snowpack layer following the corrections found by Godio et            not typically winter; the first available snow profile (17 De-
al. (2018) during an experimental campaign carried out at the         cember) described a wet snowpack with melt forms in the
vicinity of the manual measuring site of Sant’Anna.                   basal layer. We classified the registered gliding events that
   We performed statistical analyses to investigate the differ-       occurred in November 2014 as warm; on 30 November a
ence between cold and warm gliding events in terms of driv-           glide avalanche due to a rain-on-snow (ROS) event occurred.
ing factors (snow and soil and VLWC, air temperature, snow            For such events soil VLWC was around 35 % in Sant’Anna,
height, new snow in 24 h). We assume that the distinction             while in Pista Nera it started around 15 % (5 November) and
between a cold and a warm temperature event is related to             increased to 22 % on 30 November. The soil was not frozen
the origin of the liquid water at the snow–soil interface as in       at both sites. In comparison to 2013–2014 the soil showed the
Ceaglio et al. (2017).                                                same values of VLWC in Sant’Anna, while in Pista Nera the

Nat. Hazards Earth Syst. Sci., 19, 2667–2676, 2019                             www.nat-hazards-earth-syst-sci.net/19/2667/2019/
M. Maggioni et al.: Snow gliding and glide-snow avalanches 2671 Figure 4. Site Pista Nera, winter season 2013–2014: (a) snow depth Figure 5. Site Sant’Anna, winter season 2013–2014: (a) snow (HS) from AWS Weissmatten and new snow sum (HN24) from depth (HS) from AWS Weissmatten and new snow sum (HN24) the manual snow measuring site Gabiet, (b) air temperature (TA) from manual snow measuring site Gabiet, (b) air temperature (TA) from AWS Weissmatten, (c) soil temperature, (d) VLWC measured from AWS Weissmatten, (c) soil temperature, (d) VLWC measured within the soil and in the basal snowpack layer, (e) cumulative glide. within the soil and in the basal snowpack layer, (e) cumulative glide. Warm and cold periods are highlighted in orange and blue, respec- Warm and cold periods are highlighted in orange and blue, respec- tively; periods reported in white are periods of no data analyses for tively; periods reported in white are periods of no data analyses for S1, S2 or both (see Table 1 for details). S1, S2 or both (see Table 1 for details). www.nat-hazards-earth-syst-sci.net/19/2667/2019/ Nat. Hazards Earth Syst. Sci., 19, 2667–2676, 2019
2672                                                                     M. Maggioni et al.: Snow gliding and glide-snow avalanches

Figure 6. Site Pista Nera, winter season 2014–2015: (a) snow
                                                                           Figure 7. Site Sant’Anna, winter season 2014–2015: (a) snow
depth (HS) from AWS Weissmatten and new snow sum (HN24)
                                                                           depth (HS) from AWS Weissmatten and new snow sum (HN24)
from manual snow measuring site Gabiet, (b) air temperature (TA)
                                                                           from manual snow measuring site Gabiet, (b) air temperature (TA)
from AWS Weissmatten, (c) soil temperature, (d) VLWC measured
                                                                           from AWS Weissmatten, (c) soil temperature, (d) VLWC measured
within the soil and in the basal snowpack layer, (e) cumulative glide.
                                                                           within the soil and in the basal snowpack layer, (e) cumulative glide.
Warm and cold periods are highlighted in orange and blue, respec-
                                                                           Warm and cold periods are highlighted in orange and blue, respec-
tively; periods reported in white are periods of no data analyses
                                                                           tively; periods reported in white are periods of no data analyses for
for S1, S2 or both (see Table 1 for details) (the period 9–12 Novem-
                                                                           S1, S2 or both (see Table 1 for details) (from 1 December 2014 to
ber 2014 has no analyses for S1). In periods of no analyses the data
                                                                           the end of the season there are no analyses for S1).
registered by the WCR probe in the basal snowpack layer might
show unrealistic values.

Nat. Hazards Earth Syst. Sci., 19, 2667–2676, 2019                                 www.nat-hazards-earth-syst-sci.net/19/2667/2019/
M. Maggioni et al.: Snow gliding and glide-snow avalanches 2673
soil was wetter in November 2014 than in November 2013.
Soil in Sant’Anna was in general wetter than in Pista Nera in
both seasons.
Analysing the patterns of air temperature and snow height,
we could appreciate the fact that the warm events often oc-
curred after a snowfall followed by an increase in air temper-
ature, resulting in a decrease in the snow depth. This clearly
occurred for the event in March 2014 in Pista Nera (Fig. 4).
For warm events this might describe the situation in which
snow melting occurred at the snow surface with percolating
water through the snowpack down to the snow–soil interface
with a lowering of the basal friction. The same occurred for
the cold events in November 2013 at both sites, but with a
less sharp decrease in the snow depth.
Comparing Sant’Anna and Pista Nera after the first snow-
fall at the end of November 2013, it is interesting to notice
how this snowfall caused a snow gliding phenomenon at the
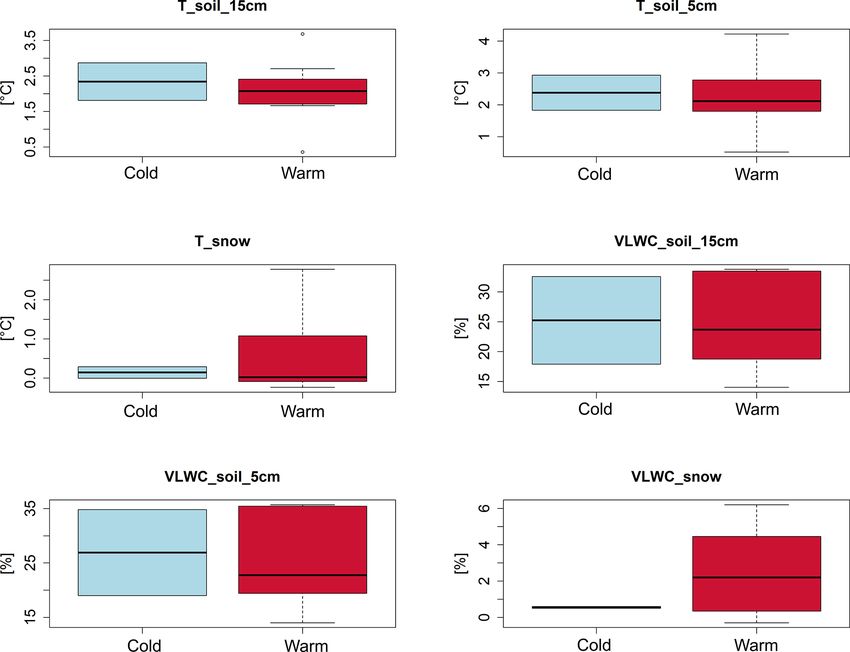
Figure 8. Box plots of the parameters registered at the moment of
Pista Nera site earlier than at Sant’Anna. In Pista Nera a glide the cold and warm glide-snow avalanche events (values registered
avalanche occurred on 21 November, while in Sant’Anna 30 min before the events).
one occurred on 24 November. From the analysis of the col-
lected data, soil temperature in Pista Nera (2.9 ◦ C) was 1 ◦ C
warmer than in Sant’Anna (1.8 ◦ C), while soil moisture in
Pista Nera (19 %) was about half that in Sant’Anna (35 %). on 21 November (which denudated the soil) and 14 Jan-
Probably, the reason for the earlier movement in Pista Nera uary. Therefore, after the event on 21 November, S2 did not
than in Sant’Anna lies in the average inclination of the sites, move because one of the necessary conditions for gliding was
which is 40◦ for Pista Nera and 36◦ for Sant’Anna, and in the not present (snow–soil interface at 0 ◦ C). Instead S1, which
vegetation characteristics. Vegetation in Pista Nera is more was not involved in the glide avalanche of 21 November, re-
favourable for gliding than that in Sant’Anna: though there mained below 1 m of snow plus 30 cm from the snowfall on
are sparse lignified shrubs, Pista Nera presents longer grass, 19 December, when it started moving again continuously. At
not grazed, while Sant’Anna is usually grazed by dairy cows. the location of S1 the snow on the ground was more than 1 m
The differences in inclination and vegetation between the and possibly the soil was not frozen, favouring a continuous
sites might also explain why in March 2014 the combina- and gradual snow gliding, as registered by S1.
tion of a snowfall followed by an increase in air tempera- Simple descriptive statistics of the variables registered
ture produced a glide avalanche only in Pista Nera and not at the moment of the glide avalanche events (box plots in
in Sant’Anna. However, despite some differences between Fig. 8) showed that the cold glide-snow avalanche events
the two sites, they both belong to classes which present a were characterized, on average, by (i) a slightly higher soil
low basal friction, favourable for snow gliding (Feistl et al., VLWC (26.9 % and 25.3 %) than in warm events (25.6 %
2014). and 24.9 %) at 5 and 15 cm depths, respectively; (ii) a lower
The complexity of the experimental test sites, with couples VLWC (0.6 %) in the snowpack basal layer than in warm
of glide shoes which behaved differently, could give us the events (2.5 %); (iii) a slightly higher soil temperature at 5 and
possibility of trying to explain some differences between the 15 cm depths (difference of 0.1 and 0.3 ◦ C, respectively) than
glide shoes. in warm events. Though it seems that there exist some little
For example, at the beginning of the 2013–2014 season, differences between the predisposing factors registered at the
in Pista Nera a glide avalanche occurred on 21 Novem- moment of the cold and warm glide-snow avalanche events,
ber involving glide shoe S2 in its movement (Fig. 4). This the differences are not statistically significant (Wilcoxon–
avalanche occurred after the first consistent snowfall of more Mann–Whitney test). The fact that in cold events, registered
than 1 m of new snow (Fig. 4). After this first event, no snow- at the beginning of the season, soil temperatures were higher
fall occurred until 19 December when 30 cm of new snow than in warm events might be explained by the heat stored by
fell again. Glide shoe S2, which was reset on 27 November, the soil during the summer; while for the warm events in late
did not move anymore until the last small and fast move- spring the longer presence of the snowpack did not allow the
ment in April 2014. The data of soil temperature and mois- soil to warm up and soil temperatures remained lower. Minor
ture showed that the soil remained frozen until 14 January. VLWC values in the basal snowpack layer during cold events
The instruments were closer to S2 than S1, then represent- represent the fact that the snow cover was cold, being formed
ing the situation of no (or little, i.e. 30 cm from the snow- by the first probably cold and dry snowfalls, while in spring
fall on 19 December) snow on the ground between the event the VLWC of the basal layer of the snow cover is the result
www.nat-hazards-earth-syst-sci.net/19/2667/2019/ Nat. Hazards Earth Syst. Sci., 19, 2667–2676, 20192674 M. Maggioni et al.: Snow gliding and glide-snow avalanches
of percolating water from above layers (the available water is
more than that of cold snowpack at the beginning of the sea-
son). For the warm events at the beginning of the 2014–2015
season, the VLWC in the snow was related to the melting of
the first snowfalls that occurred in November with warm air
temperature (see Figs. 6 and 7).
3.2 Gliding vs. non-gliding periods
In Sant’Anna and Pista Nera the differences between gliding
and non-gliding periods in terms of the measured parameters
(Tables 2 and 3) were highly significant when considering the
whole dataset together, while in Pista Nera significant differ-
ences were found only in cold periods and in Sant’Anna only
in warm periods. Some differences could be reasonably ex-
plained by what we think the snow gliding process is, also
according to existing literature (e.g. Höller, 2014 and Ancey
and Bain, 2015), while others are difficult to understand. For
example, in Pista Nera the VLWC in the snow was signifi-
cantly higher for gliding than for non-gliding periods when
considering the whole dataset or cold periods. This was also
found by Fromm et al. (2018) and Ceaglio et al. (2017). In-
stead, in Sant’Anna there was no difference in the VLWC of
snow during cold periods; a little significant difference was
found in warm periods, but the VLWC of snow was higher in
non-gliding than in gliding periods, revealing how other pre-
disposing factors could contribute to the snow gliding pro-
cess.
The multivariate CART analyses produced results, for the
whole dataset or dividing warm and cold periods, which
show how different variables (e.g. air temperature, soil tem-
perature and VLWC) appear in the decision process (splitting
nodes) but without a general trend.
3.3 Predisposing factors for snow gliding Figure 9. Fitting model between daily glide-snow rates for S1 and
volumetric liquid water content (VLWC) measured in Pista Nera at
In Pista Nera for the warm gliding periods at the end of the 5 cm (a) and 15 cm (b) soil depths during the warm events of the
2014 season.
season, the daily glide rate showed a significant (p < 0.001)
exponential relationship with the soil VLWC at both depths
(Fig. 9). Conversely, we did not find any relationship between 53 % (topsoil) and 47 % (underlying horizon), values never
the glide rate and the soil VLWC in the continuous cold glid- measured by the WCR sensors (Fig. 4). In Mt de La Saxe soil
ing period in Pista Nera, as we have recently found at an- liquefaction was possible (and actually observed in the field),
other experimental test site in the same region (Ceaglio et al., while in Pista Nera this was not observed at all. Therefore, in
2017). The difference between those findings and the results Mt de La Saxe a further driving factor for snow gliding in
presented here might also be related to the soil properties cold periods might have been soil liquefaction, which did not
of the two different test sites, in particular to the Atterberg occur in Pista Nera in 2014.
liquid limits. The Atterberg liquid limits (LLs) represent the For Sant’Anna we did not find any relationship between
soil moisture content value determining the transition from the daily glide rate and the soil VLWC for both the identified
the plastic to the liquid state (LL) (Lal and Shukla, 2004; warm and cold periods.
Stanchi et al., 2012). The LL for the deeper soil horizon (10–
20 cm depth) at the site of Mt de La Saxe (in Ceaglio et al.,
2017) was around 48 %–67 %, and the registered soil VLWC
was around 50 %. In Pista Nera (where we registered a cold
gliding period in 2013–2014 which did not show any rela-
tionship between the glide rate and the VLWC) the LL was
Nat. Hazards Earth Syst. Sci., 19, 2667–2676, 2019 www.nat-hazards-earth-syst-sci.net/19/2667/2019/M. Maggioni et al.: Snow gliding and glide-snow avalanches 2675
Table 2. Pista Nera: summary statistics showing median values of various variables for gliding days (Gd) and non-gliding days (NonGd).
For each variable, distributions were contrasted (Mann–Whitney U test), and the level of significance p is given. Temperatures are in degrees
Celsius, VLWC is in percent and snow height is in centimetres.
Variables All data Cold periods Warm periods
Gd NonGd p value Gd NonGd p value Gd NonGd p value
T_snow −0.19 −0.22 0.173 −0.2 −0.2 0.684 0.75 −0.22 0.354
VLWC_snow 1.8 0 < 0.001∗∗∗ 1.81 0 < 0.001∗∗∗ 1.8 3.57 0.585
T_soil5cm 0.55 3.13 0.022∗ 0.37 3.15 0.043∗ 2.7 0.58 0.288
VLWC_soil5cm 16.3 19.12 0.085 16.18 17.67 0.06 18.29 21.29 0.727
T_soil15cm 0.23 3.11 0.007∗∗ −0.01 3.2 0.043* 2.21 0.38 0.202
VLWC_soil15cm 14.8 18.11 0.04∗ 14.65 17.26 0.048∗ 18.75 20.89 0.601
TA −1.9 −0.8 0.291 −2.9 −0.3 0.001∗∗ 2.8 −2.15 0.009∗∗
HN24 0 2.5 0.838 2 0 0.805 0 5 0.474
HS 157 56 0.084 156 21 < 0.001∗∗∗ 163 212 0.394
Table 3. Sant’Anna: summary statistics showing median values of various variables for gliding days (Gd) and non-gliding days (NonGd).
For each variable, distributions were contrasted (Mann–Whitney U test), and the level of significance p is given. Temperatures are in degrees
Celsius, VLWC is in percent and snow height is in centimetres.
Variables All data Cold periods Warm periods
Gd NonGd p value Gd NonGd p value Gd NonGd p value
T_snow −0.05 −0.07 < 0.001∗∗∗ −0.05 −0.06 0.619 −0.05 −0.08 < 0.001∗∗∗
VLWC_snow −0.27 4.5 0.378 −0.41 −0.51 0.846 −0.25 10.8 0.026*
T_soil5cm 0.6 0.38 < 0.001∗∗∗ 0.53 0.44 0.1 0.64 0.31 < 0.001∗∗∗
VLWC_soil5cm 34.58 32.67 < 0.001∗∗∗ 32.45 32.01 0.115 35.33 35.36 0.676
T_soil15cm 0.55 0.37 < 0.001∗∗∗ 0.46 0.38 0.139 0.93 0.29 < 0.001∗∗∗
VLWC_soil15cm 32.86 30.88 < 0.001∗∗∗ 30.75 30.5 0.066 33.52 33.53 0.378
TA −0.1 −0.65 0.593 −3.5 −2.6 0.361 1.35 3.6 0.002∗∗
HN24 0 0 0.044∗ 0 0 0.568 0 0 0.001∗∗
HS 127 144 0.001∗∗ 123 130 0.164 139 156 < 0.001∗∗∗
4 Conclusions rate increased exponentially compared to the VLWC in the
soil.
In conclusion, among the parameters considered in this
In this study, through a 2-year field campaign, we analysed study, which sometimes showed contrasting effects, our find-
the predisposing factors for snow gliding and glide-snow ings contribute to assessment of the importance of soil wa-
avalanches. ter content in snow gliding processes. Therefore, this result
From the data registered in two monitoring seasons at two supports the need, already suggested by other scientists (e.g.
experimental test sites in Aosta Valley, even if the differences Höller, 2014), of analysing such processes with an interdis-
are not significant, we found that cold glide-snow avalanche ciplinary approach which integrates snow and soil science.
events occurred with a higher VLWC in the soil and a lower An effort which should be made by scientists would be to
VLWC in the basal snowpack layer than in warm events. share all the data collected at the different experimental test
Significant differences were instead found between the sites, in order to create a common rich database and to be able
predisposing factors during gliding and non-gliding periods, to analyse the driving factors for snow gliding processes, also
considering the whole dataset together or dividing cold and including site characteristics. Doing so, the results obtained
warm gliding periods. However, no general trend during cold at the different test sites might be generalized.
or warm periods was found at the two test sites.
Our analysis on the potential driving factors for gliding
Data availability. The datasets generated and analysed during the
processes underlined the importance of soil VLWC, in partic-
current study are available from the corresponding author upon rea-
ular for warm glide events. Though we could not find a clear
sonable request.
and generalizable trend, the example of the warm gliding pe-
riods in 2014 at the site Pista Nera shows how the glide-snow
www.nat-hazards-earth-syst-sci.net/19/2667/2019/ Nat. Hazards Earth Syst. Sci., 19, 2667–2676, 20192676 M. Maggioni et al.: Snow gliding and glide-snow avalanches
Author contributions. MM and MF designed the study; MM col- Feistl, T., Bebi, P., Dreier, L., Hanewinkel, M., and Bartelt,
lected data; MM and DG completed the data analysis; BF led the P.: Quantification of basal friction for technical and silvicul-
project execution; MM led the writing with revisions and contribu- tural glide-snow avalanche mitigation measures, Nat. Hazards
tions from all authors. All the authors approved the final version. Earth Syst. Sci., 14, 2921–2931, https://doi.org/10.5194/nhess-
14-2921-2014, 2014.
Fierz, C., Armstrong, R. L., Durand, Y., Etchevers, P., Greene, E.,
Competing interests. The authors declare that they have no conflict McClung, D. M., Nishimura, K., Satyawali, P. K., and Sokra-
of interest. tov, S. A.: The international classification for seasonal snow on
the ground. IHP-VII Technical Documents in Hydrology No. 83,
IACS Contribution No. 1, UNESCO-IHP, Paris, 2009.
Acknowledgements. The work was developed within the Unità Fromm, R., Baumgärtner, S., Leitinger, G., Tasser, E., and Höller,
di ricerca “Mountain Risk Research Team” and supported by P.: Determining the drivers for snow gliding, Nat. Hazards
the NextData-LTER-Mountain project. We would like to thank Earth Syst. Sci., 18, 1891–1903, https://doi.org/10.5194/nhess-
the Ufficio Neve e Valanghe (Fondazione Montagna sicura) and 18-1891-2018, 2018.
the Centro Funzionale of the Aosta Valley region for avalanche, Godio, A., Frigo, B., Chiaia, B., Maggioni, M., Freppaz, M.,
snow and weather data. We also thank Laura Dublanc, Elisa- Ceaglio, E., and Dellavedova, P.: Integration of upward GPR
betta Ceaglio, Davide Viglietti, Giuseppe Comola, Arnoldo Welf and water content reflectometry to monitor snow properties,
and Monterosa S.p.a. for technical and logistic support at the exper- Near Surf. Geophys., 16, 1–10, https://doi.org/10.3997/1873-
imental test sites. 0604.2017060, 2018.
Hartmann, D. L., Klein Tank, A. M. G., Rusticucci, M., Alexan-
der, L. V., Brönnimann, S., Charabi, Y., Dentener, F. J., Dlugo-
kencky, E. J., Easterling, D. R., Kaplan, A., Soden, B. J., Thorne,
Financial support. This research has been supported by Regione
P. W., Wild, M., and Zhai, P. M.: Observations: Atmosphere and
Autonoma Valle d’Aosta (Bando per la creazione e lo sviluppo
Surface. In: Climate Change 2013: The Physical Science Basis.
di Unita di Ricerca, D.G.R. n. 1988, 26/08/2011) and NextData
Contribution of Working Group I to the Fifth Assessment Report
Data-LTER-Mountain Project (protocollo ISAC CNR n. 0000326,
of the Intergovernmental Panel on Climate Change, edited by:
30/01/2014).
Stocker, T. F., Qin, D., Plattner, G.-K., Tignor, M., Allen, S. K.,
Boschung, J., Nauels, A., Xia, Y., Bex, V., and Midgley, P. M.,
Cambridge University Press, Cambridge, United Kingdom and
Review statement. This paper was edited by Oded Katz and re- New York, NY, U”Sant’Anna”, 2013.
viewed by Christophe Ancey and one anonymous referee. Höller, P.: Snow gliding and glide avalanches: a review, Nat. Haz-
ards, 71, 1259–1288, https://doi.org/10.1007/s11069-013-0963-
9, 2014.
In der Gand, H. and Zupancic, M.: Snow gliding and avalanches,
References IAHS Publ., 69, 230–242, 1966.
Lal, R. and Shukla, M. K.: Principles of Soil Physics. Marcel
Ancey, C. and Bain, V.: Dynamics of glide avalanches
Dekker Inc., NewYork-U”Sant’Anna”, Basel, CH, 2004.
and snow gliding, Rev. Geophys., 53, 745–784,
Leitinger, G., Hoeller, P., Tasser, E., Walde, J. and
https://doi.org/10.1002/2015RG000491, 2015.
Tappeiner, U.: Development and validation of a spa-
ARPA Piemonte (Sistemi Previsionali): Rapporto tecnico mensile
tial snow-glide model, Ecol. Model., 211, 363–374,
Novembre 2014, 2015.
https://doi.org/10.1016/j.ecolmodel.2007.09.015, 2008.
Castebrunet, H., Eckert, N., Giraud, G., Durand, Y., and Morin,
Maggioni, M., Godone, D., Höller, P., Oppi, L., Stanchi, S., Frigo,
S.: Projected changes of snow conditions and avalanche ac-
B. and Freppaz, M.: Snow gliding susceptibility: the Mon-
tivity in a warming climate: the French Alps over the 2020–
terosa Ski resort, NW Italian Alps, J. Maps, 12, 115–121,
2050 and 2070–2100 periods, The Cryosphere, 8, 1673–1697,
https://doi.org/10.1080/17445647.2016.1167785, 2016.
https://doi.org/10.5194/tc-8-1673-2014, 2014.
Margueritat, D.: Retour d’observations sur les plaques de reptation,
Ceaglio, E., Mitterer, C., Maggioni, M., Ferraris, S., Segor, V., and
Neige & Avalanches, 152, 18–22, 2016.
Freppaz, M.: The role of soil volumetric liquid water content dur-
Morán-Tejeda, E., López-Moreno, J. I., Stoffel, M., and Beniston,
ing snow gliding processes, Cold Reg. Sci. Technol., 136, 17–29,
M.: Rain-on-snow events in Switzerland: Recent observations
https://doi.org/10.1016/j.coldregions.2017.01.007, 2017.
and projections for the 21st century, Clim. Res., 71, 111–125,
Clarke, J. A. and McClung, D. M.: Full-depth
https://doi.org/10.3354/cr01435, 2016.
avalanche occurrences caused by snow gliding. Co-
Stanchi, S., Freppaz, M., and Zanini, E.: The influence of Alpine
quihalla, B.C., Canada, J. Glaciol., 45, 539–546,
soil properties on shallow movement hazards, investigated
https://doi.org/10.3189/S0022143000001404, 1999.
through factor analysis, Nat. Hazards Earth Syst. Sci., 12, 1845–
Dreier, L., Harvey, S., van Herwijnen, A., and Mitterer,
1854, https://doi.org/10.5194/nhess-12-1845-2012, 2012.
C.: Relating meteorological parameters to glide-snow
avalanche activity, Cold Reg. Sci. Technol., 128, 57–68,
https://doi.org/10.1016/j.coldregions.2016.05.003, 2016.
Nat. Hazards Earth Syst. Sci., 19, 2667–2676, 2019 www.nat-hazards-earth-syst-sci.net/19/2667/2019/You can also read