Sweat responses during inactive recovery after high-intensity running in hot, dry and humid conditions
←
→
Page content transcription
If your browser does not render page correctly, please read the page content below
Original Article

Sweat responses during inactive recovery after
high-intensity running in hot, dry and humid
conditions
ERIK HØYE1, MARIANN SANDSUND2 1 , RANDI EIDSMO REINERTSEN1,2
1Department of Biology, Norwegian University of Science and Technology, Trondheim, Norway
2Department of Health Research, SINTEF Digital, Trondheim, Norway

 ABSTRACT

This study investigated the relationship between high (85%) and low (19%) relative humidity (RH) and sweat
rate during inactive recovery after high-intensity work in a hot environment (30 °C). Ten male subjects
performed two 20-minute run trials at 68 ± 4 % of maximal oxygen consumption (VO2max) followed by 36
minutes of inactive recovery in standing position. Regional sweat rate (RSR) was measured on the forearm
and mid-central back by technical absorbent pads, and gross sweat loss was estimated from change in body
weight. Core temperature (Tc) and six skin temperatures for calculation of mean skin temperature (Ts) were
measured continuously together with heart rate (HR) during running and recovery. Results show that RSR
was significantly (p
Høye et al. / Sweat responses after running in hot, dry and humid conditions JOURNAL OF HUMAN SPORT & EXERCISE INTRODUCTION Sweating is the main physiological mechanism for heat loss during work at high ambient temperatures (Ta) (Shibasaki et al., 2006; Wyndham et al., 1965) and sweat production and regulation of sweating have been the objects of many studies (Cotter et al., 1995; Havenith et al., 2008a; Machado-Moreira et al., 2008; Nadel et al., 1971; Nadel and Stolwijk, 1973; Smith and Havenith, 2010). Aerobic fitness, acclimation status, environmental conditions, clothing and evaporative efficiency are all important modifiers of sweat production (Candas et al., 1979; Havenith et al., 2008b; Shapiro et al., 1982). Sweat evaporation in a hot environment is highly dependent on the relative humidity (RH), as it relies on the water-vapour pressure gradient between the skin surface and immediate environment. Several studies have been conducted on total sweat loss, or gross sweat loss (GSL), of the whole body under a wide range of conditions and activities. In recent years, differences in regional sweat rates (RSR) have attracted attention as a result of research on clothing design, thermophysiological modelling and thermal manikins (Havenith, 2001; Havenith et al., 2008b; Smith and Havenith, 2010). It is now well established that RSR varies greatly with body location. RSR is the highest on the back along the lumbar spine and is greatly reduced in the extremities (Cotter et al., 1995; Havenith et al., 2008a; Machado-Moreira et al., 2008; Smith et al., 2007). A study by Smith and Havenith (2010) mapped the RSR of the entire body of male athletes during mild exercise and registered the highest sweat rates on the central back and the lowest on the hands and feet. The sweating response during exercise in humans is determined by changes in thermal and non-thermal factors (Kenny and Journeay, 2010; Shibasaki et al., 2006). Type of exercise training influences sweating response (Amano et al., 2011) and fitness level can significantly affect thermoregulatory functions (Henane et al., 1977). Exercise or work in hot and humid environments is especially challenging for the thermoregulatory capacity of the body (Wendt et al., 2012; Werner, 1988). Maughan et al. (2012) showed a significant decrease in endurance exercise capacity with increasing RH (24%, 40%, 60%, 80%). They also showed a greater whole-body sweat rate as relative humidity increased (Maughan et al., 2012). The reduced performance in hot humid environments can be linked to less efficient sweat evaporation as the gradient between ambient water vapour pressure and skin hydration decreases (Candas et al., 1979; Wendt et al., 2012). Exercise under hot and humid conditions may therefore exceed the capacity of the evaporative heat loss mechanism, due to the limited capacity of the environment to hold water vapour (Wendt et al., 2012). The decrease in heat loss capacity is further reduced during prolonged sweating, profound sweating or high-humidity conditions due to the effect of hidromeiosis (Candas et al., 1983, 1980). The thermoregulatory responses of passive (assisted loadless pedalling), inactive (no activity) and active (loadless pedalling) on post-exercise recovery in addition to nonthermal effects have been investigated in earlier studies (Carter III et al., 2002; Jay et al., 2008; Journeay et al., 2006, 2004; Wilson, 2004). These studies were performed under thermoneutral conditions from 24 to 25 C and only two studies have reported RH values (Journeay et al., 2004; 2005). Several studies have investigated the effect of hot and humid conditions on exercise performance. Fewer studies have looked at post-exercise recovery in hot and humid conditions. However, to the authors’ knowledge, the effects of high (above 80%) and low RH on post-exercise recovery have not been evaluated. This knowledge may be of importance to ensure optimal evaporation in the development of high-performance clothing and to reduce heat stress for improved athletic performances in high temperature and humidity environments. 2 | 2019 | ISSUE - | VOLUME -- © 2019 University of Alicante
Høye et al. / Sweat responses after running in hot, dry and humid conditions JOURNAL OF HUMAN SPORT & EXERCISE

The aim of this study was to investigate the relationship between high (85%) and low (19%) RH and sweat
rate during inactive recovery after high-intensity exercise in a hot (30 °C) environment. We hypothesised that
RSR, GSL, heart rate (HR), mean skin temperature (Ts) and core temperature (Tc), are higher during post-
exercise inactive recovery in 85% RH than in 19% RH at 30 °C.

MATERIALS AND METHODS

Participants
Ten healthy young males volunteered to participate in the study. The characteristics (mean and (SD)) of the
participants were: age, 23 years (±2); height, 181 cm (±5); weight, 74.4 kg (±11.1); body fat, 11.7% (±3.4)
and maximum oxygen consumption (VO2max), 60.3 ml·min-1·kg-1 (±7.6) (range 49.4-71.4 ml·min-1·kg-1). All
participants were informed about the aim of the study, the test protocol and their rights to terminate their
participation at any time in accordance with the Declaration of Helsinki before they provided written consent.
The study was approved by the Regional Committee for Medical and Health Research Ethics in Norway.

Procedures
The participants were subjected to one pre-test and two main tests between February and March. The tests
were performed in a climatic chamber in the Work Physiology Laboratory of the Department of Health
Research at SINTEF.

Pre-tests
All the subjects attended a pre-test session to define VO2max, record their anthropometric data and familiarise
themselves with the main test procedures. Ta during the pre-tests was 20.4 ± 0.7 °C and RH was 38 ± 5%.
The pre-test measurements were used to determine individual running speeds and the area and placement
of sweat pads for the forearm and lower-mid back, used in the main tests.

Main tests
Each subject performed two main tests, one in a high-humidity (85 ± 2% RH) environment and the other in
a low-humidity (19 ± 2% RH) environment. Ta was 30°C in each trial. Temperature and RH were measured
four times during the test by a hand-held thermostat (Testo 435, Testo, Lenzkirch, Germany); accuracy ± 0.3
°C, ± 2%. Average Ta during the study was calculated from measurements taken after 5 and 20 minutes of
running, and 15 and 30 minutes of recovery. The subjects were exposed to the two environments in a
counterbalanced order. Each test subject performed the tests at the same time of day, with a minimum of 48
hours between test sessions.

On arrival at the laboratory, the subjects were weighed, before inserting a rectal probe. After dressing in
shorts and shoes, six thermistors, a heart-rate recorder and frames for sweat-sampling pads were attached
to the forearm and lower back. The main test started with a 20-minute rest at 22.8 ± 0.9°C and 24 ± 3% RH.
Sweat sampling pads were applied during the last five minutes of rest and the subjects were asked to
evaluate their thermal comfort and sensation. After the initial rest, the subjects moved into the climatic
chamber where they started to run on a treadmill (PPS 55 sport-1 climatel, Woodway, Weil am Rhein,
Germany) at 68 ± 4% VO2max and 6° incline for 20 minutes. The recovery period lasted for 36 minutes. VO2
was measured during the first and last five minutes of running. After 15 minutes of running, test subjects
stopped to allow sweat-sampling pads to be applied for the final five minutes of the run. Recovery in a
standing position started as soon as the running session ended. Sweat sampling pads were changed every
five minutes during recovery. The running period, including pad changes was 20 minutes and 17 seconds
(±20 seconds). The total recovery period, including pad changes was 35 minutes and 37 seconds (±29

 VOLUME -- | ISSUE - | 2019 | 3
Høye et al. / Sweat responses after running in hot, dry and humid conditions JOURNAL OF HUMAN SPORT & EXERCISE

seconds). VO2 was measured after 15 minutes of recovery. Thermal sensation and comfort were evaluated
after five minutes of running, immediately after cessation of running, 10 minutes into the recovery period and
immediately after the recovery. The subjects were allowed to drink water (30.6 ± 2.1°C) at five, 15, 20 minutes
into the running protocol and 10, 20 and 30 minutes into the recovery period. All water intake was recorded.
Body weight was re-measured immediately after the end of the recovery period.

Measurements
Regional sweat rate
Sweat were sampled with a technical absorbent material (Air Laid 2240CW1+, Meditas, Grimsby, United
Kingdom), which was fitted into pads for each individual test subject. Sweat sampling pad (hereafter, sweat
pad) sizes were calculated following the method of Smith and Havenith (2010), and their areas were
estimated using exact measures of pre-cut outlines following the method described by Morris et al. (2013).
Eight sweat pads for both arm and back were weighed (Sartorius AG, Göttingen, Germany; accuracy ± 0.01
g), and stored in airtight zip-lock bags before each test. Posterior lower arm and central mid back were chosen
as sweat pad locations on the basis of current literature, as they give a good representation of a minimum
and maximum sweat rate location (Havenith et al., 2008a; Morris et al., 2013; Smith and Havenith, 2010). In
order to ease the application and removal of sweat pads on the arm, these were scaled down by 50%
compared to Smith and Havenith (2010). Frames and sweat pads on the back were kept in place by a
compression bandage (Comprilan 8 cm x 5 m, 100% cotton, BSN Medical AB, Gothenburg, Sweden) which
was wrapped around the abdomen. A-tube compression bandage was used on the right arm (Tubifast 7.5
cm x 1 m, Mölnlycke Health Care, Gothenburg, Sweden).

Sweat rate was measured at 5-minute intervals. The sweat pads took an average of 56 ± 5 seconds to
change. They were applied during the last five minutes of the initial rest, running period and every 5 minutes
during recovery. These are hereafter referred to as samples 1-8.

RSR (g·m-2·h-1) was calculated from Eq. 1, modified from Smith and Havenith (2010).

 = (60 ∙ ∆ ) ∙ ( ∙ )−1 (1)

where ΔM is the difference in weight of the sweat pad before and after application (g), t is the application
time (min), A is the measured area of the sweat pad (m2).

Gross sweat loss
Subjects were weighed (ID1, Mettler Toledo, Albstadt, Germany; accuracy ±0.006 kg), before and after each
test. GSL was calculated (Eq. 2) from the weight loss of participants (ΔM) and corrected for ingested water
(WI) during the test, respiratory water loss (RWL) and metabolic mass loss (MML) (Cheuvront et al., 2002).

 = ∆ + − − (2)

RWL was calculated from respiratory evaporation (Eres) by Eq. 3 and converted into RWL by Eq. 4 (Smith
and Havenith, 2010).

 = 1.27 ∙ 10−3 ∙ ∙ {59.34 + (0.53 ∙ ) − (11.69 ∙ )} (3)

 = ∙ ∙ 2430−1 (4)

 4 | 2019 | ISSUE - | VOLUME -- © 2019 University of Alicante
Høye et al. / Sweat responses after running in hot, dry and humid conditions JOURNAL OF HUMAN SPORT & EXERCISE
where Eres is the evaporative heat loss (W), MR is the metabolic rate (W), Ta is the ambient temperature, Pa
is the partial water vapour pressure (kPa), t is the duration of the experiment (sec), 2430 is the latent heat of
1g of water (J·g-1). MR were calculated from the simple equation of metabolic rate (Eq. 5) by McIntyre (1980).
= ∙ (0.2093 − ) (5)
where VE is the ventilation rate (L·s-1) and Oe is the fraction of oxygen in the expired air.
MML were calculated using Eq. 6 from Mitchell et al (1972).
= 2 ∙ { ∙ ( 2 ∙ 2 )} (6)
where VO2 is the oxygen consumption (L·min-1), RER is the measured respiratory exchange ratio, ρCO2 and
ρO2 are the densities of carbon dioxide (1.96 g·L-1) and oxygen (1.43 g·L-1).
Oxygen consumption
VE, VO2 and Oe were measured with an Oxycon Pro® apparatus (JCAB 5.x, Jaeger, Hoechberg, Germany);
accuracy 0.05 L·min-1. Data were registered every 20 seconds during the first and last five minutes of running,
and after 15 minutes of recovery.
Heart rate
HR was continuously measured during the initial rest, running and inactive recovery periods by a Polar RS800
HR recorder (Polar Electro Oy, Kempele, Finland; accuracy ± 1 bpm).
Core and skin temperatures
Skin temperatures were measured by skin thermistors (YSI 400, YSI, Yellow Springs, Ohio, USA, ±0.15 °C)
at six locations: posterior lower arm, upper arm, chest, back, anterior thigh and anterior calf. T c was measured
using a rectal probe placed 10 cm into the rectum (YSI 400, YSI; ±0.15 °C). Core and skin temperatures
were continuously registered at 20-second intervals throughout the test. Ts was calculated according to
Teichner (1958).
Body fat
Body fat percentage was measured with a Harpender Skinfold Caliper during the pre-test. Four measurement
points were used: musculus biceps brachii, musculus triceps brachii, musculus subscapularis and musculus
suprailiacto to estimate body fat percentage according to Durnin and Womersley (1974).
Subjective evaluations
The subjects were asked to evaluate their perceived thermal sensation (PTS) and body comfort during the
initial rest, running and inactive recovery period. Questions were modified from Nielsen et al. (1989) and
scaled from -5 to 5, where -5 is extremely cold, 0 is neutral and 5 is extremely hot. Subjects were also asked
to rate their perception of sweating and skin wittedness. A 15-point Borg scale, on which 6 represents no
exertion and 20 is maximal exertion, was used to evaluate rating of perceived exertion (RPE) (Borg, 1985).
Analysis
HR, Tc and Ts are presented as one-minute running averages, and the last two minutes of each sweat sample
interval were used for statistical analyses. RSR are presented for each five-minute sample.
VOLUME -- | ISSUE - | 2019 | 5Høye et al. / Sweat responses after running in hot, dry and humid conditions JOURNAL OF HUMAN SPORT & EXERCISE RSR values were log10 transformed to obtain a normalised data distribution as the raw RSR values were skewed. VO2, VE , Oe and RER were calculated from the last two minutes of each measurement. In testing the correlation between RSR and local skin temperature, the data were left untransformed. The last two minutes of lower arm and back skin temperatures, i.e. samples two to eight, were used in the correlation analyses. In our calculations of GSL, the initial resting phase was assumed to have no impact on the total GSL and was not included in the analysis. GSL are calculated for the total testing time (running + inactive recovery). Due to differences in work intensity between running and recovery, metabolic rate (MR) was integrated into a single representative value based on the time weighted averages of each activity, in this case running and recovery (Parsons, 2014, p. 202). The running period accounted for 80 ± 3% of the total heat production and the recovery period 20 ± 3% of the total heat production, these values were derived from Parson (2014, p. 194). The number of subjects differs between parameters, due to loss of data or erroneous measurements during the tests. Statistical analysis Normality was assessed by means of Shapiro-Wilk’s test (p>0.05) and Q-Q plots, and equality of variances by Levene’s test (p>0.05). Outliers and distributions of data were inspected by boxplot or studentized residuals (±3 SD). If a test showed non-sphericity, a Greenhouse-Geisser adjustment was utilised. Linear and monotonic relationships were assessed by visual inspection of scatterplots. Two-way repeated measures analysis of variance (ANOVA) was used to examine interactions of the parameters RSR, HR, Tc and Ts between and within 85% RH and 19% RH humidity environments. If statistically significant interactions were found, simple main effects were analysed by Student’s t-test for paired samples between environments. Holm-Bonferroni (Holm, 1979) corrections for multiple comparisons were performed as post hoc tests. The Pearson correlation coefficient (r) was calculated for the relationship between GSL and MR, and GSL and VO2max. Due to the presence of outliers, Spearman’s rank correlation coefficient (r s) was calculated for the relationship between GSL and Ts, and RSR and local Ts for both arm and back. Correlations coefficient cut-offs were set to 0.3 to 0.5 for weak, 0.5 to 0.7 for moderate and above 0.7 for strong correlations (Mukaka, 2012). Differences between the slopes of the regression lines between 85% RH and 19% RH for RSR, HR, Tc and Ts were analysed using Student’s t-test for paired samples. The t-test for paired samples was also used to analyse differences in oxygen consumption. Friedman’s test was used to analyse differences in the ratings of PTS and RPE between rest, after 5 and 20 minutes of running, and after 10 and 30 minutes of inactive recovery. Differences in PTS and RPE between 19% RH and 85% RH were analysed with a Wilcoxon signed-rank test. Wilcoxon signed-rank test was used due to the non-parametric nature of the data and the violation of normality. Data is presented as mean ± standard deviation (SD), unless otherwise stated. Statistical significance was accepted at p
Høye et al. / Sweat responses after running in hot, dry and humid conditions JOURNAL OF HUMAN SPORT & EXERCISE

RESULTS

Regional sweat rate
Individual RSR during initial rest ranged between 1 to 17 g·m-2·h-1 and did not significantly differ between
environments. RSR decreased during recovery in both 85% RH and 19% RH on the back and arm, as shown
in Fig. 1. RSR were significantly (p
Høye et al. / Sweat responses after running in hot, dry and humid conditions JOURNAL OF HUMAN SPORT & EXERCISE

*Positive correlations between GSL and metabolic rate observed in both high- (r=0.78, p=0.002) and low-humidity environments
 (r=0.87, p=0.001).

Figure 2. Gross sweat loss (g·h-1) and weighted absolute mean metabolic rate (W) of subjects in high- (85%
RH) and low-humidity (19% RH) environments (n=10).

Oxygen consumption and heart rate
During the running period, the exercise intensity was 67 ± 4% VO2max during the first five minutes and 70 ±
4% VO2max during the final five minutes in 85% RH. The corresponding values were 67 ± 3% VO 2max and 69
± 4% VO2max in 19% RH. No significant differences in oxygen consumption between or within environments
were found.

 * indicates significant difference in HR between high- and low-humidity conditions (p
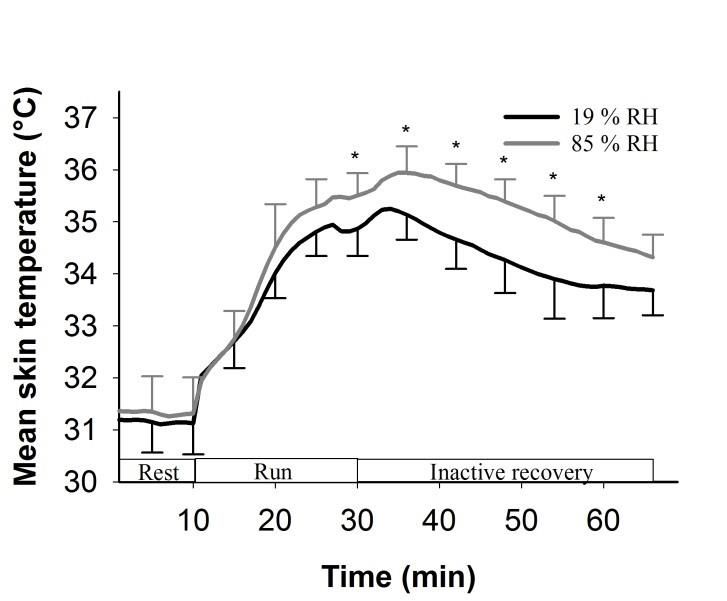
Høye et al. / Sweat responses after running in hot, dry and humid conditions JOURNAL OF HUMAN SPORT & EXERCISE

From an average resting value of 76 ± 6 bpm outside the climatic chamber, HR increased to a maximum of
175 ± 11 bpm and 164 ± 10 bpm while running in 85 % RH and 19 % RH respectively. The HR at the end of
the 20-minute run under 85% RH environment was significantly higher than in the 19% RH environment
(p=0.001). During inactive recovery, HR was also significantly higher under 85% RH compared to the l9%
RH conditions (p=0.038) (Fig 3).

Skin temperature
From an average resting value of 31.2 ± 0.6 °C under both ambient conditions, T s reached 35.4 ± 0.4 °C
during exercise in 85% RH and 34.9 ± 0.6 °C in 19% RH. Ts were significantly higher in 85% RH than in 19%
RH (p
Høye et al. / Sweat responses after running in hot, dry and humid conditions JOURNAL OF HUMAN SPORT & EXERCISE

p=0.011). Perceived exertion (RPE) was rated at 15 in 85% RH and 14 in 19% RH after 20 minutes of running
(p
Høye et al. / Sweat responses after running in hot, dry and humid conditions JOURNAL OF HUMAN SPORT & EXERCISE effect was not considered to be important in the testing of our hypotheses. All of the above studies on post- exercise recovery were performed at 24-25 °C in either unreported or RH of 55% (Journeay et al., 2004) or 30% (Jay et al., 2008). To our knowledge, no studies have been performed on post-exercise sweat rate under conditions of high Ta (30 C) and 85% RH. Candas et al. (1983) described the effect of hot humid environments on sweating in resting men, and showed that sweat rate rose for one hour before starting to decline due to the effect of skin wittedness (hidromeiosis). During profound sweating the skin becomes hydrated and swells, which induces a decline in sweating (Candas et al., 1983, 1979; Gonzalez et al., 1974; Nadel and Stolwijk, 1973). RSR in our study did not seem to be affected by hidromeiosis. This can be attributed to the high absorption capacity of the technical absorbent pads used to measure sweat production. Instead, our results indicate delayed onset of the fall in sweat rate in an 85% RH compared to a 19% RH environment. This corresponds well with the continued increase in Tc measured during the first seven minutes of inactive recovery in 85% RH. Our findings also show weak to strong correlations between RSR and local skin temperature during inactive recovery under both 85% RH and 19% RH conditions, but no correlation between RSR and local skin temperature during running. The classical study by Nadel et al. (1971) emphasises the importance of local skin temperature for sweat rate. A relationship between RSR and local skin temperature during exercise, as had been suggested by Nadel et al (1971), was not evident in the studies of Bothorel et al. (1991), Cotter et al. (1995) and Smith and Havenith (2010). GSL was higher when subjects were exposed to 85% RH than to 19% RH, and showed a positive correlation with metabolic rate. This is explained by the reduced effect of evaporation due to the diminished water vapour gradient between the skin and the ambient environment under conditions of high humidity, and were in accordance with earlier studies (Maughan et al., 2012; Niwa and Nakayama, 1978; Shapiro et al., 1982). They show that GSL increased in a high humidity environment compared to a low humidity environment. The shorter duration of physical work in our study compared to the studies by Shapiro et al. (1982) and Maughan et al. (2012) explains our lower GSL values. Nevertheless, there was a highly significant correlation between GSL and metabolic rate under both environmental conditions, which is in accordance with the results of Smith and Havenith (2010). Our results show a significant difference between the GSL regression lines of 85% RH and 19% RH. This indicates increased sweat loss in relation to work rate in 85% RH compared to 19% RH conditions. This effect can once again be attributed to the reduced efficiency of evaporation on the skin in high humidity conditions. In order to take the differences in heat production between running and upright recovery into account, we adjusted metabolic rate to the total heat production to obtain an estimate of absolute metabolic rate during the test session. We did not measure the weight change between running and inactive recovery in this study. It was therefore impossible to calculate separate GSL values for running and inactive recovery, which might have highlighted the change in sweat rate from running to recovery. We observed a significant increase in HR at the end of the running period and during the first 24 minutes of recovery in 85% RH compared to 19% RH. A high HR in a hot environment is explained by a redistribution of blood to the periphery as a thermoregulatory response. This reduces the central blood volume, which in turn reduces stroke volume and leads to increased HR (Galloway and Maughan, 1997; González-Alonso et al., 2000; Montain et al., 1996; Rowell et al., 1966). In our study, Ta was kept at 30 °C in both 85% RH and 19% RH conditions. Nevertheless, a significantly higher HR was measured under the 85% RH conditions during inactive recovery, which can be explained by the significant elevation in T c during the same period in 85% RH (Bergh and Ekblom, 1979; Kenney, 2008; Rowell, 1974). However, the higher HR during running in VOLUME -- | ISSUE - | 2019 | 11
Høye et al. / Sweat responses after running in hot, dry and humid conditions JOURNAL OF HUMAN SPORT & EXERCISE

85% RH cannot be explained by an elevation in Tc, since no significant differences in Tc during running were
found between the two conditions. This is explained by the rise in Ts due to reduced evaporative efficiency in
high humidity, which is also described in the reviews by Rowell (1974) and González-Alonso et al. (2008).

There was a significant 0.5 °C higher Ts at the end of the running period, and Ts were significantly elevated
during most of the recovery period in 85% RH compared to 19% RH in our study. Increased skin blood flow
in the heat results in an increased volume of warm blood in the periphery (González-Alonso et al., 2008;
Rowell, 1974). This is an important mechanism for keeping skin temperature higher than the surrounding air
and thus maintaining the evaporative and conductive temperature gradient between skin and air (Alber-
Wallerström and Holmér, 1985; Havenith et al., 2013; Webb, 1995). The effect of the increased skin blood
flow to maintain the evaporative temperature gradient is reduced in high humidity conditions, as the gradient
between ambient water vapour pressure and skin hydration decreases (Candas et al., 1979; Wendt et al.,
2012). Our study found no differences in the rate of decrease in T s (0.05 °C per minute) during inactive
recovery after the highest measured Ts in 85% RH and 19% RH conditions. Heat transfer between the skin
and surrounding environment can explain the lack of difference between the rates of decrease in T s. In our
study, the Ta of 30 °C displayed no significant differences in heat loss between 85% RH and 19% RH
conditions. The similar rates of cooling in Ts and Tc, and the similar decline in RSR between inactive recovery
in 85% RH and 19% RH supports this statement.

Tc rose from 37.0 °C during initial rest to 37.7 °C during running in both 85% RH and 19% RH conditions and
did not differ significantly. It is observed that during work, rectal temperatures are independent of
environmental temperatures between 5 and 30 °C (Nielsen and Nielsen, 1962), but is dependent on the
intensity of exercise (Saltin et al., 1968). Maughan et al. (2012) tested exercise capacity in men during cycling
at 70% VO2max at 30 °C under four different humidity conditions and, as in our study, did not find any
significant difference between Tc in low and high humidity after 20 minutes of exercise. In our study T c
continued to increase during the inactive recovery period and reached a peak of 38.1 °C after seven minutes
of inactive recovery in 85% RH, and a peak of 37.8 °C after three minutes in 19% RH. That the peak rectal
temperature is reached several minutes after the stop of the exercise may be explained by the measuring
site. The temperature of this area shows a slow response to changes in the body heat content due to low
blood flow rate. Also, the area has a high degree of thermal inertia due to its relatively large mass (Gunga et
al., 2008; Taylor et al., 2014).

Most of the studies discussed in this article have used RH values around 50%, and there are differences in
measurement sites, exercise intensities and durations, recovery modes and durations, and it is therefore
hard to conclude about the effect of one single parameter. However, it is likely that RH may have an effect
on the prolonged increase in Tc and delayed fall in RSR as observed in our study.

CONCLUSIONS

Regional sweat rate, gross sweat loss, heart rate, skin and core temperatures, was higher during post-
exercise recovery in a high humidity (85% RH) than a low humidity (19% RH) environment at 30 °C. This
identifies the importance of relative humidity at high environmental temperature for thermal sensation and
comfort and physiological responses during inactive recovery after high-intensity activities. This study
emphasises the importance of including the effect of relative humidity in assessment of both exercise and
recovery, to ensure optimal evaporation in the development of high-performance clothing and to reduce heat
stress for improved athletic performances in high temperature and humidity environments.

 12 | 2019 | ISSUE - | VOLUME -- © 2019 University of Alicante
Høye et al. / Sweat responses after running in hot, dry and humid conditions JOURNAL OF HUMAN SPORT & EXERCISE

ACKNOWLEDGEMENTS

The study was funded by the Research Council of Norway (grant no. 227107/H20). We wish to thank our test
subjects for their efforts and patience. The experiments comply with the current laws in Norway where the
experiments are performed.

REFERENCES

 Alber-Wallerström, B., Holmér, I., 1985. Efficiency of sweat evaporation in unacclimatized man working
 in a hot humid environment. Europ. J. Appl. Physiol. 54, 480–487.
 https://doi.org/10.1007/BF00422956
 Amano, T., Ichinose, M., Koga, S., Inoue, Y., Nishiyasu, T., Kondo, N., 2011. Sweating responses and
 the muscle metaboreflex under mildly hyperthermic conditions in sprinters and distance runners.
 Journal of Applied Physiology 111, 524–529. https://doi.org/10.1152/japplphysiol.00212.2011
 Bergh, U., Ekblom, B., 1979. Physical performance and peak aerobic power at different body
 temperatures. Journal of Applied Physiology 46, 885–889.
 https://doi.org/10.1152/jappl.1979.46.5.885
 Borg, G., 1985. An Introduction to Borg’s RPE-scale. Mouvement Publications, Ithaca, N.Y.
 Bothorel, G., Dewasmes, G., Hoeft, A., Candas, V., 1991. Temperature and sweating responses in one-
 legged and two-legged exercise. Eur J Appl Physiol 63, 157–164.
 https://doi.org/10.1007/BF00233841
 Candas, V., Libert, J.P., Vogt, J.J., 1983. Sweating and sweat decline of resting men in hot humid
 environments. Europ. J. Appl. Physiol. 50, 223–234. https://doi.org/10.1007/BF00422161
 Candas, V., Libert, J.P., Vogt, J.J., 1980. Effect of hidromeiosis on sweat drippage during acclimation to
 humid heat. European journal of applied physiology and occupational physiology 44, 123–133.
 https://doi.org/10.1007/bf00421090
 Candas, V., Libert, J.P., Vogt, J.J., 1979. Human skin wettedness and evaporative efficiency of sweating.
 Journal of applied physiology: respiratory, environmental and exercise physiology 46, 522–528.
 https://doi.org/10.1152/jappl.1979.46.3.522
 Carter III, R., Wilson, T.E., Watenpaugh, D.E., Smith, M.L., Crandall, C.G., 2002. Effects of mode of
 exercise recovery on thermoregulatory and cardiovascular responses. J Appl Physiol 93, 1918–1924.
 https://doi.org/10.1152/japplphysiol.00056.2002
 Cheuvront, S.N., Haymes, E.M., Sawka, M.N., 2002. Comparison of sweat loss estimates for women
 during prolonged high-intensity running: Medicine & Science in Sports & Exercise 34, 1344–1350.
 https://doi.org/10.1097/00005768-200208000-00017
 Cotter, J.D., Patterson, M.J., Taylor, N.A., 1995. The topography of eccrine sweating in humans during
 exercise. European journal of applied physiology and occupational physiology 71, 549–554.
 https://doi.org/10.1007/bf00238559
 Durnin, J.V.G.A., Womersley, J., 1974. Body fat assessed from total body density and its estimation from
 skinfold thickness: measurements on 481 men and women aged from 16 to 72 Years. British Journal
 of Nutrition 32, 77–97. https://doi.org/10.1079/BJN19740060
 Galloway, S.D.R., Maughan, R.J., 1997. Effects of ambient temperature on the capacity to perform
 prolonged cycle exercise in man: Medicine & Science in Sports & Exercise 29, 1240–1249.
 https://doi.org/10.1097/00005768-199709000-00018
 Gonzalez, R.R., Pandolf, K.B., Gagge, A.P., 1974. Heat acclimation and decline in sweating during
 humidity transients. Journal of applied physiology 36, 419–425.
 https://doi.org/10.1152/jappl.1974.36.4.419

 VOLUME -- | ISSUE - | 2019 | 13
Høye et al. / Sweat responses after running in hot, dry and humid conditions JOURNAL OF HUMAN SPORT & EXERCISE

 González-Alonso, J., Crandall, C.G., Johnson, J.M., 2008. The cardiovascular challenge of exercising in
 the heat. The Journal of Physiology 586, 45–53. https://doi.org/10.1113/jphysiol.2007.142158
 González-Alonso, J., Mora-Rodríguez, R., Coyle, E.F., 2000. Stroke volume during exercise: interaction
 of environment and hydration. American Journal of Physiology - Heart and Circulatory Physiology
 278, H321–H330. https://doi.org/10.1152/ajpheart.2000.278.2.h321
 Gunga, H.-C., Sandsund, M., Reinertsen, R.E., Sattler, F., Koch, J., 2008. A non-invasive device to
 continuously determine heat strain in humans. Journal of Thermal Biology 33, 297–307.
 https://doi.org/10.1016/j.jtherbio.2008.03.004
 Havenith, G., 2001. Individualized model of human thermoregulation for the simulation of heat stress
 response. Journal of Applied Physiology 90, 1943–1954.
 https://doi.org/10.1152/jappl.2001.90.5.1943
 Havenith, G., Bröde, P., Hartog, E. den, Kuklane, K., Holmer, I., Rossi, R.M., Richards, M., Farnworth,
 B., Wang, X., 2013. Evaporative cooling: effective latent heat of evaporation in relation to evaporation
 distance from the skin. Journal of Applied Physiology 114, 778–785.
 https://doi.org/10.1152/japplphysiol.01271.2012
 Havenith, G., Fogarty, A., Bartlett, R., Smith, C.J., Ventenat, V., 2008a. Male and female upper body
 sweat distribution during running measured with technical absorbents. European Journal of Applied
 Physiology 104, 245–255. https://doi.org/10.1007/s00421-007-0636-z
 Havenith, G., Middendorp, H. van, 1990. The relative influence of physical fitness, acclimatization state,
 anthropometric measures and gender on individual reactions to heat stress. Europ. J. Appl. Physiol.
 61, 419–427. https://doi.org/10.1007/BF00236062
 Havenith, G., Richards, M.G., Wang, X., Bröde, P., Candas, V., Hartog, E. den, Holmér, I., Kuklane, K.,
 Meinander, H., Nocker, W., 2008b. Apparent latent heat of evaporation from clothing: attenuation
 and “heat pipe” effects. Journal of Applied Physiology 104, 142–149.
 https://doi.org/10.1152/japplphysiol.00612.2007
 Henane, R., Flandrois, R., Charbonnier, J.P., 1977. Increase in sweating sensitivity by endurance
 conditioning in man. J Appl Physiol 43, 822. https://doi.org/10.1152/jappl.1977.43.5.822
 Hertzman, A.B., 1957. Individual Differences in Regional Sweating. Journal of Applied Physiology 10,
 242–248. https://doi.org/10.1152/jappl.1957.10.2.242
 Holm, S., 1979. A Simple Sequentially Rejective Multiple Test Procedure. Scandinavian Journal of
 Statistics 6, 65–70. https://doi.org/10.2307/4615733
 Jay, O., Gagnon, D., DuCharme, M.B., Webb, P., Reardon, F.D., Kenny, G.P., 2008. Human heat
 balance during postexercise recovery: separating metabolic and nonthermal effects. American
 Journal of Physiology - Regulatory, Integrative and Comparative Physiology 294, R1586–R1592.
 https://doi.org/10.1152/ajpregu.00717.2007
 Journeay, W.S., Carter, R., Kenny, G.P., 2006. Thermoregulatory control following dynamic exercise.
 Aviation, space, and environmental medicine 77, 1174–1182.
 Journeay, W.S., Reardon, F.D., Martin, C.R., Kenny, G.P., 2004. Control of cutaneous vascular
 conductance and sweating during recovery from dynamic exercise in humans. Journal of Applied
 Physiology 96, 2207–2212. https://doi.org/10.1152/japplphysiol.01201.2003
 Journeay, W.S., Reardon, F.D., McInnis, N.H., Kenny, G.P., 2005. Nonthermoregulatory control of
 cutaneous vascular conductance and sweating during recovery from dynamic exercise in women.
 Journal of Applied Physiology 99, 1816–1821. https://doi.org/10.1152/japplphysiol.00497.2005
 Kenney, W.L., 2008. Human cardiovascular responses to passive heat stress. J Physiol 586, 3.
 https://doi.org/10.1113/jphysiol.2007.147215
 Kenny, G.P., Journeay, W.S., 2010. Human thermoregulation: separating thermal and nonthermal effects
 on heat loss. Frontiers in bioscience (Landmark edition) 15, 259–290. https://doi.org/10.2741/3620

 14 | 2019 | ISSUE - | VOLUME -- © 2019 University of Alicante
Høye et al. / Sweat responses after running in hot, dry and humid conditions JOURNAL OF HUMAN SPORT & EXERCISE

 Kondo, N., Takano, S., Aoki, K., Shibasaki, M., Tominaga, H., Inoue, Y., 1998. Regional differences in
 the effect of exercise intensity on thermoregulatory sweating and cutaneous vasodilation. Acta
 Physiologica Scandinavica 164, 71–78. https://doi.org/10.1046/j.1365-201x.1998.00407.x
 Kuno, Y., 1956. Outline of Human Sweating, in: Human Perspiration, American Lecture Series. Thomas,
 Springfield, p. 98.
 Machado-Moreira, C.A., Smith, F.M., van den Heuvel, A.M., Mekjavic, I.B., Taylor, N.A., 2008. Sweat
 secretion from the torso during passively-induced and exercise-related hyperthermia. European
 journal of applied physiology 104, 265–270. https://doi.org/10.1007/s00421-007-0646-x
 Maughan, R.J., Otani, H., Watson, P., 2012. Influence of relative humidity on prolonged exercise capacity
 in a warm environment. European Journal of Applied Physiology 112, 2313–2321.
 https://doi.org/10.1007/s00421-011-2206-7
 McIntyre, D.A., 1980. Indoor Climate. Applied Science, London.
 Mitchell, J.W., Nadel, E.R., Stolwijk, J.A., 1972. Respiratory weight losses during exercise. Journal of
 Applied Physiology 32, 474–476. https://doi.org/10.1152/jappl.1972.32.4.474
 Montain, S.J., Sawka, M.N., Latzka, W., Valeri, C.R., 1996. Thermal and Cardiovascular Strain from
 Hypohydration: Influence of Exercise Intensity. https://doi.org/10.21236/ada360140
 Morris, N.B., Cramer, M.N., Hodder, S.G., Havenith, G., Jay, O., 2013. A comparison between the
 technical absorbent and ventilated capsule methods for measuring local sweat rate. Journal of
 Applied Physiology 114, 816–823. https://doi.org/10.1152/japplphysiol.01088.2012
 Mukaka, M., 2012. A guide to appropriate use of Correlation coefficient in medical research. Malawi
 Medical Journal : The Journal of Medical Association of Malawi 24, 69–71.
 Nadel, E.R., Bullard, R.W., Stolwijk, J.A.J., 1971. Importance of skin temperature in the regulation of
 sweating. J Appl Physiol 31, 80–87. https://doi.org/10.1152/jappl.1971.31.1.80
 Nadel, E.R., Stolwijk, J.A., 1973. Effect of skin wettedness on sweat gland response. Journal of Applied
 Physiology 35, 689–694. https://doi.org/10.1152/jappl.1973.35.5.689
 Nielsen, B., Nielsen, M., 1962. Body temperature during work at different environmental temperatures.
 Acta Physiologica 56, 120–129. https://doi.org/10.1111/j.1748-1716.1962.tb02489.x
 Nielsen, R., Gavhed, D.C., Nilsson, H., 1989. Thermal function of a clothing ensemble during work:
 dependency on inner clothing layer fit. Ergonomics 32, 1581–1594.
 https://doi.org/10.1080/00140138908966927
 Niwa, K.-I., Nakayama, T., 1978. Thermoregulation During Exercise in High Humidity Environments.
 Japanese Journal of Physical Fitness and Sports Medicine 27, 11–18.
 https://doi.org/10.7600/jspfsm1949.27.11
 Parsons, K.C., 2014. Human thermal environments: the effects of hot, moderate, and cold environments
 on human health, comfort, and performance, ISO. ed. CRC Press, Taylor & Francis Group, Boca
 Raton. https://doi.org/10.1201/b16750
 Rowell, L.B., 1974. Human cardiovascular adjustments to exercise and thermal stress. Physiological
 Reviews 54, 75–159. https://doi.org/10.1152/physrev.1974.54.1.75
 Rowell, L.B., Marx, H.J., Bruce, R.A., Conn, R.D., Kusumi, F., 1966. Reductions in cardiac output, central
 blood volume, and stroke volume with thermal stress in normal men during exercise. J Clin Invest
 45, 1801–1816. https://doi.org/10.1172/jci105484
 Saltin, B., Gagge, A. t, Stolwijk, J.A., 1968. Muscle temperature during submaximal exercise in man.
 Journal of applied physiology 25, 679–688. https://doi.org/10.1152/jappl.1968.25.6.679
 Shapiro, Y., Pandolf, K.B., Goldman, R.F., 1982. Predicting sweat loss response to exercise,
 environment and clothing. European journal of applied physiology and occupational physiology 48,
 83–96. https://doi.org/10.1007/bf00421168

 VOLUME -- | ISSUE - | 2019 | 15
Høye et al. / Sweat responses after running in hot, dry and humid conditions JOURNAL OF HUMAN SPORT & EXERCISE

 Shibasaki, M., Wilson, T.E., Crandall, C.G., 2006. Neural control and mechanisms of eccrine sweating
 during heat stress and exercise. Journal of Applied Physiology 100, 1692–1701.
 https://doi.org/10.1152/japplphysiol.01124.2005
 Smith, C.J., Havenith, G., 2010. Body mapping of sweating patterns in male athletes in mild exercise-
 induced hyperthermia. European Journal of Applied Physiology 111, 1391–1404.
 https://doi.org/10.1007/s00421-010-1744-8
 Smith, C.J., Ventenat, V., Havenith, G., 2007. Regional sweat rates of the arms and hands in male
 squash players. Environmental Ergonomics XII 285.
 Sparks, S.A., Cable, N.T., Doran, D.A., Maclaren, D.P.M., 2005. The influence of environmental
 temperature on duathlon performance. Ergonomics 48, 1558–1567.
 https://doi.org/10.1080/00140130500101254
 Taylor, N.A.S., Tipton, M.J., Kenny, G.P., 2014. Considerations for the measurement of core, skin and
 mean body temperatures. Journal of Thermal Biology 46, 72–101.
 https://doi.org/10.1016/j.jtherbio.2014.10.006
 Teichner, W.H., 1958. Assessment of Mean Body Surface Temperature. Journal of Applied Physiology
 12, 169–176. https://doi.org/10.1152/jappl.1958.12.2.169
 Webb, P., 1995. The physiology of heat regulation. American Journal of Physiology - Regulatory,
 Integrative and Comparative Physiology 268, R838–R850.
 https://doi.org/10.1152/ajpregu.1995.268.4.r838
 Wendt, D., Loon, L.J.C. van, Lichtenbelt, D.W.D.M., 2012. Thermoregulation during Exercise in the Heat.
 Sports Med 37, 669–682. https://doi.org/10.2165/00007256-200737080-00002
 Werner, J., 1988. Functional mechanisms of temperature regulation, adaptation and fever:
 Complementary system theoretical and experimental evidence. Pharmacology & Therapeutics 37,
 1–23. https://doi.org/10.1016/0163-7258(88)90016-2
 Wilson, T.E., 2004. Active recovery attenuates the fall in sweat rate but not cutaneous vascular
 conductance after supine exercise. Journal of Applied Physiology 96, 668–673.
 https://doi.org/10.1152/japplphysiol.00522.2003
 Wyndham, C.H., Strydom, N.B., Morrison, J.F., Williams, C.G., Bredell, G.A.G., Maritz, J.S., Munro, A.,
 1965. Criteria for physiological limits for work in heat. J Appl Physiol 20, 37–45.
 https://doi.org/10.1152/jappl.1965.20.1.37

 This work is licensed under a Attribution-NonCommercial-NoDerivatives 4.0 International (CC BY-NC-ND 4.0).
 16 | 2019 | ISSUE - | VOLUME -- © 2019 University of Alicante
You can also read