High Efficiency of Natural Safiot Clay to Remove Industrial Dyes from Aqueous Media: Kinetic, Isotherm Adsorption and Thermodynamic Studies ...
←
→
Page content transcription
If your browser does not render page correctly, please read the page content below
Article
 Volume 11, Issue 5, 2021, 12717 - 12731
 https://doi.org/10.33263/BRIAC115.1271712731

High Efficiency of Natural Safiot Clay to Remove
Industrial Dyes from Aqueous Media: Kinetic, Isotherm
Adsorption and Thermodynamic Studies
Aziz El Kassimi 1, * , Youness Achour 1, Mamoune El Himri 1, My Rachid Laamari 1, Mohammadine El
Haddad 1, *
1 Laboratory of Analytical and Molecular Chemistry, Poly-disciplinary Faculty of Safi, Cadi Ayyad University, BP 4162,
 46000 Safi, Morocco
* Correspondence: azizelkassimi2012@gmail.com (A.E.K.); elhaddad71@gmail.com (M.E.H.);
 Scopus Author ID 57191952633
 Received: 18.12.2020; Revised: 16.01.2021; Accepted: 21.01.2021; Published: 31.01.2021

Abstract: This study's objective was to demonstrate the potential of Natural Safiot Clay (NSC) for
removing cationic dyes MB and Safranin from synthetic wastewater. The operation parameters
investigated included initial concentrations, adsorbent dose, initial pH, and temperature. Experimental
tests were conducted in a batch process. The experimental isotherms data were analyzed using
Langmuir, Freundlich, and Dubinin–Radushkevich isotherm models. The Langmuir model obtained the
best fit with a maximum monolayer adsorption capacity of 68.49 mg/g for MB and 45.45 mg/g for
safranin. Pseudo-first-order, pseudo-second-order kinetic equations, and intraparticle diffusion models
were used to examine the experimental data at different initial concentrations. It was found that the
pseudo-second-order kinetic model described the data of dyes adsorption on NSC adsorbent very well.
Thermodynamic adsorption processes were found to be spontaneous, exothermic, and physical
reactions. The natural safiot clay was characterized using the following technique: DRX, XRF, SEM,
EDX, and FT-IR.

Keywords: adsorption; dyes; natural safiot clay; isotherms; kinetics; thermodynamic; characterization.
© 2021 by the authors. This article is an open-access article distributed under the terms and conditions of the Creative
Commons Attribution (CC BY) license (https://creativecommons.org/licenses/by/4.0/).

1. Introduction

 The growth of humanity and the development of science and technology are causing an
environmental disorder due to the pollution of water by a number of pollutants, including
synthetic dyes, which have a complex molecular structure that makes them more stable and
difficult. These dyes are discharged with the liquid effluents, which are most of the time
directly discharged into watercourses without prior treatment [1].
 These colored wastes pose a great threat to human health and the environment because
many of the dyes are toxic. Traditional processes such as biological processes give
unsatisfactory results due to the composition of these releases of toxic and dyestuffs, which are
difficult to biodegrade; on the other hand, physicochemical processes, which include
coagulation-flocculation, oxidation, and membrane filtration, have been widely studied and
have revealed a high efficiency in water discoloration [2,3]. These techniques have proven to
be very effective. However, their high cost has prompted many researchers to try other cheaper
and abundant materials. The elimination of dyes in aqueous solutions by adsorption on different
solid materials, particularly on activated carbon, has been the subject of much work [4-7].

https://biointerfaceresearch.com/ 12717
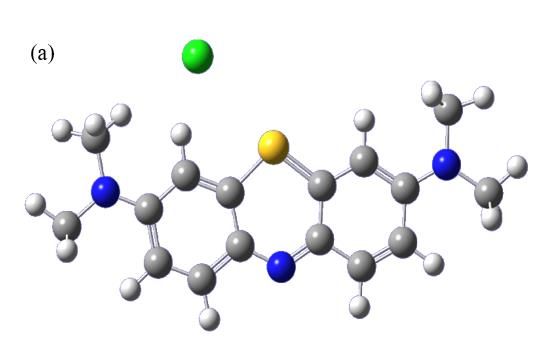
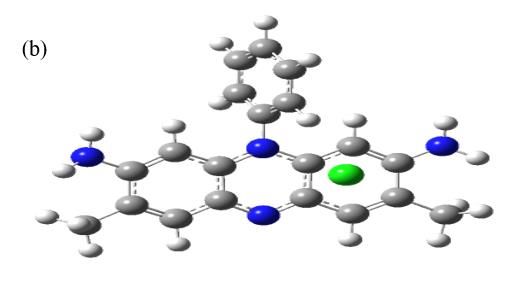
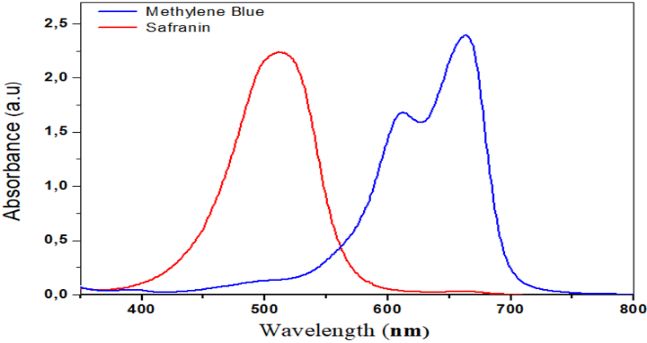
https://doi.org/10.33263/BRIAC115.1271712731 The adsorption of dyes on activated carbon has been found to be very effective, but its use remains limited due to the difficulties of its regeneration and its high cost [8]. For this reason, new materials have been the subject of much research in recent years. From this perspective, using clay as an adsorbent is of great interest because of its effectiveness, accessible cost, and abundance. A lot of research has been done on clays, and all have shown their depollution efficiency towards dyes [9,10]. The importance given to these materials is granted to their abundant availability in nature and their great capacity to retain various pollutants, which is offered by their structure in sheets, which gives a large specific surface towards the adsorption [11, 12]. Our choice focused on clay, an adsorbent material found in abundance in Morocco, effective and more economical. The use of clays for the depollution of waters contaminated by dyes requires a good knowledge of their mineralogical characteristics and the mechanism of eliminating these pollutants. The purpose of this study was to demonstrate the ability of Natural Safiot Clay in the removal of industrial dyes. An extensive study of dyes removal includes: • Optimization of the conditions for maximum adsorption by studying the effect of different parameters such as initial concentration, adsorbent dose, initial pH and temperature on the removal of dye from aqueous solutions. • The determination of the adsorption capacity of natural safiot clay was studied using the adsorption isotherms. Kinetic and Thermodynamic studies were also carried out. 2. Materials and Methods For this study, we have chosen methylene blue (MB) and safranin (SAF) as representative cationic dyes that were purchased from Sigma Aldrich and were of analytical grade. The chemical structures of the studied dyes are given in Figure 1. Stock solutions of dyes were prepared by dissolving them in distilled water. Dyes concentrations for experiments adsorption were prepared by successive dilution of the pre-made stock solutions. max (wavelength at which maximum absorption occurs) of MB and SAF dyes are 663 nm and 520 nm (Figure 2). Figure 1. Chemical structures of methylene blue (a) and safranin (b). Figure 2. Experimental UV/vis absorption spectra for methylene blue and safranin. https://biointerfaceresearch.com/ 12718
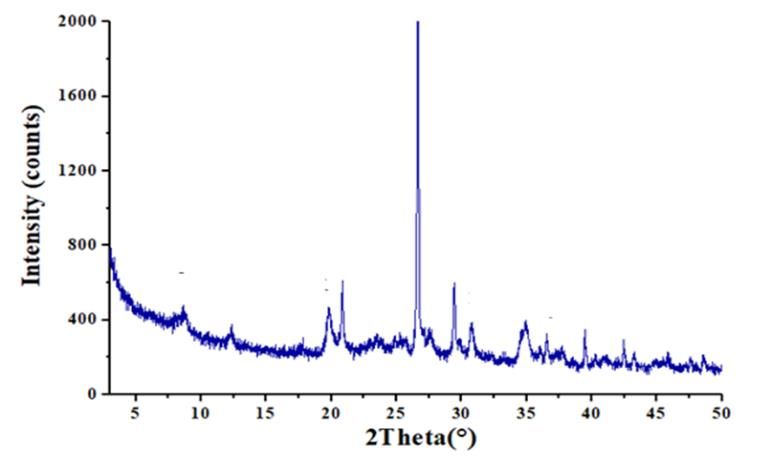
https://doi.org/10.33263/BRIAC115.1271712731

 The natural safiot clay abbreviated as (NSC) used in this study were of Moroccan
sources. The NSC adsorbent was rinsed with distilled water to ensure the removal of dust and
any soluble impurities that may exist. Then it was kept at room temperature and exposed to air
for natural drying. The sample was then placed in the oven at 105°C overnight to remove
moisture and any volatile impurities that may exist. The dried clay was washed several times
repeatedly with distilled water until the water becomes almost colorless. The treatment clay
dried again in an oven at 105°C overnight and stored later in desiccators to prevent moisture
and is ready for experimental use.
 Chemical composition, surface morphology, and the nature of functional groups
responsible for adsorption for dye onto the NSC adsorbent were studied by X-Ray Diffraction
(XRD), X-ray fluorescence (XRF), Energy Dispersive X-ray spectroscopy (EDX), Scanning
Electron Microscopy (SEM) and Fourier Transform Infrared (FT-IR).
 Batch adsorption experiments were conducted to investigate the influence of
physicochemical parameters such as adsorbent dose (5-35 mg), initial dye concentration (20-
40 mg/L), pH (2-12), and temperature (25°C-35°C) on dye adsorption. The working solutions'
pH was adjusted to the desired values with dilute HCl (0.1 M) or NaOH (0.1 M) using a pH-
Meter HANNA 5222. After stirring a prescribed contact time, the solution was filtrated using
a filter syringe. The concentration was measured using UV/Visible spectrophotometer (Janway
6300). For the qualification of the removal dye onto NSC adsorbent, two manners may give:
• The % removal of dye expressed as follows:
 0 −
 % = ∗ 100 (1)
 0
• Adsorption capacity at equilibrium, qe (mg/g) calculated using the equation:
 0 −
 ( ⁄ ) = ∗ (2)

 These relationships depend on the type of adsorption that occurs. Where C0 and Ce are
the initial and equilibrium dye concentrations in aqueous solution (mg/L), respectively, V is
the volume of aqueous solution (L), and W is a dry weight adsorbent (g).

3. Results and Discussion

 3.1. Characterization of natural Safiot clay adsorbent.

 3.1.1. XRD analysis.

 X-ray diffraction analysis allows us to identify the different mineralogical phases
contained in our material.

 Figure 3. X-ray diffraction of natural safiot clay.

https://biointerfaceresearch.com/ 12719
https://doi.org/10.33263/BRIAC115.1271712731

 The X-ray diffraction patterns of NSC adsorbent are illustrated in Figure 3. This result
demonstrated the principal presence of kaolinite characterized by an intense peak at 2θ = 26.63°
and a series of peaks with varying intensities at 12.33°, 19.75°, 40.85° and those of quartz at
20.87°.37.92° and 42. 440. Also, the reflections spectrum at 2θ = 8.62°, 29.47°, and 30.81°
confirm the presence of illite, calcite, and dolomite, respectively. We see that the diagram also
shows the presence of the peak corresponds to the following minerals: Kaolinite, calcite, and
vermiculite, which implies that our clay is heterogeneous.

 3.1.2. XRF analysis.

 Analysis of the chemical composition by X-ray fluorescence allowed us to determine
clay constituents in oxides whose contents are evaluated in mass percentages. Table 1 shows
the results of the analysis of the chemical composition of natural safiot clay. Based on these
results, it can be seen that silica and alumina are predominant constituents with a very large
percentage. This indicates that the material is part of kaolinite from a group of clay minerals.
Moreover, relatively high calcium indicates that our material is rich in calcite (CaCO3). The
other oxides (Fe2O3, MgO, K2O, and Na2O) reaches a percentage varying from 7.63 to 13.9,
which shows that our clay is not pure [13]. In addition, the high content of these oxides
compared to the contents of other oxides probably shows that the clay contains exchangeable
cations such as Mg2+, K+, or Na+.

 Table 1. X-ray fluorescence analysis of oxide content (%) for the clay sample.
Component SiO2 Al2O3 Fe2O3 CaO K2O MgO TiO2 Na2O SO3 P2O5 MnO LOIa
Weight (%) 47.44 31.24 6.18 4.99 4.63 2.54 1.02 0.52 0.18 0.15 0.03 13.67

a
 Loss on ignition: volatile components, water, organic matter, CO2, etc.

 3.1.3. SEM-EDX analysis.

 Analysis by scanning electron microscopy was carried out to observe the morphology,
structure, and distribution of the grains of our adsorbent material studied. The scanning electron
microscope image (Figure 4) shows aggregates of kaolin grains in a spherical form and
heterogeneous size, the interstices between the grains form pores. We also observe large
irregularly shaped cavities; this confirms our clay's heterogeneous composition revealed by the
XRD (kaolinite + calcite + vermiculite).

 Figure 4. SEM micrograph of the Natural Safi Clay.

https://biointerfaceresearch.com/ 12720
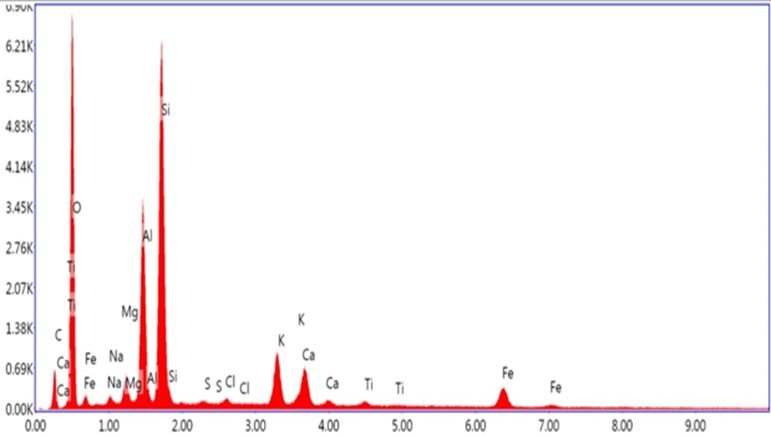
https://doi.org/10.33263/BRIAC115.1271712731

 In order to achieve an accurate characterization of NSC adsorbent, we have used the
EDX spectrum. Table 2 depicts the atomic composition of NSC adsorbent. So, the request
adsorbent showed a high percentage of silica, alumina, and oxygen, which are characteristic of
alumino-silicates. Other elements are present in trace amounts (Fe, Ti, Mg, Na, K, and Ca).
Figure 5 depicts the EDX spectrum of NSC adsorbent. In this fact, the intense peaks for Si and
Al elements could be ascribed to clay minerals and possibly free SiO2 (vide infra) and Al2O3,
whereas Ti probably results from anatase or rutile impurities. Furthermore, elements such as
C, Ca, and Mg are likely to be due to carbonates such as dolomite (CaMg (CO3)2) and/or calcite
(CaCO3), as evidenced by XRD.

 Table 2. Atomic and mass percentage of the natural Safiot clay constituents.
Elements O C Na Mg Al Si K Ca Ti Fe
% Atomic 57.87 12.96 0.59 1.25 7.50 13.78 2.18 1.70 0.19 1.72
% Mass 46.70 7.85 0.68 1.53 10.20 19.52 4.30 3.43 0.47 4.85

 Figure 5. EDX Spectrum of natural Safiot clay.

 3.1.4. FTIR analysis.

 Fourier transform infrared (FTIR) analysis was applied to determine the functional
groups present on the surface of natural Safiot clay and understand its adsorption mechanism.
The infrared spectra were recorded from 400 to 4000 cm-1 is shown in Figure 6. The absorption
bands that appear in the region from 3700 cm-1 to 3600 cm-1 correspond to the stretching
vibrations of the structural hydroxyl groups characteristic of kaolinite. The band stretching
between 1700 cm-1 and 1600 cm-1 can be attributed to the OH group's valence vibrations of the
water adsorbed between the sheets [14]. At the same time, the characteristic bands of
carbonates were detected at 1430 cm-1 and 2922 cm-1 [15]. An intense band located between
1200 cm-1 and 900 cm-1 and centered around 1030 cm-1 corresponds to the Si-O bond's valence
vibrations (Quartz) [16]. The presence of a band between 908 cm-1 and 915 cm-1 may be due
to the bending vibrations of the Al-Al-OH and Al-Mg-OH groups [14]. The bands between 787
cm-1 and 748 cm-1 are attributable to the vibrations of elongation of the Si-O-Al bonds
(Kaolinite) and the hydroxyls perpendicular to the surface (translational OH) [13]. The bands,
which lie between 540 cm-1 and 516 cm-1, are attributed to the deformation of Si-O-AlVI (VI
corresponds to the octahedral position). However, the absorption bands at 423, 480, 534, and
694 cm-1 correspond to quartz [17].

https://biointerfaceresearch.com/ 12721
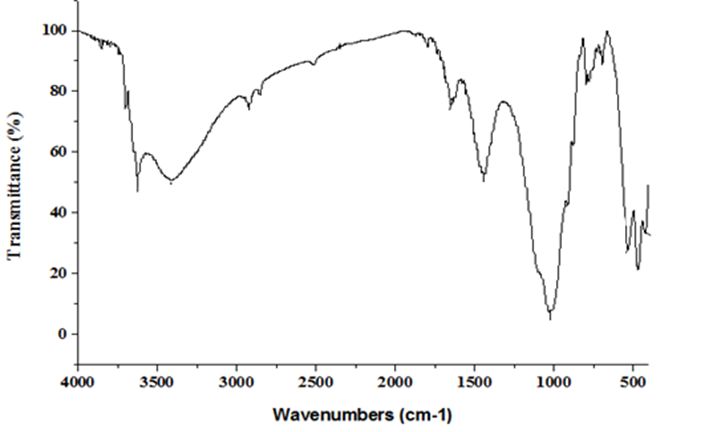
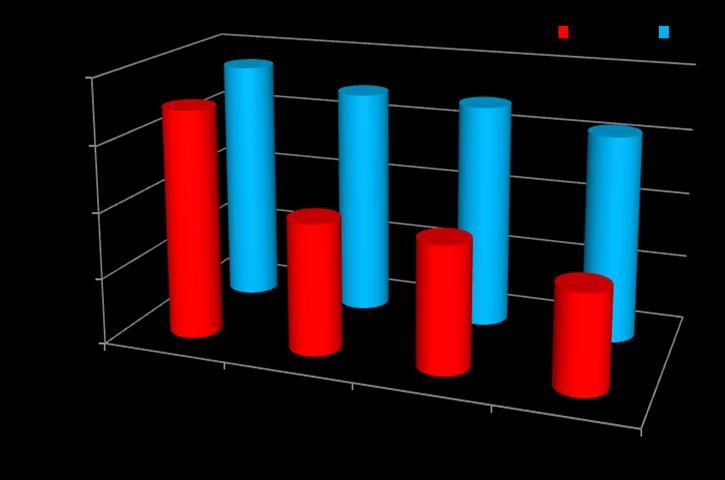
https://doi.org/10.33263/BRIAC115.1271712731

 Figure 6. FT-IR spectrum of Natural Safiot Clay.

 3.2. Effect of adsorbent dose onto the % removal dye.

 It’s recognized that adsorbent dose is an important parameter influencing the sorption
processes since it determines the adsorption capacity of an adsorbent for a given initial
concentration of the adsorbate under the operating conditions. In our case, the effect of NSC
adsorbent dose in the range of 5 – 35 mg on the adsorption removal of the MB and SAF dyes.
The behavior of the two systems MB-NSC and SAF-NSC is illustrated in Figure 7. Whatever
the studied system MB-NSC or SAF-NSC and from the data given in Figure 7, MB or SAF
Dye removal efficiency increased with increasing NSC adsorbent dose. The percentage
removal increased from 49.16 % to 97.03 % for the MB-NSC system and varied from 13.14 %
to 94.35 % for SAF-NSC system. Figure 6 also depicts the variation of adsorption capacity
versus NSC adsorbent dose.
 The MB dye uptake decreased from 98.34 to 27.72 mg/g and for SAF, dye decreased
from 73.09 to 26.96 mg/g due to an increase in the adsorbent dose. This result can be attributed
to the increase in the adsorbent surface area and the availability of more adsorption sites. Other
researchers have reported similar results for the sorption of dyes by different biological
materials [18,19].

 Figure 7. Effect of adsorbent amount on the % adsorption of methylene blue (MB) and safranin (SAF).

https://biointerfaceresearch.com/ 12722
https://doi.org/10.33263/BRIAC115.1271712731

 3.3. Effect of initial dye concentration on the % removal.

 The effect of initial concentrations of MB and SAF dyes was examined at five
concentration levels (20, 25, 30, 35, and 40 mg/L) on the adsorption capacity and removal
efficiency onto natural safiot clay was determined at 30 mg of adsorbent dose and ambient
temperature. The results regarding the effects of the initial concentration of dyes on NSC
adsorbent's adsorption capacity are given in Figure 8. The dye uptake capacity increased from
32.06 to 58.45 mg/g for MB and 30.88 to 43.28 mg/g for SAF. In this case, the % removal
decreased from 96.21% to 87.67 % and 92.66 % to 64.92 % for MB and SAF, respectively.
These results indicated that NSC adsorbent adsorption sites for dyes adsorption were still
unsaturated within the dye concentration range. In addition, increasing initial dye
concentrations increase the number of collisions between dye ions and NSC adsorbent's surface
area, which enhances the adsorption process.

 Figure 8. Effect of initial dye concentration on percentage removal and adsorption capacity.

 3.4. Effect of solution pH.

 The initial pH of the aqueous solution is an important parameter controlling the
adsorption process, where it affects both the degree of ionization of the dye and the adsorbent's
surface properties. The solution pH effect was studied at the pH ranges of 2–12, and the results
are shown in Figure 9. The curves show that the percentage removal is most important for
especially basic pH values below pH 12. An increase in the pH from 2 to 12 increases the
percentage of dye removal from the aqueous solution from 92 % to 96 % and 83 % to 91 % for
https://biointerfaceresearch.com/ 12723
https://doi.org/10.33263/BRIAC115.1271712731

MB and SAF. The pH Zero Point Charge (pHZPC) of NSC adsorbent was found to be 7.2 (Figure
10) and was determined using the pH drift method [20]. These results were explained by the
fact that the negative charge dominates the adsorbent's surface in the basic medium. Thus, an
electrostatic attraction exists between the negative charges of OH- deposited on the clay surface
and the positive charges of the dyes.

 Consequently, the mechanism proposed can be described in Eqs. 3 and 4.
 Si-OH + OH - ↔ Si-O - + H2O (3)
 Si-O- + MB+ or SAF + ↔ Si-O- +MB or Si-O- +SAF (4)

 Figure 9. Effect of pH on the % adsorption of methylene blue and safranin.

 Figure 10.The pHzpc values for natural safiot clay.

 3.5. Effect of temperature.

 It is well known that temperature plays an important role in the adsorption process [21].
The influence of temperature on MB and Safranin's adsorption through NSC was determined
in the range of 25°C-55°C. It is clear from Figure 11. that with an increase in temperature of
the solution from 25°C to 55 °C, the removal efficiency decreases from 93.68% to 90.63 % for

https://biointerfaceresearch.com/ 12724
https://doi.org/10.33263/BRIAC115.1271712731

MB and from 92.38% to 82.46 % for safranin. This result indicates that the process of
adsorption is exothermic.

 Figure 11. Plot Effect of temperature on the adsorption of MB and safranin.

 3.6. Adsorption isotherms.

 Adsorption isotherms play an important role in determining the maximum adsorption
capacity and identifying the type of adsorption. The adsorption experiments' results were
analyzed per the well-known models of Langmuir, Freundlich, and Dubinin-Radushkevich.

 3.6.1. Langmuir isotherm.

 The Langmuir isotherm is valid for monolayer adsorption on a homogenous surface, no
interaction between adsorbate, and equivalent adsorption energies [22]. The linear isotherm
equation is represented as:
 1 1
 = + (5)

Where qe is the amount of adsorbate uptake at equilibrium (mg.g-1), KL is the Langmuir
constant, qm is the maximum quantity of adsorbate required to form a single monolayer on unit
mass of adsorbent (mg/g), and Ce is the equilibrium concentration of adsorbate in solution
(mg/L). Further analysis of the Langmuir equation can be made using a dimensionless
equilibrium parameter, the separation factor RL as given by the following equation [23]:
 1
 = (6)
 1+ 0
Where C0 is the initial dye concentration. The value of separation factor RL, indicates the nature
of the adsorption process as given below: Irreversible (RL = 0), favorable (0 < RL 1).

 3.6.2. Freundlich isotherm.

 The Freundlich isotherm model is applicable for multilayer adsorption on a
heterogeneous adsorbent surface with sites of different energies of adsorption [24]. The
Freundlich isotherm model can be expressed as:
 1
 log( ) = log( ) + log( ) (7)

https://biointerfaceresearch.com/ 12725
https://doi.org/10.33263/BRIAC115.1271712731

Where Kf (mg/g) is the measurement of adsorption capacity and 1/n is the adsorption intensity
of the adsorbent.

 3.6.3. Dubinin-Radushkevich (D-R) isotherm.

 The Dubinin-Radushkevich (D-R) model is a more generalized model as compared to
the Langmuir isotherm. The model is based on the fact that there is no homogeneous surface
or constant adsorption potential. The following equation indicates the D-R isotherm [25]:
 ln( ) = ln( ) − 2 (8)
 1
 ε = RT Ln(1 + ) (9)
 ce
Where qm is the theoretical saturation capacity (mg/g), B is a constant related to the sorption
energy (mol2 kJ−2), ε is the Polanyi potential, R is the universal gas constant (8.314 J/mol.K),
and T is the absolute temperature (K). The mean free energy of adsorption E calculated from
B using the following relation.
 1
 E= (10)
 √2B
 The Langmuir constants are given in Table 3. The calculated dimensionless separation
factors, RL are 0.038 and 0.033 for MB and SAF, respectively. This indicates favorable
adsorption of MB and SAF dyes onto NSC adsorbent. Kf and 1/n values can be calculated from
the intercept and slope of the linear plot of log (qe) versus log (Ce) are shown in Table 3. The
values of 1/n were found to lie between zero and one, indicating that MB and SAF dyes
favorably adsorbed on NSC adsorbent.
 The calculated D–R parameters for the adsorption of MB and SAF are given in Table
3. The magnitude of E (kJ/mol) is used for estimating the type of adsorption mechanism.
Suppose this value is between 8 and 16 kJ/mol. In that case, the adsorption process is controlled
by a chemical mechanism. In contrast, for E < 8 kJ/mol, the adsorption process proceeds
through a physical mechanism. The calculated values of E (Table 3) suggested that dye's
adsorption occurs via physical adsorption for two dyes.
 A comparison of the isotherm constants along with regression coefficients (R2) is
presented in Table 3. Comparing the Langmuir, Freundlich, and Dubinin-Radushkevich
isotherms's regression coefficient values, it was demonstrated that the Langmuir isotherm was
the most appropriate isotherm to describe the equilibrium data for dyes adsorption at the
different studied concentrations. The maximum monolayer adsorption capacities were 68.49
and 45.45mg/g for MB and safranin, respectively.

 Table 3. Isotherm constants for methylene blue and safranin.
 Langmuir Freundlich Dubinin–Radushkevich
Dyes
 qmax RL R2 KF 1/n R2 qmax KD-R E R2
MB 68.49 0.038 0.992 37.89 0.314 0.852 59.03 1 10-7 2236 0.925
Safranin 45.45 0.033 0.998 7.39 0.122 0.866 41.06 2 10-7 1581 0.912

 3.7. Adsorption kinetics.

 The kinetics of adsorption is an important characteristic in evaluating the efficiency of
the adsorption process. Three kinetics models (pseudo-first order, pseudo-second-order, and
intraparticle diffusion) were utilized to test the experimental data and predict the dye adsorption
process's controlling mechanism.

https://biointerfaceresearch.com/ 12726
https://doi.org/10.33263/BRIAC115.1271712731

 3.7.1. Pseudo-first-order model.

 The linear form of the pseudo-first order is expressed as follows [26]:
 1
 log( − ) = log( ) − (11)
 2.303
Where qe and qt (mg/g) are the amount of adsorbate adsorbed at equilibrium and any time t
(min), respectively, and k1 (min-1) is the adsorption rate constant. The rate constant k1 and
equilibrium adsorption capacities qe were obtained from the slope and intercept of the linear
plots of log (qe - qt) against t, respectively.

 3.7.2. Pseudo-second-order model.

 The pseudo-second-order model is given in equation [27]:
 1 1
 = + (12)
 2 2
Where k2 is the rate constant of the pseudo-second-order model (g/mg.min), The rate constant
k2 and qe can be calculated from the slope and intercept of the linear plots of t/qt against t,
respectively.

 3.7.3. Intra particle diffusion model.

 The intra-particle diffusion equation [28] can be written as:
 qt = k id t 0.5 + c (13)
 1/2
Where Kid is the intra-particle diffusion rate constant (mg/g.min ), and C is a constant that
gives an idea about the thickness of the boundary layer (mg/g). A plot of qt vs. t1/2 should be a
straight line whose slope gives the value of the diffusion constant.
 The lower values of R2 and the difference between the experimental and calculated
equilibrium adsorption show that the pseudo-first-order and intraparticle diffusion model failed
to describe the adsorption kinetics. The higher values of R2 > 0.99 and the good agreement
between the experimental and calculated equilibrium adsorption for the pseudo-second-order
model confirm that this one correctly describes the adsorption kinetics (see Table 4). The values
of the rate constants (k2) were found to decrease from 0.156 to 0.022 mg/g.min and from 0.2 to
0.03 mg/g.min as the initial concentration increased from 20 to 40 mg/L, for MB and SAF,
respectively, this amounts to increasing competition on the adsorbent active sites.

 Table 4. Parameters of the kinetic models for methylene blue and safranin adsorption by NSC.
Dyes Concentration Pseudo-first order Pseudo-second order Intra particule diffusion
 (mg/l) qe(exp) qe(cal) K1 R2 qe(cal) K2 R2 Ki C R2
 20 32.07 0.857 0.037 0.668 31.34 0.156 1.000 0.114 30.24 0.976
 25 39.92 1.525 0.023 0.932 39.52 0.131 1.000 0.176 38.18 0.940
 Methylene
 30 47.72 1.795 0.074 0.403 47.85 0.109 1.000 0.306 45.66 0.794
 Blue
 35 54.05 4.863 0.052 0.977 54.35 0.034 0.999 0.655 49.22 0.956
 40 58.45 8.707 0.061 0.783 58.82 0.022 0.999 0.927 51.51 0.971
 20 30.89 0.872 0.077 0.552 30.95 0.200 1.000 0.255 29.21 0.526
 25 37.17 2.779 0.034 0.393 37.87 0.035 0.999 0.802 31.45 0.865
 Safranin 30 38.75 6.039 0.071 0.833 39.21 0.031 0.999 0.912 32.54 0.833
 35 39.72 7.445 0.067 0.691 40.32 0.024 0.999 0.903 33.27 0.955
 40 43.28 3.733 0.041 0.768 43.86 0.030 0.999 0.707 38.34 0.956

 3.8. Thermodynamic study.

 The thermodynamic parameters involved are: the Gibbs free energy (ΔG0), enthalpy
(ΔH0), and entropy (ΔS0) were calculated using the following equation:

 https://biointerfaceresearch.com/ 12727
https://doi.org/10.33263/BRIAC115.1271712731

 ∆G0 = ∆H0 − T ∆S0 (14)
 ∆S0 ∆S0
 ln(K C ) = − (15)
 R RT
Where KC (L/mg), R (J/mol.K), and T (K) are the equilibrium constant of the adsorption
process, gas constant, and absolute temperature, respectively.
 The values ΔG0 were calculated using Gibbs Equation. The values ΔH0 and ΔS0 can be
obtained respectively from the slope and intercept of Van’t Hoff plot of Ln Kc versus 1/T.
Table 5 summarized the thermodynamic parameters for the adsorption of MB and SAF dyes
onto NSC adsorbent. The ΔH0 values obtained are -10.625 and -12.641 in kJ/mol for MB and
SAF, respectively. The negative sign indicates that the process is exothermic [29,30]. The
increased values of ΔG0 between (-7.883 kJ/mol) and (-7.607 kJ/mol) for MB adsorption onto
NSC adsorbent and between (-7.813 kJ/mol) and (-7.327 kJ/mol) for SAF adsorption onto NSC
with the increasing temperature (298 K to 328 K) indicated a decrease in the feasibility of
adsorption at high temperatures. The values of entropy ΔS0 for MB and SAF adsorption onto
NSC adsorbent were (-9.2 J/mol.K) and (-16.2 J/mol.K), respectively. The negative ΔS0 value
indicates a decrease in randomness at the solid/solution interface. No significant changes occur
in the adsorbent's internal structure through the adsorption. Values of ΔG0 obtained are lower
than 20 kJ/mol; this further supports the fact that the adsorption process follows the
physisorption mechanism. This confirms the results following the study of the influence of pH.

 Table 5. Thermodynamic parameters for the adsorption of methylene blue and safranin on the natural Safiot
 clay at different temperatures.
 Thermodynamic parameters
 Adsorbate dyes Temperature (k) ΔG0 (kj/mol) ΔH0 (kj/mol) ΔS0 (J/ k mol)
 298 -7.883
 methylene blue 308 -7.791 -10.625 -9.2
 318 -7.699
 328 -7.607
 298 -7.813
 safranin 308 -7.651 -12.641 -16.2
 318 -7.489
 328 -7.327

 3.9. Comparison of natural safi clay with other adsorbents.

 Table 6 summarizes the comparison of the adsorption capacity of NSC adsorbents with
that reported for other adsorbents. It can be seen from Table 6 that the NSC adsorbent show a
comparable adsorption capacity with respect to other adsorbents, revealing that the NSC is
suitable for the removal of MB and SAF from aqueous solutions since it has a relatively high
adsorption capacity.

 Table 6. Comparison of the maximum monolayer adsorption capacity of the NSC for methylene blue and
 safranine removal with the other adsorbents.
 Dye Adsorbent qm ( mg g-1 ) References
 methylene blue natural saudi red clay 50.25 [31]
 brown clay 123.5 [32]
 krobo green clay 33.90 [33]
 natural zeolite 0.204 [34]
 zeolite 53.10 [35]
 natural safiot clay 68.49 This study
 safranin activated carbon (sewage-sludge) 11.05 [36]
 sugar beet pulp 147 [37]
 calcined mussel shells 196.67 [38]
 calcined bones 107.76 [39]
https://biointerfaceresearch.com/ 12728
https://doi.org/10.33263/BRIAC115.1271712731
 kaolinite clay 16.23 [40]
 natural safiot clay 45.45 This study

4. Conclusions

 In this study, the results indicated that natural safiot clay was considered low cost, eco-
friendly, and a promising alternative adsorbent for removing MB and Safranin from an aqueous
solution. The effect of adsorbent dose, initial concentration, contact time, temperature, and pH
were experimentally studied to evaluate NSC's adsorption capacity; the maximum percentage
removal was observed at high pH (basic medium) and ambient temperature. Equilibrium data
fitted very well with the Langmuir isotherm equation. The kinetics of the adsorption process
was found to follow the pseudo-second-order kinetic model. Therefore, the values obtained
from thermodynamic parameters demonstrated that the adsorption process is exothermic,
spontaneous, and physical.

Funding

This research received no external funding.

Acknowledgments

The authors are grateful who have participated in this research work.

Conflicts of Interest

The authors declare no conflict of interest.

References

1. Anuar, F.I.; Hadibarata, T.; Syafrudin, M.; Fona, Z. Removal of Procion Red MX- 5B from aqueous solution
 by adsorption on Parkia speciosa (stink bean) peel powder. Biointerface Res. Appl. Chem. 2020, 10, 4774–
 4779, https://doi.org/10.33263/BRIAC101.774779.
2. Katheresan, V.; Kansedo, J.; Lau, S.Y. Efficiency of various recent wastewater dye removal methods: A
 review. J. Environ. Chem. Eng. 2018, 6, 4676-4697, https://doi.org/10.1016/j.jece.2018.06.060.
3. Slimani, R.; El Ouahabi, I.; Abidi, F.; El Haddad, M.; Regti, A.; Laamari, M.R.; Lazar, S. Calcined eggshells
 as a new biosorbent to remove basic dye from aqueous solutions: thermodynamics, kinetics, isotherms and
 error analysis. J. Taiwan. Inst. Chem. Eng. 2014, 45, 1578-1587, https://doi.org/10.1016/j.jtice.2013.10.009.
4. El Kassimi, A.; Achour, Y.; El Himri, M.; Laamari, M. R.; El Haddad, M. Optimization of preparation
 conditions of highly efficient activated carbon for use in water treatment–experimental design approach. Int.
 J. Environ. Anal. Chem, 2021, 1-23, https://doi.org/10.1080/03067319.2020.1861261.
5. El Haddad, M.; Mamouni, R.; Saffaj, N.; Lazar, S. Evaluation of performance of animal bone meal as a new
 low cost adsorbent for the removal of a cationic dye Rhodamine B from aqueous solutions. J. Saudi Chem.
 Soc. 2016, 20, S53-S59, https://doi.org/10.1016/j.jscs.2012.08.005.
6. Regti, A.; El Ayouchia, H. B.; Laamari, M. R.; Stiriba, S. E.; Anane, H.; El Haddad, M. Experimental and
 theoretical study using DFT method for the competitive adsorption of two cationic dyes from wastewaters.
 Appl. Surf. Sci. 2016, 390, 311-319, https://doi.org/10.1016/j.apsusc.2016.08.059.
7. Somsesta, N.; Sricharoenchaikul, V.; Aht-Ong, D. Adsorption removal of methylene blue onto activated
 carbon/cellulose biocomposite films: Equilibrium and kinetic studies. Mater. Chem. Phys. 2020, 240,
 https://doi.org/10.1016/j.matchemphys.2019.122221.
8. Kristanti, R.A.; Hadibarata, T.; Al Qahtani, H.M.S. Adsorption of bisphenol A on oil palm biomass activated
 carbon: characterization, isotherm, kinetic and thermodynamic studies. Biointerface Res. Appl. Chem. 2019,
 9, 4217–4224, https://doi.org/10.33263/BRIAC95.217224.
9. Sözüdoğru, O.; Fil, B. A.; Boncukcuoğlu, R.; Aladağ, E.; Kul, S. Adsorptive removal of cationic (BY2) dye
 from aqueous solutions onto Turkish clay: Isotherm, kinetic, and thermodynamic analysis. Particul. Sci.
 Technol. 2016, 34, 103-111, https://doi.org/10.1080/02726351.2015.1052121.

https://biointerfaceresearch.com/ 12729
https://doi.org/10.33263/BRIAC115.1271712731

10. Mukherjee, K.; Kedia, A.; Rao, K.J.; Dhir, S.; Paria, S. Adsorption enhancement of methylene blue dye at
 kaolinite clay-water interface influenced by electrolyte solutions. RSC Advances 2015, 5, 30654-30659,
 https://doi.org/10.1039/C5RA03534A.
11. Turabik, M. Adsorption of basic dyes from single and binary component systems onto bentonite:
 Simultaneous analysis of Basic Red 46 and Basic Yellow 28 by first order derivative spectrophotometric
 analysis method. J. Hazard. Mater. 2008, 158, 52-64, https://doi.org/10.1016/j.jhazmat.2008.01.033.
12. Lee, Y.C.; Kim, J.Y.; Shin, H.J. Removal of malachite green (MG) from aqueous solutions by adsorption,
 precipitation and alkaline fading using talc. Sep. Sci. Technol. 2013, 48, 1093-1101,
 https://doi.org/10.1080/01496395.2012.723100.
13. Hmamouchi, S.; Mesrar, L.; Eloutassi, N.; Jabrane, R. Study of the mineralogical and mechanical evolution
 of the miocene marls in the region of fez (morocco) during firing. Journal of Applied Sciences and
 Environmental Studies. 2019, 2, https://doi.org/10.48393/IMIST.PRSM/jases-v2i2.17058.
14. Shao, D.; Xu, D.; Wang, S.; Fang, Q.; Wu, W.; Dong, Y.; Wang, X. Modeling of radionickel sorption on
 MX-80 bentonite as a function of pH and ionic strength. Sci. China, Ser. B: Chem. 2009, 52, 362-371,
 https://doi.org/10.1007/s11426-008-0145-x.
15. Tsai, W.T.; Chen, H.P.; Hsieh, M.F.; Sun, H.F.; Chien, S.F. Regeneration of spent bleaching earth by
 pyrolysis in a rotary furnace. Journal of Analytical and Applied Pyrolysis 2002, 63, 157-170,
 https://doi.org/10.1016/S0165-2370(01)00150-4.
16. Cótica, L.F.; Freitas, V.F.; Santos, I.A.; Barabach, M.; Anaissi, F.J.; Miyahara, R.Y.; Sarvezuk, P.W.C.
 Cobalt-modified Brazilian bentonites: Preparation, characterisation, and thermal stability. Appl. Clay Sci.,
 2011, 51, 187-191, https://doi.org/10.1016/j.clay.2010.10.033.
17. Alexander, J.A.; Ahmad Zaini, M.A.; Abdulsalam, S.; El-Nafaty, U.A.; Aroke, U.O Physicochemical
 characteristics of surface modified Dijah-Monkin bentonite. Particul. Sci. Technol. 2018, 36, 287-297,
 https://doi.org/10.1080/02726351.2016.1245689.
18. Kuang, Y.; Zhang, X.; Zhou, S. Adsorption of Methylene Blue in water onto activated carbon by surfactant
 modification. Water 2020, 12, http://dx.doi.org/10.3390/w12020587.
19. Hee-Jeong, C.; Sung-When, Y. Biosorption of methylene blue from aqueous solution by agricultural
 bioadsorbent corncob. Environ. Eng. Res. 2019, 24, 99-106, https://doi.org/10.4491/eer.2018.107.
20. Kousha, M.; Daneshvar, E.; Sohrabi, M.S.; Jokar, M.; Bhatnagar, A. Adsorption of acid orange II dye by
 raw and chemically modified brown macroalga Stoechospermum marginatum. Chem. Eng. J. 2012, 192, 67-
 76, https://doi.org/10.1016/j.cej.2012.03.057.
21. Jasińska, A.; Bernat, P.; Paraszkiewicz, K. Malachite green removal from aqueous solution using the system
 rapeseed press cake and fungus Myrothecium roridum. Desalin. Water Treat. 2013, 51, 7663-7671,
 https://doi.org/10.1080/19443994.2013.779939
22. Singh, N.B.; Nagpal, G.; Agrawal, S.; Rachna. Water purification by using Adsorbents: A Review. Environ.
 Technol. Innov. 2018, 11, 187–240, https://doi.org/10.1016/j.eti.2018.05.006.
23. Weber, T.W.; Chakravorti, R.K. Pore and solid diffusion models for fixed‐bed adsorbers. AIChE Journal
 1974, 20, 228-238, https://doi.org/10.1002/aic.690200204.
24. Satlaoui, Y.; Nasraoui, R.; Charef, A.; Azouzi, R. Adsorption, Modeling, Thermodynamic, and Kinetic
 Studies of Methyl Red Removal from Textile-Polluted Water Using Natural and Purified Organic Matter
 Rich Clays as Low-Cost Adsorbent. J. Chem. 2020, 2020, https://doi.org/10.1155/2020/4376173.
25. Nadir, I.; Achour, Y.; El Kassimi, A.; El Himri, M.; Laamari, M.R.; El Haddad, M. Removal of Antibiotic
 Sulfamethazine from Aqueous Media. Phys. Chem. Res. 2020, 9, 165-180,
 https://doi.org/10.22036/pcr.2020.249992.1839.
26. Aziz, E. K.; Abdelmajid, R.; Rachid, L. M.; Mohammadine, E.H. Adsorptive removal of anionic dye from
 aqueous solutions using powdered and calcined vegetables wastes as low-cost adsorbent. Arab. J. Basic
 Appl. Sci. 2018, 25, 93-102, https://doi.org/10.1080/25765299.2018.1517861.
27. Abd-Elhamid, A.I.; Emran, M.; El-Sadek, M.H.; El-Shanshory, A.A.; Soliman, H.M.A.; Akl, M.A.; Rashad,
 M. Enhanced removal of cationic dye by eco-friendly activated biochar derived from rice straw. Applied
 Water Science 2020, 10, 1-11, https://doi.org/10.1007/s13201-019-1128-0.
28. Harrou, A.; Gharibi, E.; Nasri, H.; El Ouahabi, M. Thermodynamics and kinetics of the removal of methylene
 blue from aqueous solution by raw kaolin. SN Applied Sciences 2020, 2, https://doi.org/10.1007/s42452-
 020-2067-y.
29. Bello, O.S.; Ahmad, M.A.; Ahmad, N. Adsorptive features of banana (Musa paradisiaca) stalk-based
 activated carbon for malachite green dye removal. Chem Ecol 2012, 28, 153-167,
 http://dx.doi.org/10.1080/02757540.2011.628318.
30. Bello, O.S.; Fatona, T.A.; Falaye, F.S.; Osuolale, O.M.; Njoku, V.O. Adsorption of eosin dye from aqueous
 solution using groundnut hull–based activated carbon: kinetic, equilibrium, and thermodynamic studies.
 Environ. Eng. Sci. 2012, 29, 186-194, https://doi.org/10.1089/ees.2010.0385.
31. Khan, M. Adsorption of methylene blue onto natural Saudi Red Clay: isotherms, kinetics and thermodynamic
 studies. Mater. Res. Express. 2020, 7, https://doi.org/10.1088/2053-1591/ab903c.

 https://biointerfaceresearch.com/ 12730
https://doi.org/10.33263/BRIAC115.1271712731

32. Munir, M.; Nazar, M.F.; Zafar, M.N.; Zubair, M.; Ashfaq, M.; Hosseini-Bandegharaei, A.; Ahmad, A.
 Effective Adsorptive Removal of Methylene Blue from Water by Didodecyldimethylammonium Bromide-
 Modified Brown Clay. ACS omega 2020, 5, 16711-16721, https://doi.org/10.1021/acsomega.0c01613.
33. Nyankson, E.; Mensah, R.Q.; Kumafle, L.; Gblerkpor, W.N.; Aboagye, S.O.; Asimeng, B.O.; Tiburu, E.K.
 Dual application of natural clay material for decolorization and adsorption of methylene blue dye. Cogent
 Eng. 2020, 6, https://doi.org/10.1080/23312009.2020.1788291.
34. Turp, S.M.; Turp, G.A.; Ekinci, N.; Özdemir, S. Enhanced adsorption of methylene blue from textile
 wastewater by using natural and artificial zeolite. Water Sci. Technol. 2020, 82, 513-523,
 https://doi.org/10.2166/wst.2020.358.
35. Doğan, M.; Alkan, M.; Onganer, Y. Adsorption of methylene blue from aqueous solution onto perlite. Water
 Air Soil Pollut. 2000, 120, 229-248, https://doi.org/10.1023/A:1005297724304.
36. Rozada, F.; Calvo, L.F.; Garcıa, A.I.; Martın-Villacorta, J.; Otero, M. Dye adsorption by sewage sludge-
 based activated carbons in batch and fixed-bed systems. Bioresour. Technol. 2003, 87, 221-230,
 https://doi.org/10.1016/S0960-8524(02)00243-2.
37. Malekbala, M.R.; Hosseini, S.; Yazdi, S.K.; Soltani, S.M.; Malekbala, M.R. The study of the potential
 capability of sugar beet pulp on the removal efficiency of two cationic dyes. Chem. Eng. Res. Des. 2012, 90,
 704-712, https://doi.org/10.1016/j.cherd.2011.09.010.
38. El Haddad, M.; Regti, A.; Slimani, R.; Lazar, S. Assessment of the biosorption kinetic and thermodynamic
 for the removal of safranin dye from aqueous solutions using calcined mussel shells. J. Ind. Eng. Chem,
 2014, 20, 717-724, https://doi.org/10.1016/j.jiec.2013.05.038.
39. El Haddad, M.; Slimani, R.; Mamouni, R.; Laamari, M.R.; Rafqah, S.; Lazar, S. Evaluation of potential
 capability of calcined bones on the biosorption removal efficiency of safranin as cationic dye from aqueous
 solutions. J. Taiwan. Inst. Chem. Eng. 2013, 44, 13-18, https://doi.org/10.1016/j.jtice.2012.10.003.
40. Adebowale, K.O.; Olu-Owolabi, B.I.; Chigbundu, E.C. Removal of safranin-O from aqueous solution by
 adsorption onto kaolinite clay. J.E.A.S, 2014, 4, https://doi.org/10.4236/jeas.2014.43010.

 https://biointerfaceresearch.com/ 12731
You can also read