LANGAN - Proposed Distribution Facility Project - Onondaga County Office of Economic Development
←
→
Page content transcription
If your browser does not render page correctly, please read the page content below
Traffic Impact Study
            for the proposed

Proposed Distribution Facility Project

            T own of Clay
     O nondaga County, New York

                 Project No. 39038

                   August 2019
               Updated October 2019

                   Prepared For:

          LANGAN
               989 Lenox Drive
                    S uite 124
   L awrencevi l le, New Jersey 08648-23 15
              A ttn: Dan Disario

                   Prepared By:

                      an sAs R
                   t     www.srfa net

             3 495 Winton Place
            B ui lding E, Suite 1 10
        R ochester, New York 14623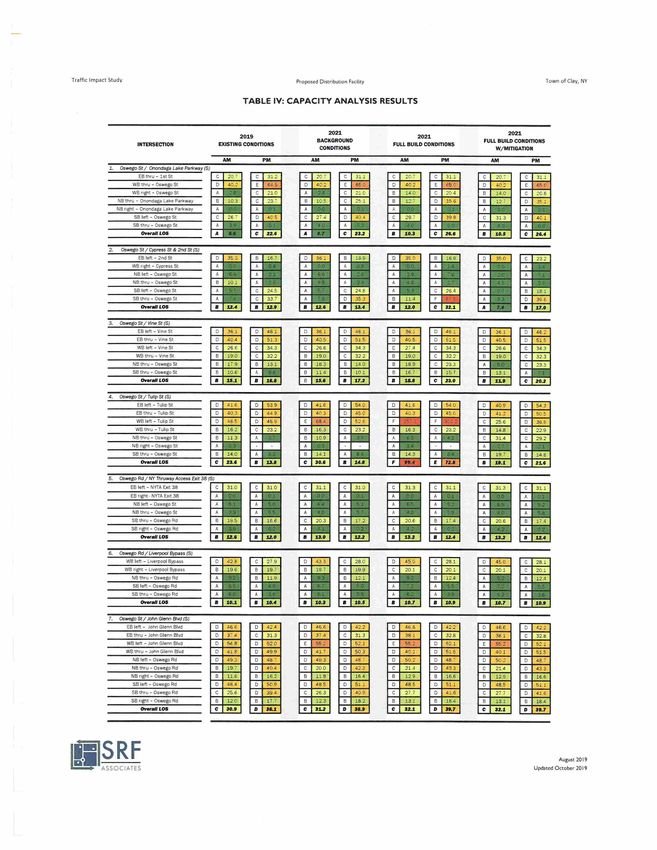
Traffic Impact Study
            for the proposed

Proposed Distribution Facility Project

            T own of Clay
     O nondaga County, New York

                 Project No. 39038

                    August 2019
               U pdated October 2019

                   Prepared For:

           LA/VGA/V
               989 Lenox Drive
                    S uite 124
   L awrencevi l le, New Jersey 08648-23 1 5
              A ttn: Dan Disario

                   Prepared By:

                         SR F
                         A SS O C I A T ES
                         www.srfa.net

             3 495 Winton Place
            B ui lding E, Suite 1 10
        R ochester, New York 14623
TABLE OF CONTENTS

LIST OF TABLES                                                                                 ii
LIST OF FIGURES                                                                                ii
LIST OF APPENDICES                                                                             ii
LIST OF REFERENCES                                                                             iii
EXECUTIVE SUMMARY                                                                              iv

I.     INTRODUCTION
I I.   LOCATION                                                                                     I
III.   EXISTING HIGHWAY SYSTEM                                                                  2
         A.        Existing Transportation Facilities                                           2
         B.        Planned/Programmed Highway Improvements                                      4
IV.    EXISTING TRAFFIC CONDITIONS                                                              4
         A.        Peak Intervals for Analysis                                                  4
         B.        Existing Traffic Volume Data                                                 4
         C.        Field Observations                                                           6
V.     FUTURE AREA DEVELOPMENT AND LOCAL GROWTH                                                 6
VI.    PROPOSED DEVELOPMENT                                                                     6
         A.        Description of Proposed Distribution Facility Project                        6
         B.        Site Traffic Generation                                                      7
         C.        Site Traffic Distribution                                                    8
VII.   FULL DEVELOPMENT VOLUMES                                                                 8
VIII. CAPACITY ANALYSIS                                                                         8
         A.        Description of Capacity Analysis                                             8
         B.        Capacity Analysis Results                                                    9
IX.    CONCLUSIONS & RECOMMENDATIONS                                                           16
X.     FIGURES                                                                                 18

               F
               „
                                                        ii                           August 201 9
                                                                           U pdated October 2019
       w ww$,ir,
LIST OF TABLES

TABLE I     EXISTING HIGHWAY SYSTEM                                         2
TABLE II    STUDY INTERSECTION COUNT DATES AND ACTUAL PEAK HOURS            4
TABLE III   PEAK HOUR SITE GENERATED TRIPS                                  7
TABLE IV    CAPACITY ANALYSIS RESULTS                                      10

                               LIST OF FIGURES

FIGURE I      SITE LOCATION & STUDY AREA
FIGURE 2       LANE GEOMETRY & AVERAGE DAILY TRAFFIC
FIGURE 3      PEAK HOUR VOLUMES — 2019 EXISTING CONDITIONS
FIGURE 4       PEAK HOUR VOLUMES — 2021 BACKGROUND CONDITIONS
FIGURE 5      CONCEPT PLAN
FIGURE 6      PROPOSED PEAK HOUR TRIP DISTRIBUTION
FIGURE 7      PEAK HOUR SITE GENERATED TRIPS
FIGURE 8      PEAK HOUR VOLUMES — FULL DEVELOPMENT CONDITIONS
FIGURE 8B     PEAK HOUR VOLUMES — FULL DEVELOPMENT CONDITIONS ADJUSTED
              DRIVEWAY VOLUMES

                             LIST OF APPENDICES

A l.   COLLECTED TRAFFIC VOLUME DATA
A2.    MISCELLANEOUS TRAFFIC DATA AND CALCULATIONS
A3.    LOS CRITERIA/DEFINITIONS
A4.    LEVEL OF SERVICE CALCULATIONS — EXISTING CONDITIONS
A5.    LEVEL OF SERVICE CALCULATIONS — BACKGROUND CONDITIONS
A6.    LEVEL OF SERVICE CALCULATIONS — FULL DEVELOPMENT CONDITIONS
A7.    LEVEL OF SERVICE CALCULATIONS — FULL DEVELOPMENT CONDITIONS WITH
       PROJECT MODIFICATIONS AND IMPROVEMENTS

91SRF                                   iii                      August 201 9
                                                       U pdated October 2019
LIST OF REFERENCES

1.   Highway Capacity Manual, Sixth Edition. Transportation Research Board. National
     Research Council, Washington, DC. 2016.
2.   Manual on Uniform Traffic Control Devices for Street and Highways (MUTCD). Federal
     Highway Administration. 2009.
3.   Trip Generation, Tenth Ed ition. Institute of Transportation Engineers. Washington D.C.
     2017.
4.   Tri p Generation Hand book, 3rd Edition. Institute of Transportation Engineers. Washington,
     DC. 2017.
5.   New York State Department of Transportation Traffic Data Viewer. Retrieved from
     https://www.dot.ny.gov/tdv. 2019.

6.   Traffic Im pact Assessment — Proposed Meyer Manor Apartments. GTS Consulting.
     February 26, 2016.

           F                                   iv                                August 2019
                                                                       U pdated October 2019
EXECUTIVE SUMMARY

OVERVIEW
The purpose of this report is to identify and evaluate the potential traffic impacts associated with
the Proposed Distribution Facility Project in the Town of Clay, New York. The operating
characteristics of the proposed access point and impacts to the adjacent roadway network are
identified and project modifications and improvements are provided to minimize, to the maximum
extent practicable, potential capacity and safety concerns. In an effort to define traffic impacts, this
analysis establishes existing traffic conditions, projects background traffic flow including area
growth, and projects changes in traffic flow due to the Proposed Distribution Facility Project.

The proposed project includes the development of a multistory warehouse with a footprint of
approximately 823,522± square feet to house a new distribution facility. The site will include 69±
loading docks, 200± trailer parking stalls, and 1,800± employee parking stalls. The project sponsor
is also in discussions with CENTRO regarding providing a bus stop either within the site or along
Morgan Rd. Access to the proposed development will be provided via five (5) driveways: one new
driveway along the Liverpool Bypass that will provide access to the car parking lot for employees
and a gated egress for the trailer parking area; and four (4) new driveways along Morgan Road.

Construction of the Proposed Distribution Facility Project is anticipated to reach full build-out in
approximately 1-2 years. Town of Clay and Village of Liverpool officials were contacted to discuss
projects within the study area that are under construction and/or approved. The following
developments were identified: a new child care center located at Morgan and Waterhouse Roads,
a small (I 5 lots) single family home development known as Morgan Meadow, and Meyer Manor
Apartments (130 units) located on Tulip Street just north of the NYS Thruway. Given the location
of the developments and proximity to the proposed site, traffic generated by the Meyer Manor
apartments was added to the existing traffic volumes in the study area. The other two
developments will not add significant volumes of traffic to study area intersections and traffic
volumes were not added to study area intersections as a direct result of these developments.
However, to account for normal increases in background traffic growth, including the two
previously mentioned developments, as well as any other unforeseen developments in the project
study area, a growth rate of 1.0 % per year has been applied to the existing traffic volumes, based
upon historical traffic growth derived from NYSDOT traffic volume data for the area, for the two-
year build-out period. Historical traffic volumes on Morgan Rd indicate a growth rate of
approximately 0.5% per year while traffic volumes in the Village of Liverpool on Oswego Rd have
decreased by approximately 0.6% per year of the last 20± years.

The existing and future operating characteristics of the site access intersections and impacts to
the adjacent roadway network are identified and improvements are provided to minimize any
capacity or safety concerns.

CONCLUSIONS & RECOMMENDATIONS
This Traffic Impact Study identifies and evaluates the potential traffic impacts resulting from full
build-out of the Proposed Distribution Facility Project. Based upon the comprehensive traffic
analysis contained in this report, it is our firm's professional opinion that the results indicate that
the Proposed Distribution Facility Project can be accommodated by the existing roadway network
with the recommendations below being in place. The following sets forth our firm's conclusions

0
1
14 SRF,,                                           v                                   August 2019
                                                                             U pdated October 2019
and recommendations based upon the results of the comprehensive traffic analyses that have been
conducted:

I. The proposed distribution facility is expected to generate approximately 1,289 (1,268) new
   trips during the AM (PM) study peak hours respectively inclusive of both passenger vehicles
   and trucks.

2. All truck traffic will travel directly to and from the NYS Thruway via Morgan Road and the
   Liverpool Bypass.

3. The following project modifications and improvements are recommended and, if approved by
   review agencies, will be constructed by the project sponsor:

    a) Oswego St/Tulip St
       • Widen and restripe the westbound Tulip St approach to provide two exclusive left
          turn lanes and a shared through/right lane. These lane use changes will require
          revisions to the signal phasing to provide a split phased operation for the eastbound
          and westbound approaches. The signal currently operates with a long westbound
          advance phase therefore changing to split phasing will not have a significant impact on
          Oswego St operations. With the proposed improvements in place, the intersection
          will operate at LOS "D" or better on all approaches during both peak hours. This
          change will also improve existing signal coordination with the other intersections
          included in this coordination system. Eastbound queuing on Tulip St will be reduced
          significantly over current conditions as a result of these improvements.
    b) Morgan Road/Buckley Road
       • Signal phasing/timing modifications to provide overlapping right turn arrows where
          appropriate.
    c) Morgan  Road/Proposed Site Driveways
       • Driveway I will create a "T" intersection at the northerly end of the site and be the
          primary truck ingress/egress as well as provide access to the northern end of the
          employee parking lot.
       • Driveway 2 will provide access to the largest number of employee parking spaces as
          well as ingress for the drop-off lane adjacent to the building and is located opposite
          the Raymour & Flanigan northerly (truck) driveway. As a result, this driveway will
          experience the highest volume of exiting traffic. Given the volume of traffic exiting
          this driveway and the projected operating conditions under unsignalized conditions, a
          new three-color signal is recommended at this location. The driveway should be
          designed to provide one entering lane and two exiting lanes (one shared left
          turn/through lane and one exclusive right turn lane).
       • Driveway 3 will be located opposite the southerly (employee) Raymour & Flanigan
          driveway. Given the volume of traffic exiting this driveway and the projected operating
          conditions under unsignalized conditions, a new three-color signal is recommended
          at this location. The driveway should be designed to provide one entering lane and
          two exiting lanes (one shared left turn/through lane and one exclusive right turn lane).
       • Driveway 4 will be located towards the southerly end of the proposed parking fields
          and will be slightly offset from the existing Morgan Place intersection on the east side
          of Morgan Rd. Given the offset and the opportunity to enter and exit the site at two

                                                vi                                August 2019
                                                                        U pdated October 2019
signalized locations, this driveway should be limited to right turns entering and right
         turns existing the driveway, i.e. all left turn movements should be prohibited.
     • The two unsignalized driveways shall be constructed with one entering and one
         exiting lane and be stop controlled at their intersections with Morgan Road.
     • Widening of Morgan Rd is also recommended to provide a 5-lane section between
         Liverpool Bypass/Crown Road and Driveway I at the northerly end of the site. This
         will provide two travel lanes in each direction as well as left turn lanes at each
         intersection in that segment.
     • Queuing will be accommodated within the proposed left turn lanes on Morgan Road
         and/or on-site for exiting traffic.
d)   Liverpool Bypass/Proposed Driveway 5
     • Driveway 5 will provide ingress and egress for the southerly end of the employee
         parking area as well as an egress for the trailer loading area.
     • Driveway 5 should be constructed with one entering and one exiting lane and be stop
         controlled at its intersection with Liverpool Bypass.
e)   Morgan Rd / Liverpool Bypass
     • Given the heavy northbound through volume and improvements that are necessary
         at other nearby intersections, an additional northbound through lane will be
         constructed between Commerce Blvd and connecting to the existing four-lane
         section to the north of the Liverpool Bypass. Minor signal timing changes will also
         improve operating conditions at both this intersection as well as at the Sheridan Rd
         intersection to the south.
f)   Morgan Rd / Sheridan Rd
     • Under full development conditions, the Sheridan Rd approach is expected to operate
         at LOS "F" with delays on the order of 65 seconds per vehicle during the AM peak
         hour and LOS "E" with delays on the order of 40 seconds per vehicle during the PM
         peak hour. Given the volume of traffic exiting Sheridan Rd during these peak time
         periods, 21 vehicles during the AM peak hour and I I vehicles during the PM peak
         hour, no improvements are warranted or recommended at this location. The new
         northbound through lane will have minimal impact on operating conditions at this
         intersection. It is noted that signal modifications at the Liverpool Bypass intersection
         will provide gaps in through traffic on Morgan Rd at Sheridan Rd.
g)   Tulip St / Commerce Blvd
     • Proposed improvements include first prohibiting westbound left turn movements
         from Commerce Blvd onto Tulip St. The existing westbound volumes are very low
         and there are better options for traveling south into the Village when coming from
         the east on Commerce Blvd. The westbound Commerce Blvd approach will then be
         re-striped and reconfigured to provide an exclusive westbound channelized right turn.
         I n addition, a separate northbound lane will be constructed beginning at this
         intersection and extending to the north through the Liverpool Bypass intersection
         meeting the existing northbound through lanes. This improvement will allow the right
         turns to flow freely through the intersection unimpeded.

4. The project sponsor should continue discussions with CENTRO to provide transit service
   either on-site or along Morgan Road.

         F                                    vii                                August 2019
                                                                       U pdated October 2019
L INTRODUCTION

The purpose of this report is to identify and evaluate the potential traffic impacts associated with
the Proposed Distribution Facility Project in the Town of Clay, New York. The operating
characteristics of the proposed access point and impacts to the adjacent roadway network are
identified and project modifications and improvements are provided to minimize potential capacity
and safety concerns.

In an effort to define traffic impacts, this analysis establishes existing traffic conditions, projects
background traffic flow including area growth, and projects changes in traffic flow due to the
Proposed Distribution Facility Project.

II. LOCATION

The Proposed Distribution Facility Project is located at the northwest corner of Morgan Road
and the Liverpool Bypass in the Town of Clay, Onondaga County, New York. The site is currently
occupied by the Liverpool Golf and Public Country Club. In order to ensure a comprehensive
analysis of potential traffic impacts, a geographically broad study area was selected consisting of
the following 18 existing intersections and 3 proposed driveways:

     I. Oswego St (Old Route 57)-Onondaga Lake Parkway / First Street — Old Liverpool Road,
          signalized
    2. Oswego St (Old Route 57)/ Cypress Street- Second Street, signalized
    3. Oswego St (Old Route 57)/ Vine Street, signalized
    4. Oswego St (Old Route 57)/ Tulip Street, signalized
    5. Oswego St (Old Route 57)/ Thruway Interchange 38, signalized
    6. Oswego St (Old Route 57)/ Liverpool Bypass, signalized
    7. Oswego St (Old Route 57)/ John Glenn Boulevard, signalized
    8. Oswego St (Old Route 57)/ Wetzel Road, signalized
    9. Morgan Road / Wetzel Road, signalized
     1 0. Morgan Road / Buckley Road, signalized
       I. Henry Clay Boulevard / Buckley Road, signalized
     1 2. Morgan Road / Proposed Driveway I, unsignalized
     1 3. Morgan Road / Raymour & Flanigan North Driveway-Proposed Driveway 2, unsignalized
     1 4. Morgan Road / Raymour & Flanigan South Driveway-Proposed Driveway 3, unsignalized
     I S. Morgan Road I Proposed Driveway 4, unsignalized
     1 6. Liverpool Bypass / Proposed Driveway 5, unsignalized
     1 7. Morgan Road / Liverpool Bypass-Crown Road, signalized
     1 8. Morgan Road / Sheridan Road, unsignalized
     1 9. Morgan Road — Tulip Street / Commerce Boulevard, unsignalized
    20. Vine Street / Commerce Boulevard, signalized
    21. Henry Clay Boulevard / Vine-Street-Taft Road, signalized

The site location and study area are shown in Figure I — Site Location and Study Area (all
figures are included at the end of this report).

                                                   1                                  August 2019
                                                                            U pdated October 2019
III. EXISTING HIGHWAY SYSTEM

           A. Existing Transportation Facilities
           Details of the existing roadway network in the vicinity of the project site are summarized in Table
           I below. The Annual Average Daily Traffic(AADT)counts referenced below were obtained based
           upon the most recent traffic counts collected by the New York State Department of
           Transportation (NYSDOT).

                                                    TABLE I
                                  E XISTING HIGHWAY SYSTEM
                                                                        # OF         TRAVEL
                                    FUNC.                     SPEED                                  EST.  AADT
     ROADWAY             ROUTE'                  IURIS?                TRAVEL       PATTERN/
                                    CLASS'                    LIMIT'                                AADT6 SOURCE'
                                                                       LANES'       DIRECTION
  Old Liverpool Rd                               OCDOT/
                                    Principal                                         Two-way/                   NYSDOT
      (From 1" St        CR 137                  Village of       30       4                          13,795
                                    Arterial                                         North South                  (2016)
    to Liverpool TL)                             Liverpool
      Oswego St                                  NYSDOT/
                                    Principal                                         Two-way/                   NYSDOT
    (From Tulip St       NY 370                  Village of       30       4                         28,349
                                    Arterial                                         North South                  (2015)
     to Cypress St)                              Liverpool
      Oswego Rd
  (Old Route 57)                    Principal                                         Two-way/                   NYSDOT
                          CR 91                  OCDOT            40       2                         26,325
  (From N Village Ln                Arterial                                         North-South                  (2016)
     to Gaskin Rd)
   Onondaga Lake
                                    Principal
       Parkway                                                                        Two-way/                   NYSDOT
                         NY 370      Arterial    NYSDOT           45       4                         22,352
(From Old Liverpool Rd                                                               North-South                  (2015)
                                   Expressway
  to City of Syracuse)
        Vine St
                                     Minor                                            Two-way/                   NYSDOT
  (From Oswego St         CR 51                  OCDOT            40       2                          13,682
                                    Arterial                                          East-West                   (2016)
  to Henry Clay Blvd)
        Tulip St                                 OCDOT/
                                     Minor                                            Two-way/                   NYSDOT
  (From Oswego St         CR 47                  Village of       30       4                          10,795
                                    Arterial                                          East-West                   (2014)
        to 1-90)                                 Liverpool
   Liverpool Bypass
                                     Minor                                            Two-way/                   NYSDOT
  (From Oswego Rd         CR 88                  OCDOT            40       2                          6,899
                                    Arterial                                          East-West                   (2015)
       to CR 47)
     NYS Thruway                     Principal
                                                                                      Two-way/                   NYSDOT
        Exit 38           N/A        Arterial    NYSDOT           20       2                          1 3759
                                                                                                         ,
                                                                                      East-West                   (2016)
     Entrance/Exit                  Interstate
   John Glenn Blvd                   Principal
                                                                                      Two-way/                   NYSDOT
  (From Oswego Rd         CR 81      Arterial    OCDOT            40       4                          1 3012
                                                                                                         ,
                                                                                      East-West                   (201 1)
     to Morgan Rd)                 Expressway
      Wetzel Rd
                                     Major                                            Two-way/                   NYSDOT
  (From Oswego Rd        CR 252                  OCDOT            30       2                          5,250
                                   Collector                                          East-West                   (2014)
     to Morgan Rd)
      Wetzel Rd
                                                                                      Two-way/                   NYSDOT
  (From Morgan Rd        CR 252       Local      OCDOT            35       2                          6,201
                                                                                      East-West                   (2016)
  to Henry Clay Blvd)

           r
           ,. SRF                                             2                               August 2019
                                                                                    U pdated October 2019
# OF TRAVEL
FUNC. SPEED EST. AADT
ROADWAY ROUTE' JURIS.3 TRAVEL PATTERN/
CLASS' AADT6 SOURCE'
LANES
' DIRECTION
Morgan Rd Two-way/ NYSDOT
Minor
(From Buckley Rd CR 46 OCDOT 45 2 1 0,012
Arterial North-South (201 1)
to NY 31)
Morgan Rd Two-way/ NYSDOT
Minor
(From 1-90 CR 47 OCDOT 45 4 1 6.362
Arterial North South (2016)
to Buckley Rd)
Buckley Rd Two-way/ NYSDOT
Principal
(From John Glenn Blvd CR 46 OCDOT 45 2 1 6,350
Arterial East-West (2012)
to CSX Railroad)
Henry Clay Blvd Two-way/ NYSDOT
Principal
(From Hopkins Rd CR 45 OCDOT 45 4 21,594
Arterial North-South (2015)
to CR 161)
Henry Clay Blvd Two-way/ NYSDOT
Major
(From Buckley Rd CR 121 OCDOT 45 4 1 4,839
Collector North-South (2016)
to Wetzel Rd)
Commerce Blvd Two-way/ NYSDOT
Major
(From Morgan Rd N/A Town of Salina 40 4 7,232
Collector East-West (2016)
to Vine St)
Notes:
I. Route Name/Number:"NYS" = New York State.
2. State Functional Classification of Roadway: All are Urban.
3. Jurisdiction: "NYSDOT" = New York State Department of Transportation, "OCDOT" = Onondaga
County Department of Transportation.
4. Posted or Statewide Limit in Miles per Hour (MPH).
5. Excludes turning/auxiliary lanes developed at intersections.
6. Estimated AADT in Vehicles per Day (vpd).
7. Source (Year). SRF Associates ("SRF") volumes determined via an extrapolation of turning movement
counts.
Figure 2 illustrates the lane geometry at each of the study intersections and the AADT volumes
on the study roadways.
PEDESTRIAN FACILITIES
There are no existing pedestrian facilities in the vicinity of the site on either Morgan Road or the
Liverpool Bypass.
BICYCLE FACILITIES
Currently no dedicated bicycle facilities exist within the study area. Bicyclists are permitted to
share the road on all roadways within the study area.
TRANSIT FACILITIES
Public transit service within the study area is provided by the Central New York Regional
Transportation Authority (CENTRO). CENTRO routes 46 and 246 provide service to the area
using Old Route 57 and routes 48, 148, and 248 passes directly by the proposed site on Morgan
Road.
3 August 2019
U pdated October 2019B. Planned/Programmed Highway Improvements
The Onondaga County Department of Transportation (OCDOT) was contacted to determine if
there are any highway or intersection improvements planned within the study area. The following
improvements were identified:
• Oswego St (Old Route 57) / Wetzel Road - Signal to be replaced in 2019 with Ped
accommodations, mast arms, and camera detection system
• Morgan Road / Buckley Road - Signal to be upgraded in 2019 with Ped accommodations
and camera detection system
• Henry Clay Boulevard / Vine-Street-Taft Road - Signal to be upgraded in 2020 with Ped
accommodations and camera detection system
Additionally, OCDOT has the following upcoming paving projects planned:
• Oswego St (Old Route 57)from Blackberry Drive to Pine Hollow is being repaved this
year.
• Buckley Road from Morgan Road to Henry Clay Boulevard is being repaved this year
• Henry Clay Boulevard from West Taft Road to Hopkins Road scheduled to be repaved
in 2020
• Vine Street from Henry Clay Boulevard to Burr Drive scheduled to be repaved in 2020
• West Taft Road from Henry Clay Boulevard to Buckley Road to be repaved in 2020
The planned OCDOT improvements are not included in the analyses in this report.
IV. EXISTING TRAFFIC CONDITIONS
A. Peak Intervals for Analysis
Given the functional characteristics of the Proposed Distribution Facility Project, the peak hours
selected for analysis are generally the weekday commuter AM and PM peaks. The combination of
site traffic and adjacent through traffic produces the greatest demand during these time periods.
B. Existing Traffic Volume Data
Weekday AM (6:00-9:00 AM) and PM (4:00-7:00 PM) peak hour volumes were collected by SRF
Associates (SRF) at the study area intersections listed in Section II above. Turning movement
count data was collected by SRF at the study intersections on various dates between Tuesday,
J une I I , 2019 and Tuesday, June 25, 2019. The count dates and actual peak hour traffic periods
for each study intersection are noted in Table II below.
T ABLE I I
S TUDY INTERSECTION COUNT DATES AND
A CTUAL INTERSECTION PEAK HOURS
INTERSECTION COUNT DATES AM PEAK PM PEAK
Tuesday
Oswego St / Onondaga Lake Parkway 7:15-8:15 AM 4:30-5:30 PM
06/1 1/2019
Tuesday
Oswego St / Cypress St / 2'St 7:15-8:15 AM 4:30-5:30 PM
06/1 1/2019
ism SRF
4 August 2019
L
inn ASSOCfATES
www.srfo.nel
U pdated October 2019INTERSECTION COUNT DATES AM PEAK PM PEAK
Tuesday
Oswego St / Vine St 7:15-8:15 AM 4:30-5:30 PM
06/1 1/2019
Tuesday
Oswego St / Tulip St 7:15-8:15 AM 4:30-5:30 PM
06/1 1/2019
Oswego Rd / Wednesday
7:15-8:15 AM 4:45-5:45 PM
NYS Thruway Access Exit 38 06/12/2019
Tuesday
Oswego Rd / Liverpool Bypass 7:15-8:15 AM 4:30-5:30 PM
06/1 1/2019
Tuesday
Oswego St / John Glenn Blvd 7:15-8:15 AM 4:45-5:45 PM
06/25/2019
Tuesday
Oswego Rd / Wetzel Rd 7:00-8:00 AM 4:45-5:45 PM
06/1 1/2019
Thursday
Morgan Rd / Wetzel Rd 7:00-8:00 AM 4:30-5:30 PM
06/ 1 3/2019
Wednesday
Morgan Rd / Buckley Rd 7:00-8:00 AM 4:30-5:30 PM
06/ 1 2/2019
Thursday
Henry Clay Blvd / Buckley Rd 7:15-8:15 AM 4:30-5:30 PM
06/ 1 3/2019
Morgan Rd / Wednesday
7:00-8:00 AM 4:30-5:30 PM
Raymour Flanigan N Driveway 06/12/2019
Morgan Rd / Wednesday
7:00-8:00 AM 4:30-5:30 PM
Raymour Flanigan S Driveway 06/ 1 2/0219
Wednesday
Morgan Rd / Sheridan Rd 7:15-8:15 AM 4:30-5:30 PM
06/12/2019
Wednesday
Tulip St / Commerce Blvd 7:15-8:15 AM 4:30-5:30 PM
06/1 2/2019
Wednesday
Vine St / Commerce Blvd 7:30-8:30 AM 4:30-5:30 PM
06/12/2019
Thursday
Henry Clay Blvd / Vine St / W Taft Rd 7:15-8:15 AM 4:30-5:30 PM
06/13/2019
The peak hours for the potential project traffic are different from the actual intersection peak
time periods as a result of the shift times for employees (see detailed discussion in Section VI of
this report). Based upon the employee arrival and departure times for the defined shifts, the peak
hours used for analysis were 6:30-7:30 AM and 5:30-6:30 PM. Intersection traffic volumes during
these time periods are generally similar to and slightly lower than traffic volumes during the actual
intersection peak hours. In the vicinity of the site on Morgan Rd, traffic volumes are approximately
20% lower during the AM site peak hours and 30% lower during the PM site peak hours than
d uring the AM and PM commuter peak hours.
Historical Saturday traffic volumes on Morgan Rd were also reviewed and compared to weekday
traffic volumes during the same time periods. The proposed distribution facility will operate the
same shifts on weekends that are used on weekdays. Facility peak hours for trip generation, as
noted above, will occur between 6:30-7:30 AM and 5:30-6:30PM. Saturday peak hours on Morgan
Rd occur during the middle of the day when there are no shift changes at the site. During the shift
change time periods(AM and PM peak hours), Saturday traffic volumes on Morgan Road are 74%
lower than the weekday AM peak hour and 28% lower than the weekday PM peak hour traffic
volumes. Therefore, improvements proposed by the project are based upon analysis of the
weekday peak hours and no Saturday analyses are necessary.
Le
RF
ASSOCIATES
5 August 2019
U pdated October 2019
www,rfo.netAll turning movement count data were collected on typical weekdays while local schools were in
session. The traffic volumes were reviewed to confirm the accuracy and relative balance of the
collective traffic counts. The 2019 weekday AM and PM peak hour existing traffic volumes are
reflected in Figure 3.
C. Field Observations
The study intersections were observed during both peak intervals to assess current traffic
operations. Signal timing information collected in the field were utilized to determine peak hour
phasing plans and phase durations during each interval. This information was used to support
and/or calibrate capacity analysis models described in detail later in this report.
V. FUTURE AREA DEVELOPMENT AND LOCAL GROWTH
Construction of the Proposed Distribution Facility Project is anticipated to reach full build-out in
approximately 1-2 years. Town of Clay and Village of Liverpool officials were contacted to discuss
projects within the study area that are under construction and/or approved. The following
developments were identified: a new child care center located at Morgan and Waterhouse Roads,
a small (15 lots) single family home development known as Morgan Meadow, and Meyer Manor
Apartments (130 units) located on Tulip Street just north of the NYS Thruway. Given the location
of the developments and proximity to the proposed site, traffic generated by the Meyer Manor
apartments was added to the existing traffic volumes in the study area. The other two
developments will not add significant volumes of traffic to study area intersections and traffic
volumes were not added to study area intersections as a direct result of these developments.
However, to account for normal increases in background traffic growth, including the two
previously mentioned developments, as well as any other unforeseen developments in the project
study area, a growth rate of 1.0 % per year has been applied to the existing traffic volumes, based
upon historical traffic growth derived from NYSDOT traffic volume data for the area, for the two-
year build-out period. Historical traffic volumes on Morgan Rd indicate a growth rate of
approximately 0.5% per year while traffic volumes in the Village of Liverpool on Oswego Rd have
decreased by approximately 0.6% per year of the last 20± years. All ambient growth calculations
are included in the appendix. The background traffic volumes are depicted in Figure 4.
VL PROPOSED DEVELOPMENT
A. Description of Proposed Distribution Facility Project
The Proposed Distribution Facility Project includes the development of a multistory warehouse
with a footprint of approximately 823,522± square feet to house a new distribution facility. The
site will include 69± loading docks, 200± trailer parking stalls, and 1,800± employee parking stalls.
The project sponsor is also in discussions with CENTRO regarding providing a bus stop either
within the site or located at one of the site driveways on Morgan Rd.
Access to the proposed development will be provided via five (5) driveways: one new driveway
along the Liverpool Bypass that will provide access to the car parking lot for employees and a
gated egress for the trailer parking area; and four (4) new driveways along Morgan Road. Figure
5 illustrates the proposed concept plan.
6 August 2019
U pdated October 2019B. Site Traffic Generation
The volume of traffic generated by a site is dependent on the intended land use and size of the
development. Trip generation is an estimate of the number of trips generated by a specific building
or land use. These trips represent the volume of traffic entering and exiting the development. Trip
Generation, 10th Edition is used as a reference for this information. The trip rate for the peak
hour of the generator may or may not coincide in time or volume with the trip rate for the peak
hour of adjacent street traffic. In this case, volumes generated during the peak hour of the site
represent a more critical volume when analyzing the capacity of the system; those intervals will
provide the basis of this analysis. All trip generation information has been included in the appendix.
According to the Institute of Transportation Engineers (ITE), the following steps are
recommended when determining trip generation for proposed land uses:
i. Check for the availability oflocal trip generation rates for comparable uses.
ii. Iflocal trip data for similar developments are not available and time and funding permit, conduct
trip generation studies at sites with characteristics similar to those ofthe proposed development.
Trip generation data for the Proposed Distribution Facility Project are based on employee count
and truck traffic data for similar distribution facilities. From this data, peak hour passenger car and
truck trips were calculated for Full Development Conditions.
These types of distribution facilities typically experience carpool and transit ridership that reduces
the single occupant vehicles traveling to and from the site by approximately 19%. However, review
of transit and carpool statistics for Onondaga County indicate that approximately 8% of people
carpool to work and 3% of people use public transportation. In addition, 4% of people walk to
work while less than I% of people use a bicycle to commute to work. For analysis purposes, and
to be conservative, it was assumed that 10% of employees will either carpool or use public
transportation. Hence, the total peak hour employee trips were reduced by 10%.
Table III summarizes the peak hour trips during the peak hour of the generator (6:30-7:30AM
and 5:30-6:30PM) based upon the shift times for these types of distribution facilities. This
projection is based upon extensive data compiled by the developer for similar distribution facilities
and is included the Appendix.
TABLE I I I
P EAK HOUR SITE GENERATED TRIPS
AM PEAK PM PEAK
DESCRIPTION
ENTER EXIT ENTER EXIT
Distribution Center
704 575 621 631
Employees
Distribution Center
10 10 8 8
Trucks
Total Site Generated Trips
714 575 629 639
(2,142 Total Employees)
SRF
%,
.5,71,C.,A7 ES
7 August 2019
U pdated October 2019Under Full Development Conditions, the proposed distribution facility project is anticipated to
generate 714 entering/575 exiting vehicle trips during the AM peak hour of the generator and 629
entering/639 exiting vehicle trips during the weekday PM peak hour of the generator; these
volumes include both passenger vehicles and truck trips as noted in Table III above.
C. Site Traffic Distribution
The cumulative effect of site traffic on the transportation network is dependent on the origins
and destinations of that traffic and the location of the access drives serving the site.
The proposed arrival/departure distribution of traffic to be generated at this site is considered a
function of several parameters, including the following:
• Existing highway network;
• Proximity and access to local area highways;
• Population centers;
• Location of employee parking on the proposed site plan; and
• Existing traffic patterns, traffic conditions, and controls
Census data for the Syracuse area and Onondaga County were used to determine likely origin
and destination areas for the potential employees. In addition, existing traffic patterns were
reviewed in detail to determine likely travel routes. Figure 6 shows the anticipated passenger car
trip distribution pattern percentages for employees at full build-out of the proposed distribution
facility. All truck traffic will travel directly to and from the NYS Thruway via Morgan Road and the
Liverpool Bypass. Figure 7 shows the resulting total site generated traffic (including cars and
trucks) as assigned to the study area intersections for the weekday AM and PM peak hour periods
under full build-out conditions.
VII. FULL DEVELOPMENT VOLUMES
The projected design hour traffic volumes were developed for the weekday AM and PM peak
hours by combining the future background traffic conditions (Figure 4), and projected site
generated volumes for full build-out of the proposed site (Figures 7) in order to yield the total
traffic conditions expected at full development. Figure 8 illustrates the total weekday AM and
PM peak hour volumes anticipated for the proposed development under full build-out conditions.
VIII. CAPACITY ANALYSIS
A. Description of Capacity Analysis
Capacity analysis is a technique used for determining a measure of effectiveness for a section of
roadway and/or intersection based on the number of vehicles during a specific time period. The
measure of effectiveness used for the capacity analysis is referred to as a Level of Service (LOS).
Levels of Service are calculated to provide an indication of the amount of delay that a motorist
experiences while traveling along a roadway or through an intersection. Since the most amount
F 8 August 2019
U pdated October 2019of delay to motorists usually occurs at intersections, capacity analysis focuses on intersections, as
opposed to highway segments.
Six Levels of Service are defined for analysis purposes. They are assigned letter designations, from
"A" to "F", with LOS "A" representing the best conditions and LOS "F" the worst. Suggested ranges
of service capacity and an explanation of Levels of Service are included in the Appendix.
The standard procedure for capacity analysis of signalized and un-signalized intersections is
outlined in the Highway Capacity Manual (HCM 2016) published by the Transportation Research
Board. Traffic analysis software, Synchro 10, which is based on procedures and methodologies
contained in the HCM, was used to analyze operating conditions at study area intersections. The
procedure yields a Level of Service based on the HCM 2010 as an indicator of how well
intersections operate.
B. Capacity Analysis Results
Existing and background operating conditions during the peak study periods are evaluated to
determine a basis for comparison with the projected future conditions. The projected future
traffic volumes generated by the Proposed Distribution Facility Project were analyzed to assess
the operations of the intersections in the study area.
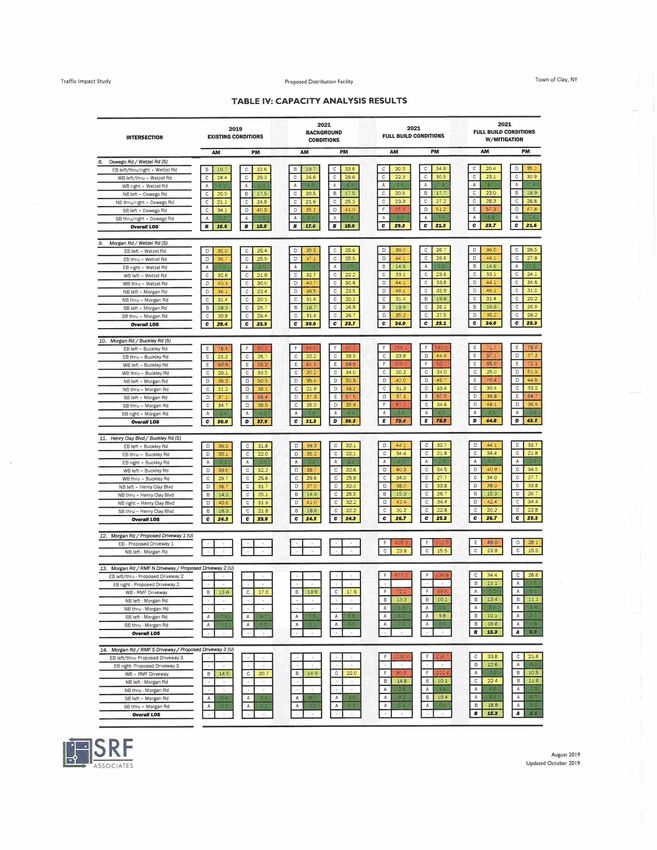
Capacity results for existing, background, and full development conditions are listed in Table IV.
The discussion following the table summarizes capacity conditions. All capacity analysis calculations
are included in the Appendices.
August 2019
SRF 9
S
I w v,w.sr ,e1
U pdated October 2019Traffic Impact Study Proposed Distribution Facility Town of Clay, NY
TABLE IV: CAPACITY ANALYSIS RESULTS
2021 2021
2019 2021
BACKGROUND FULL BUILD CONDITIONS
INTERSECTION EXISTING CONDITIONS FULL BUILD CONDITIONS
CONDITIONS W/MITIGATION
AM PM AM PM AM PM AM PM
1
. Oswego St/ Onondaga Lake Parkway(S)
EB thru - 1st St 111E111 20 2 31.1 20.7 31.1 111
WB thru - Oswego St ElEDE F4 5 402 68 40 2 65 El
20,4
W B right - Oswego St 21.0 A C MIMI
NB thru - Onondaga Lake Parkway 131111 10 05 I
o®
NB right - Onondaga Lake Parkway A 01 A 0.0 0.1 00
U
SB left - Oswego St 111Ell 40 5 2 4 43 4 29 39 .3 o r
SB thru - Oswego St U A 4.0 40 60
*wall LOS n 22.6 A 5.7 23.2 10.3 26.6 131
2
. Oswego St/ Cypress St & 2nd St(S)
EB left - 2nd St 3L 8 16' 39 1 38 0 MIEEO
WA right - Cypress St 0.0 0.6 A 0.0 0.3 0.0 16 El
NB left - Oswego St 6.9 2.1 A 6.6 2.6 29 6 U
N B thru - Oswego St , 2.6 98 2.4 4.8
Q .
SB left - Oswego St 57 24 E A 5.7 24 5.3 264 ICI®
SB thru - Oswego St A 7.4 33 A 7.9 35.3 114 DEMI
Oman LOS 12.4 12.9 B 12.6 B 13.4 B 12.0 32.1 ElWM
3. Oswego St/ Vine St(5)
EB left - Vine St 36.1 36.1 46.1 36.1 45 1 D 36 1 46.2
EB thru - Vine St 40.4 40 51,5 aas 40.5 51A
WB left - Vine St 26.6 26.6 34 3 278 34.3 260 34.3
WB thru - Vine St 19.0 19.0 32.2 19.0 32.2 191 32.3
NB thru - Oswego St 17.9 18.3 14.0 18.9 23.3 A 05.0 233
SB thru - Oswego St 10.6 11.4 10.1 16.7 15.7 13 1 A
°reran LOS 15.1 15.6 B 17.2 B 18.8 23.0 12-9 20.2
4. Oswego St/ Tulip St(5)
EB left - Tulip St 41.6 ElMEI 42E 54.0 D 41.6 o® o® 54 .3
EB thru - Tulip St 40.3 ElOM 40.3 45.0 D 403 13311 El® 57 E.
WB left - Tulip St 48.5 II 46.9 68 4 52 ElE3131 35F
WB thru - Tulip St 1E1E13
16.2 16.3 23.2 163 El® ElIMEM 22.9
NB thru - Oswego St 11.3 111 109 3.6 6.5 El 231 ElEEO 29.2
4 EEO ea El
NB right - Oswego St A 0.3 A 3.4 A
1
SB thru - Oswego St 14 131113111 14 1 A 8.4 14 3 '331 ElWM _4.6
084ra1l LOS 23.6 I31E23
1E23 30.6 B 14.8 F 99.0 ©EEO ElEEO 21.6
5
. Oswego Rd/ NY Thruway Access Exit 38(S)
EB left - NYTA Exit 38
LIEN 31.1
LIEN LIEN
EB right NYTA Exit 38 A 00
NB left - Oswego St U A 6.4 U El®
NB thru - Oswego St A 4.0
ElEIS
SB thru - Oswego Rd
SB right - Oswego Rd
LIEMI
El A
20.3
4,1
LIEU
® ElEMI 1
®®
Oswalt LOS ElECU 13.0 13® EllEU
6. Oswego Rd/Liverpool Bypass(5)
WB left - Liverpool Bypass 131113 El® ElEll 28.0 455 28.1 EINEM 28
WB right - Liverpool Bypass ®EOM ElEMI ElMil ,99 20 1 20.2 BEIM 20...
NB thru - Oswego Rd AT OED 12.1 A 9.2 12.4 12
SB left- Oswego Rd U El EV A 5.0 A 7,2 5.5 U A 5.5
SB thru - Oswego Rd El A . 3.6 A 6.2 3.3 ntakdia. 3.8
Ovor611 LOS E11133 ElMI of B 10.5 10.7 B 10.9 EMEZEI 10.9
7
. Oswego St/John Glenn Blvd(5)
CB left - John Glenn Blvd 46.6 42.4 46 6 42,2 46 6 42.2 46E 42.2
EB thru - John Glenn Blvd 37.4 31.3 31.3 38 1 32.8 i 32.8
WB left - John Glenn Blvd 54.8 52.0 51 Br 52.1 55.2 52 1 55 2 52.1
WB thru - John Glenn Blvd 41.8 49.9 41 7 50.3 4C.1 5a 9 40 1 D 515
NB left - Oswego Rd D 49.3 48 49.3 48 7 50.2 46' 48 7
NB thru - Oswego Rd 19.7 404 20,0 D 42.3 21.4 21.4
NB right - Oswego Rd 11.6 16.2 11.8 16.4 12.9 16.6 12 9 16.6
SB left - Oswego Rd 48.4 50.9 48.5 51.1 D 48 5 51 1 48 E.
SB thru - Oswego Rd 25.6 39.4 26.3 40.9 27.7 41.6 27 40 6
SB right - Oswego Rd 12.0 17.7 8 12.3 18.2 13.1 18.4 131 18 4
Ovorall LOS 30.9 38.1 31.2 0 38.9 82.1 39.7 32.1 39.7
SR
F August 2019
ASSOCIATES Updated October 2019Traffic Impact Study Proposed Distribution Facility Town of Clay, NY
TABLE IV: CAPACITY ANALYSIS RESULTS
2021 2021
2019 2021
BACKGROUND FULL BUILD CONDITIONS
INTERSECTION EXISTING CONDITIONS FULL BUILD CONDITIONS
CONDITIONS W/MITIGATION
AM PM AM PM AM PM AM PM
8. Oswego Rd/ Wetzel Rd (9)
EB left/thru/right - Wetzel Rd 13E11 ElEli 0E ElEEO MI'®
WB left/thru - Wetzel Rd MIME 131E31 MIME ElEMI BEE
WB right - Wetzel Rd MI MI CIAWN EliliaaiN E1311
NB left - Oswego Rd 311E3 ElEMI o® MI® BEE
NB thru/right - Oswego Rd =EMI El® El12E1 ElEMI MEE
SB left -Oswego Rd 31E31 El ElOM El1111
SB thru/right - Oswego Rd MI MI MI MI MI
Overall LOS 13123 0E23 1317123 nos' ElEU
9. Morgan Rd/Wetzel Rd(3)
EB left - Wetzel Rd 35,1' 25.6 D 39.0 39.0
EB thru - Wetzel Rd
EB right - Wetzel Rd
O
A
36
13
o®
A
25.5 D
8
44 1
14.9
MIME
MI
44.1
14.9
MIME
MIME
WB left - Wetzel Rd
WB thru - Wetzel Rd
32.6
403
El
MI®
El123
22.2
30.6
C 33.1
44.1
BE
CIEMI
33.1
44.1 0
13
MIME
E
NB left - Morgan Rd 3d 23.5 49.1 49.1
NB thru - Morgan Rd
SB left - Morgan Rd
314
18.3
MIME
ElEll
131E31
20.1
26.8
31.4
19.9
Elram
ElECE
EMEI
B
314
15.9
OED
MIME
ElEU
SB thru - Morgan Rd 30.8 26.7 35.2 MI® 35.2 Ell
El121
Overall LOS 29.4 ElEn 23.7 C 34.0 0® 34.0 1303
10. Morgan Rd/ Buckley Rd (S)
EB left - Buckley Rd 764
21.2
ElLai MI 57
79.4
3'3
EB thru - Buckley Rd ElOM ElEMIIEll
WB left - Buckley Rd 609 C
11E21
WB thru - Buckley Rd 20.1 MI® 31 0
31E31
NB left - Morgan Rd 3b 3 13E213 D r04 44.5
13E31
NB thru - Morgan Rd 21 1 334 30 .1 33.2
MIKE 13E11
SB left - Morgan Rd 3- 11133 575 36.8 64
EIRE
SB thm - Morgan Rd 34 7 MI® 6 O 396
MI®
SB right - Morgan Rd A 3.4 A 4.5 A 2.5 3.6
Overall LOS 30.0
El
ElEU cam
1111
0 44.6 43.5
.1.1. Henry Clay Blvd/ Buckley RCS)
EB left - Buckley Rd 39 3 33.7 44 MI®
MI® MIME [IEEE
D 35 2 21.8 34
EB thru - Buckley Rd
E8 right - Buckley Rd
WB left - Buckley Rd
13EMI
MI
13EEO
2111/_
39
MI®
El-,
ElLEE
A
34.5
A 0.2
40 P
B
El1E3
EE1
WB thru - Buckley Rd
NB left - Henry Clay Blvd
1
MI
ElEOM
®
3EZ21 El®
MIME
13131
29.6
37.0
MIME
ElBEI
27.7
33.8 D
34 0
38.0
ElEll
13Ell
NB thru - Henry Clay Blvd 14 4 o® 26.7 15.3 EEU
ElEEL 13EMI
NB right - Henry Clay Blvd 41.0 34.4 D 42.4
13 40.6 131E3 ElESE El=I
SB thru - Henry Clay Blvd 18.6 ElDEE 22.B 20.2 13EDI
ElME ElEU
Overall LOS EMI EEEI 24.5 13 25.3 /L7 ElE3:I
1:1
12. Morgan Rd/ Proposed Driveway 1(U)
EB - Proposed Driveway 1 MIME MIME MIME MIME El MI1E8 MIME
NB left - Morgan Rd MIME MIME E MI EM El® MI® ElEE:I 111
13. Morgan Rd/RMF N Driveway/ Proposed Driveway 2(U)
EB left/thru - Proposed Driveway 2 8 ElEMI
MIME 111E3 MIME
58 right - Proposed Driveway 2
WB - RMF Driveway
MI ME MIME MIME I:IEEO
ElEn MIME 131E3 -
NB left- Morgan Rd B
NB thru - Morgan Rd
SB left - Morgan Rd
ElME
MME
NEI MEEN
II
MI
111E31
MIME
MI
A
98
Ulnas
1311311
ElEll
SB thru - Morgan Rd MI ElEMI
Overall LOS MIME MIME MIME o®
14. Morgan Rd/RMFS Driveway/ Proposed Driveway 3(U)
EB left/thru- Proposed Driveway 3
613 right- Proposed Driveway 3
MIME
MIME
MIME
MIME
216 El
13Ell
arm MI® BEM
WB - RMF Driveway - 20.7 ' ElEE1 ElEU 211 4 13133
NB left- Morgan Rd 10 1 ElENE ElMEI
NB thru - Morgan Rd MIME MI EM A MI
SB left - Morgan Rd A MI MI -04 MI MI
SB thru - Morgan Rd A MI 3Eli MI
Overall LOS MIME Ism 1
13Ell El
sR F August 2019
Updated October 2019
ASSOCIATESTraffic Impact Study Proposed Distribution Facility Town of Clay, NY
TABLE IV: CAPACITY ANALYSIS RESULTS
2021 2021
2019 2021
BACKGROUND FULL BUILD CONDITIONS
INTERSECTION EXISTING CONDITIONS FULL BUILD CONDITIONS
CONDITIONS W/MITIGATION
AM PM AM PM AM PM AM PM
15. Morgan Rd/Proposed Driveway 4(U)
EB - Proposed Driveway 4 RE aa MEE IIEll o® 20 aa
NB left- Morgan Rd
aa aa aa REEMI o® aa
/6. Liverpool Bypass/ Proposed Driveway5(U)
EB Left -Liverpool Bypass ea aa aa aa Ell El El
SB Proposed Driveway 5 aa IE aa aa ElEMI EREDE EN EMI
17. Morgan Rd/Liverpool Bypass(S)
EB thru - Liverpool Bypass 34.6 3
.8 212 34.9 33.8 WEE 338
EB right - Liverpool Bypass 11.0 158 61 14.6 A 10.0
WB thru - Crown Rd 19 7 19 2 19.1 16.2 ElEIS 16.5
NB left - Morgan Rd A 5.5 5.8 A 6.7 10.4 10.0 El 17.8
NB thru - Morgan Rd A 5.4 A 5.6 B 104 15.9 26.5
SB left - Morgan Rd A 9.3 9.3 12.3 10.3 12.0 ElE1 13 7
SB thru - Morgan Rd 118 15.4 18.9 B 15.2 EllIEEE 196
Overall LOS 11.7 12.0 119 18.1 20.0 EnIEEE 13.7
18. Morgan Rd/Sheridan Rd(U)
EB -Sheridan Rd aa ElIEEE ©a
NB left- Morgan Rd EHUN ElEMI ElEMI
/9. Tulip St/ Commerce Blvd(U/S)
WB right - Commerce Blvd aa El
WB - Commerce Blvd 150 19.0 E 4-9 EH IE IEIRE
SB left - Tulp St A 9.9 9.9 • B 10.1 ElKEE En ENIEEE a®
20. Vine St/ Commerce Blvd(S)
EB thru - Vine St 113 9.1 14 2 9.2 MEER B 10.0
WB thru - Vine St B 14.3 A 7.1 14 3 El® a&-mw 18.0
SB left - Commerce Blvd EEO 19.1 13.5 29.8 20 0. ElEMI ®a 34.8
Orerall LOS EAEll 14.3 1/5 14.8 14.9 13EMI ElNM 214
21. Henry Clay Blvd/ Vine St/ W Taft Rd(S)
EB left - Vine St EllLEE D 41.3 D 45 1 D 43 4
aa D 43 .1
EB thru - Vine St o® g1 D 40.6 415 406 D 415
EB right - Vine St Ei / 1101111
A 8.4111 A ;6.5.
WB lett - Taft Rd D 37.1 40 7 38.9 LI D 38.9
WB thru - Taft Rd LIMU B 19.3 24.8 23.3 ENELI 23.3
N B left - Henry Clay Blvd o1:03 41 .5 D 46.8 D 41.8 LIWIN D 400
NB thru - Henry Clay Blvd LEN 31.3 34 2 33 1 EN WEI 33.1
NB right - Henry Clay Blvd
SB left - Henry Clay Blvd ElEli
A
D
7.1 A
D
6.8
46 1 44.3 EN NM
, 11111
44.3
SB thru - Henry Clay Blvd ENIEEE 24.6 30.5 27.0 LIEMU 27 0
Overall LOS 0122E1 26.5 319 29.1 LILEI 29.1
NOTES:
I. A(2.8) = Level of Service (Delay in seconds per vehicle)
2. (S) = Signalized;(U)= Unsignalized
3. N/A = Approach does not exist and/or was not analyzed during this condition
4. F(") = Delay greater than 200 seconds per vehicle
6/1 SRF ASSOCIATES
August 2019
U pdated October 2019The peak hour capacity analysis results indicate that in general, most of the approaches at the
study intersections will operate similarly to 2021 Background Conditions with the proposed
improvements in place.
The following intersections do not require improvements as a result of the proposed
development: Oswego Rd/NYS Thruway, Oswego Rd/Liverpool Bypass, Oswego Rd/John Glenn
Blvd, Henry Clay Blvd/Buckley Rd, Henry Clay Blvd/Taft Rd, and Morgan Rd/Sheridan Rd.
Additionally, the following intersections will require minor signal timing adjustments to minimize
minor traffic impacts associated with the proposed distribution facility: Oswego St/Onondaga Lake
Parkway-Old Liverpool Rd-First St., Oswego St/Cypress St-2nd St, Oswego St/Vine St, Oswego
Rd/Wetzel Rd, Morgan Rd/Wetzel Rd, and Vine St/Commerce Blvd. Minor signal adjustments can
either by handled by the existing signal via the actuated controller or may require minor
programming adjustments by the appropriate agency (NYSDOT or Onondaga County DOT).
There is sufficient space for queuing on the Liverpool Bypass for trucks turning left onto Oswego
Road to access the Thruway. Similarly, there is sufficient space for queuing exiting the Thruway
toll booth for trucks turning left onto Oswego Road.
Intersections requiring additional modifications or improvements are discussed in detail below.
4. Oswego St / Tulip St
During the peak hours, the eastbound and westbound approaches operate at LOS "D" and "E"
under existing and background conditions. The addition of traffic related to the proposed
distribution facility results in LOS "F" on the westbound left turn movement during both peak
hours. The westbound Tulip St approach should be widened and restriped to provide two
exclusive left turn lanes and a shared through/right lane. These lane use changes will require
revisions to the signal phasing to provide a split phased operation for the eastbound and
westbound approaches. The signal currently operates with a long westbound advance phase
therefore changing to split phasing will not have a significant impact on Oswego St operations.
With the proposed improvements in place, the intersection will operate at LOS "D" or better on
all approaches during both peak hours. This change will also improve existing signal coordination
with the other intersections included in this coordination system. Eastbound queuing on Tulip St
will be reduced significantly over current conditions as a result of these improvements.
Approximately 0.1 acres of land that is currently outside of the NYSDOT right-of-way (ROW)
will be required to construct this improvement. This land may be acquired through donation to
NYSDOT and/or purchase via eminent domain.
I0. Morgan Rd / Buckley Rd
The intersection of Morgan and Buckley Roads operates at LOS "D","E", and "F" for most of the
movements under existing and background conditions. The proposed distribution facility is
expected to add traffic through this intersection further increasing delays. The project proposes
to revise signal timings and to work with OCDOT to provide right turn arrows overlapping with
left turn phasing where feasible and appropriate. Synchro cannot appropriately model conditions
with right turn arrows where exclusive turn lanes do not exist. Therefore, the analysis results are
not reflective of these improvements. However, keeping in mind that the future conditions will
provide better operating conditions, the analysis results show that all approaches will operate at
LOS "E" or better during both peak hours studied.
ruSR
„,„.F„, 13 August 2019
U pdated October 2019Morgan Rd / Proposed Driveways
Driveways I through 4 are proposed to provide site access to the site along Morgan Road.
Driveway I will create a "T" intersection at the northerly end of the site and be the primary truck
ingress/egress as well as provide access to the northern end of the employee parking lot. All
movements are projected to operate at LOS "D"("E") or better the AM(PM) peak hours once
driveways 2 and 3 are signalized as discussed below.
Driveway 2 will provide access to the largest number of employee parking spaces as well as ingress
for the drop-off lane adjacent to the building and is located opposite the Raymour & Flanigan
northerly truck driveway. As a result, this driveway will experience the highest volume of exiting
traffic. Given the volume of traffic exiting this driveway and the projected operating conditions
under unsignalized conditions, a new three-color signal is recommended at this location. A signal
at this driveway will also draw additional traffic from driveway I to this location. The driveway
should be designed to provide one entering lane and two exiting lanes (one shared left
turn/through lane and one exclusive right turn lane). The signalized intersection is projected to
operate at LOS "C" or better during both peak hours on all approaches.
Driveway 3 will be located opposite the southerly Raymour & Flanigan (employee) driveway and
will experience delays when exiting during peak hours. Given the volume of traffic exiting this
driveway and the projected operating conditions under unsignalized conditions, a new three-color
signal is recommended at this location. A signal at this driveway will also draw additional traffic
from driveway 4 to this location. The driveway should be designed to provide one entering lane
and two exiting lanes (one shared left turn/through lane and one exclusive right turn lane). The
signalized intersection is projected to operate at LOS "C" or better during both peak hours on
all approaches.
Driveway 4 will be located towards the southerly end of the proposed parking fields and will be
slightly offset from the existing Morgan Place intersection on the east side of Morgan Rd. Given
the offset and the opportunity to enter and exit the site at two signalized locations, this driveway
should be limited to right turns entering and right turns existing the driveway, i.e. all left turn
movements should be prohibited. This driveway is projected to operate at LOS "C" or better
d uring both peak hours.
Figure 8B shows the re-distributed traffic volumes at all of the site driveways and the Morgan
Rd/Liverpool Bypass intersections resulting from signalization of driveways 2 and 3. There are no
traffic volume changes at any of the other study area intersections.
The two unsignalized driveways shall be constructed with one entering and one exiting lane and
be stop controlled at their intersections with Morgan Road.
Widening of Morgan Rd is also recommended to provide a 5-lane section between Liverpool
Bypass/Crown Road and Driveway I at the northerly end of the site. This will provide two travel
lanes in each direction as well as left turn lanes at each intersection in that segment.
Queuing will be accommodated within the proposed left turn lanes on Morgan Road and/or on-
site for exiting traffic.
t
liSRF 14 August 2019
U pdated October 2019I 6. Liverpool Bypass / Proposed Driveway 5
Driveway 5 will provide ingress and egress for the southerly end of the employee parking area as
well as an egress for the trailer loading area. This driveway is expected to operate at LOS "B" on
all approaches during both peak hours.
1 7. Morgan Rd / Liverpool Bypass
The Morgan Rd/Liverpool Bypass intersection is projected to operate at LOS "C" on all
approaches during both peak hours. Given the heavy northbound through volume and
improvements that are necessary at other nearby intersections, an additional northbound through
lane will be constructed between Commerce Blvd and connecting to the existing four-lane section
to the north of the Liverpool Bypass. Minor signal timing changes will also improve operating
conditions at both this intersection as well as at the Sheridan Road intersection to the south. All
approaches will continue to operate at LOS "C" or better during both peak hours. There is
sufficient space for queuing on the Liverpool Bypass for cars and trucks turning left onto Morgan
Road to access the site.
18. Morgan Rd / Sheridan Rd
The Sheridan Rd approach operates at LOS "C" or better under existing and background
conditions during both peak hours. Under full development conditions, the Sheridan Rd approach
is expected to operate at LOS "F" with delays exceeding 70 seconds per vehicle during the AM
peak hour. Given the volume of traffic exiting Sheridan Rd during these peak time periods, 2I
vehicles during the AM peak hour and I I vehicles during the PM peak hour, no modifications or
improvements are warranted or recommended at this location. The new northbound through
lane will have minimal impact on operating conditions at this intersection. It is noted that signal
modifications at the Liverpool Bypass intersection will provide gaps in through traffic on Morgan
Rd at Sheridan Road. With the proposed improvements in place, Sheridan Road is expected to
operate at LOS "C" or better. It is noted that capacity analysis results are based upon SimTraffic
analysis. SimTraffic is a microscopic, dynamic traffic simulation model that considers the traffic
flow and gap conditions at intersections and can more accurately reflect actual operating
conditions at unsignalized intersections that are in close proximity to signalized intersections.
19. Tulip St / Commerce Blvd
Under existing and background conditions, the Commerce Blvd approach is projected to operated
at LOS "C" and "E" during the AM and PM peak hours respectively. The northbound and
southbound approaches operate at LOS "B" or better during both peak hours under existing and
background conditions. The full build conditions result in very long delays for the westbound
Commerce Blvd approach with LOS "F" during both peak hours. Proposed improvements include
first prohibiting westbound left turn movements from Commerce Blvd onto Tulip St. The existing
westbound volumes are very low and there are better options for traveling south into the Village
when coming from the east on Commerce Blvd. The westbound Commerce Blvd approach will
then be re-striped and reconfigured to provide an exclusive westbound channelized right turn. In
addition, a separate northbound lane will be constructed beginning at this intersection and
extending to the north through the Liverpool Bypass intersection meeting the existing northbound
through lanes. This improvement will allow the right turns to flow freely through the intersection
unimpeded.
Concept plans showing the proposed physical intersection improvements as well as the proposed
truck route are attached following the referenced figures in this report.
SR F
ASSOCtATES
15 August 2019
U pdated October 2019
www.srfa.netIX. CONCLUSIONS & RECOMMENDATIONS
This Traffic Impact Study identifies and evaluates the potential traffic impacts resulting from full
build-out of the Proposed Distribution Facility Project. Based upon the comprehensive traffic
analysis contained in this report, it is our firm's professional opinion that the results indicate that
the Proposed Distribution Facility Project can be accommodated by the existing roadway network
with the recommendations below being in place. The following sets forth our firm's conclusions
and recommendations based upon the results of the comprehensive traffic analyses that have been
conducted:
I. The proposed distribution facility is expected to generate approximately 1,289 (1,268)
new trips during the AM (PM) study peak hours respectively inclusive of both passenger
vehicles and trucks.
2. All truck traffic will travel directly to and from the NYS Thruway via Morgan Road and
the Liverpool Bypass.
3. The following project modifications and improvements are recommended and, if approved
by review agencies, will be constructed by the project sponsor:
a) Oswego St/Tulip St
• Widen and restripe the westbound Tulip St approach to provide two exclusive
left turn lanes and a shared through/right lane. These lane use changes will require
revisions to the signal phasing to provide a split phased operation for the
eastbound and westbound approaches. The signal currently operates with a long
westbound advance phase therefore changing to split phasing will not have a
significant impact on Oswego St operations. With the proposed improvements in
place, the intersection will operate at LOS "D" or better on all approaches during
both peak hours. This change will also improve existing signal coordination with
the other intersections included in this coordination system. Eastbound queuing
on Tulip St will be reduced significantly over current conditions as a result of
these improvements.
b) Morgan Road/Buckley Road
• Signal phasing/timing modifications to provide overlapping right turn arrows
where appropriate.
c) Morgan Road/Proposed Site Driveways
• Driveway I will create a "T" intersection at the northerly end of the site and be
the primary truck ingress/egress as well as provide access to the northern end of
the employee parking lot.
• Driveway 2 will provide access to the largest number of employee parking spaces
as well as ingress for the drop-off lane adjacent to the building and is located
opposite the Raymour & Flanigan northerly (truck) driveway. As a result, this
driveway will experience the highest volume of exiting traffic. Given the volume
of traffic exiting this driveway and the projected operating conditions under
unsignalized conditions, a new three-color signal is recommended at this location.
The driveway should be designed to provide one entering lane and two exiting
lanes (one shared left turn/through lane and one exclusive right turn lane).
SRF 16 August 2019
S ASSOGIA'E `u
ww.srfonel
U pdated October 2019You can also read