THE UNINTENDED CONSEQUENCES OF FREEZING FUEL DUTY - Professor David Begg Claire Haigh - Greener Journeys
←
→
Page content transcription
If your browser does not render page correctly, please read the page content below
THE UNINTENDED
CONSEQUENCES
OF FREEZING
FUEL DUTY

     Professor David Begg
             Claire Haigh

              1st June 2018
THE UNINTENDED CONSEQUENCES
                       OF FREEZING FUEL DUTY
                 Professor David Begg & Claire Haigh

                            TABLE OF CONTENTS
EXECUTIVE SUMMARY

1. THE CHALLENGE

1.1   Many road users do not cover their external costs
1.2   The public believe they are paying too much road tax
1.3   Fuel duty has been frozen for eight consecutive budgets
1.4   The price of road fuel is a divisive issue

2. UNINTENDED CONSEQUENCES OF FREEZING FUEL DUTY

2.1   Increased volume of traffic
2.2   Impact on rail and bus patronage
2.3   Increased levels of pollution and congestion
2.4   Social equity implications
2.5   Reduced income for the Treasury

3. GETTING THE PRICE SIGNALS RIGHT

3.1   Government intends to increase fuel duty in 2019/20
3.2   Impact on public finances of cleaner vehicles
3.3   Projected increase in volume of traffic
3.4   Disruptive technologies and trends
3.5   Increasing road capacity
3.6   Changing how we pay for road use

4. CONCLUSION & RECOMMENDATIONS

APPENDIX I: Marginal external costs and taxes paid by road users

APPENDIX II: Projected growth in traffic calculation

                                                                   1
EXECUTIVE SUMMARY
Increasing costs for road users is politically difficult. This is one of the reasons why
we have had seven years and eight consecutive budgets where fuel duty has been
frozen at a time of historically low oil prices and austerity.
The result of seven years of fuel duty freezes is that the price of fuel at the pump is
13% lower than it would otherwise have been. While the freeze has been welcomed
by many road users and has undoubtedly been of benefit to people struggling on low
incomes dependent on car travel, there have been some unintended consequences.
As a direct result of the freeze in fuel duty since 2011:
• Traffic has grown by 4%, worsening both congestion and pollution
• The increase in traffic has produced an additional 4.5 million tonnes of CO2,
including 2.8 million from cars and taxis and 1.7 million from lorries and vans1
• The increase in traffic has produced 12 thousand tonnes of NOx, and 816
tonnes of PM10s2
• The freeze on fuel duty cost the Treasury around £7 billion in lost tax revenue
in 20173. Since 2011 the freeze has cost the Treasury around £46 billion4. In
addition, there had been less rail revenue and more rail subsidy.
• Public transport usage has decreased by between 1.3% and 3.9% causing
there to be up to 60 million fewer rail journeys and up to 200 million fewer bus
journeys5
The impact of congestion means that the above figures underestimate the increase
in CO2, NOx and PM10s. Emissions from road traffic increase by approximately
40% as the result of congestion6. It is also likely that the decline in bus use is even
greater because of the increase in congestion caused by the growth in traffic. Buses
suffer more from congestion than any other mode of transport. Congestion has been
causing bus speeds to fall by on average 10% every decade, causing bus patronage
to all by 10-14%7.
The Government has stated that from the financial year 2019/20 fuel duty will be
uprated each year in line with the growth in the RPI. They are right to make this
commitment. It is vitally important that Government delivers on this commitment as
a minimum if it is to begin to send the right price signals to road users.
Currently price signals are leading to worsening pollution and congestion. This year,
for the first time since 2000, the CO2 emissions from the average car sold in the UK
1 Calculations based on data from Office for National Statistics, Environmental Accounts: November 2017
2 Calculations based on data from Office for National Statistics, Environmental Accounts: November 2017
3 Calculation based on data from OBR, 2017
4
HM Treasury, June 2017
5 Rail Statistics Gov. UK (2016) and Bus statistics Gov.UK (2018)
6 Bath and Boriboonsomin, 2008
7 Prof David Begg, report for Greener Journeys 2016, The Impact of Congestion on Bus Passengers
2has increased. The cheaper fuel price combined with the improved efficiency of
vehicles has encouraged consumers to purchase larger vehicles with an increase in
demand for SUVs8.
Government needs to begin to redress the balance if it is to tackle some of the most
serious externalities arising from motoring including pollution and congestion.
Economic analysis conclusively demonstrates that many road users do not cover
their external costs, especially in congested urban areas. The challenge is that the
public feel they are paying too much for their road use. Since the fuel duty protests
in 2000, followed by the referendums on congestion charging in Edinburgh and
Manchester, levying additional charges on road users has become politically difficult.
In the medium to longer term, the impact electric vehicles will have on Government
finances and traffic volumes will be serious. The Government plans to phase out
sale of petrol and diesel cars by 2040 (2030 in Scotland). Whilst the new electric
vehicles will be cleaner and safer, they will not solve the congestion problem and
they will leave a hole in the Treasury finances When the £29 billion paid in fuel duty
disappears. If driving is cheaper congestion will worsen. Unless a new way to pay
for road use is introduced to replace fuel duty:
• Traffic on our roads will increase by an additional 30%. This is in addition to
the 40% growth in traffic already predicted by DfT by 20359, leading to an
overall increase in traffic of approximately 70% by 2035.
Politically it will be very challenging for Government to impose a compulsory change
in how we pay for road use. However, the advent of autonomous vehicles presents
the opportunity to introduce a voluntary change in how we pay for road use. The
desire to operate vehicles in autonomous mode will be strong enough for many to
accept the condition that they pay differently for road use. This is a one-off
opportunity to get the public to adopt change.
RECOMMENDATIONS
1. Government to honour its commitment to increase fuel duty at
least in line with inflation at next Budget
2. Policies to encourage modal switch from car to public transport,
walking and cycling
3. Government to move to a new model for paying for road use
8 SMMT 2018
9 DfT Road Traffic Forecast 2017
31. THE CHALLENGE
Economic analysis conclusively demonstrates that many road users do not
cover their external costs. However, the challenge for Government is that the
public feel that they are already paying too much.
Increasing costs on road users is politically difficult. This is one of the
reasons why we have had eight consecutive budgets where fuel duty has been
frozen at a time of historically low oil prices and austerity.
1.1 Many road users do not cover their external costs
Economists believe that many road users are paying too little road tax as they don't
in aggregate cover their external costs. External costs include congestion,
accidents, local air pollution, noise, greenhouse gas emissions, harm to landscape
and biodiversity.
Department for Transport (DfT) research in 2010 (the last year that this data was
published) showed that road users failed by a considerable margin to cover their
external costs. [Appendix I – Marginal External Costs and Taxes paid by road users]
We would encourage DfT to update this research and forecast how the gap between
externalities (primarily congestion) and what road users pay in tax will increase in the
future, if current road tax rates remain unchanged.
Most estimates would indicate that congestion accounts for more than 80% of
externalities. As we move towards a vehicle fleet that is electric, with dramatic
reductions in emissions and considerably less noise from quieter electric vehicles,
we can expect the proportion of externalities accounted for by congestion to grow
even further while the contribution from pollution diminishes.
When we add to this the advent of autonomous vehicles which, by removing human
error, are predicted to reduce road accidents by up to 80%, plus the relentless rise in
traffic, it is clear that congestion is the overwhelming externality.
1.2 The public believe they are paying too much road tax
The challenge we face in factoring external costs into the price of motoring is that the
public feel they are already paying too much in road taxation.
Since the fuel duty protests in 2000, followed by the referendums on congestion
charging in Edinburgh and Manchester, levying additional charges on road users has
become politically toxic. The public believe they are paying too much in road tax as
it dwarfs the amount spent on road investment and maintenance. They do not
recognize the external costs of motoring, especially that their journey imposes a
congestion cost on other road users.
4The result of the failure of road taxation to cover externalities is that we over-
consume roads and make incredibly inefficient use of them with very low car
occupancy rates. If the external cost of individual road journeys was covered in the
tax paid, then road capacity should rise to accommodate rising traffic and an efficient
allocation of resources would occur.
1.3 Fuel duty has been frozen for eight consecutive budgets
It is difficult for politicians not to have affinity with public opinion. This explains why
we have had eight consecutive budgets where fuel duty has been frozen - despite
the price of oil hitting historically low levels and public finances under severe strain.
Fuel duty has not been increased since January 2011 when it was increased from
58.19p per litre to 58.95p per litre. It was cut by 1p per litre in the budget two months
later (March 2011) to 57.95p per litre. It has been frozen at this level since. This
means there have been eight consecutive budgets where fuel duty has not been
increased, not even in line with inflation.
This has been trumpeted as a boost to motorists. In his 2016 budget, the Chancellor,
Philip Hammond, said: “This will save the average car driver £130 per year and the
average van driver £350 per year. It is a tax cut worth £850 next year and means the
current freeze is the largest for 40 years”
While this freeze in fuel duty has been welcomed by motorists and van users there
have been unintended consequences which policy makers should take cognisance
of and certainly be aware of if they continue with this policy.
1.4 The price of road fuel is a divisive issue
The price of road fuel is one of the most divisive political issues in the country, with
campaigners demanding both higher and lower duties.
Environmental groups insist that the levels of duty charged by the Government fall
short of meeting the true environmental costs of motoring. They point to the rising
numbers of short private car journeys and call for higher duties to discourage
"unnecessary" vehicle use.
While the Fuel Duty Escalator was introduced with an explicit environmental
purpose, opponents of the fuel duty regime reject this approach as ignoring
important factors. People living in rural areas, it is argued, cannot be driven onto
public transport by high fuel excise duties in the way that the environmental lobby
demands, because the availability of public transport is inadequate. Car is seen as a
necessity for many people especially those who live in rural areas.
More widely, it is frequently argued that public transport everywhere is not good
enough to encourage people out of their cars, and that as such, higher duties result
in nothing more than financial penalties for drivers. The state of the transport
5infrastructure, and the levels of taxation extracted from motorists in general, are a
widespread cause of resentment amongst the public10
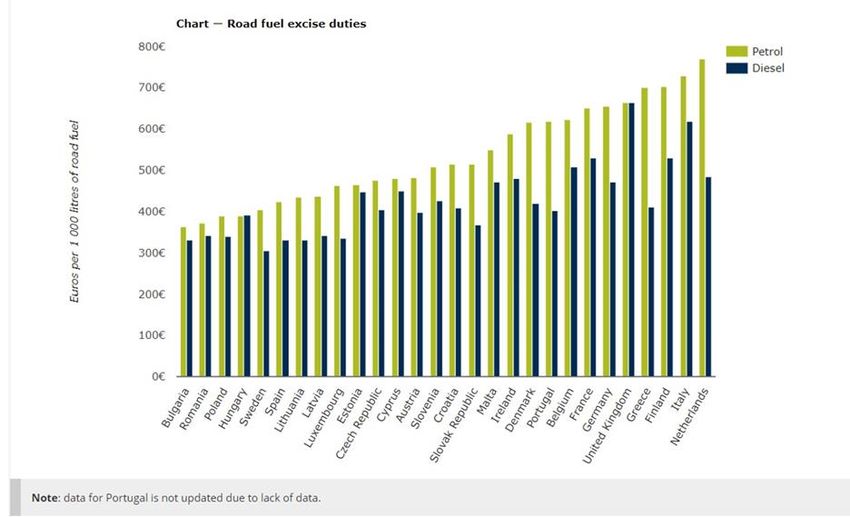
It is often argued that the UK has the highest fuel prices in Europe, a claim which is
not borne out by the evidence. The chart below shows four European countries with
higher fuel duty levels than the UK11. It should also be noted that motorway tolling is
also much more prevalent in mainland Europe than it is in the UK.
10 OBR 2017
11
European Commission Environmental report 2017
62. UNINTENDED CONSEQUENCES OF FREEZING FUEL DUTY
While the freeze in fuel duty has been welcomed by many road users and has
undoubtedly been of benefit to people struggling on low incomes and
dependent on car travel, there have been both winners and losers.
This section examines the unintended consequences of freezing fuel duty in
terms of growth in traffic; decline in rail and bus patronage; increased levels of
pollution; and, reduced income for the Treasury.
2.1 Increased volume of traffic
Following seven years, including eight budgets, where fuel duty has been frozen, the
price of fuel is lower than it would otherwise have been, and this has resulted in
more road traffic.
If fuel duty had been increased in line with inflation since 2010 it would be 23%
higher than it is today12. This would make it 13.33p higher at 71.28p per litre (based
on price at the pump March 2018). In addition, the VAT on fuel at 20%, which is
charged on the post fuel duty price, would add another 2.66p per litre, increasing the
price by 16p per litre.
With the price for unleaded petrol at an average of 122p per litre (March 2018) an
increase of 16p per litre would represent a 13% increase in the price at the pump.
We assume in this report an average fuel price elasticity of demand of -0.313. The
fuel price elasticities in academic studies typically range from -0.1 to -0.5. The result
depends on the purpose of travel, the largest elasticity being -0.79 for long distance
holiday travel. This is an outlier which hasn’t influenced the average calculation but
is included to show just how price sensitive long-distance holiday travel can be.
The higher elasticity of -0.79 for long distance holiday traffic would imply over 10%
more car trips for this purpose as a direct result of the decision to freeze fuel duty.
This is one reason why long distant train operators such as Virgin East Coast
experienced much lower growth in rail travel than they had forecast. Long distance
holiday car trips are one of their major competitors!
The result of seven years of fuel duty freezes is that the price of fuel at the pump is
13% lower than it would otherwise have been. Applying the average fuel price
elasticity of demand for road transport, this means that the freeze in fuel duty has
resulted in almost 4% more road traffic with the all the additional congestion and
pollution associated with it.
12 Office for National Statistics 2017 RPI All Items: Percentage change over 12 months.
13 Pat Dunkerley, Charlene Rohr and Andrew Daly, RAND Europe 2014, Road traffic demand elasticities- A
rapid evidence assessment,
72.2 Impact on rail and bus patronage
Cheaper fuel costs boost demand for car travel and reduce demand for rail and bus
travel. This is defined by economists as “cross elasticity of demand”. The cross
elasticity of demand between the cost of motoring and demand for rail and bus is
between 0.1 and 0.314. This means the 13% reduction in fuel costs as a result of the
freeze in fuel duty would lead to an average fall in demand for rail and bus of
between 1.3% and 3.9%.
The former chief transport economist at DfT, Professor Tom Worsley, deployed the
cross elasticity of demand figure of 0.25 in his research into rail demand forecasting:
“Prior to the freeze in fuel duty rising car fuel costs had been contributing to increase
in rail patronage. Car fuel costs increased by 24% between 2007 and 2010 and this
would account for growth in rail patronage of around 6% over the three years
2007/8-2010/11, a period during which actual rail patronage growth was 16%.
It would appear that the increase in car fuel costs explain around a third of the
growth in rail patronage between 2007/8 and 2010/11. Changes in car journey times
also have an impact on rail demand although, when compared to fuel costs, such
changes tend to be small over a short period. Data on traffic speeds since 2007
shows a slight increase in speed, which might offset some of the transfer from car
accounted for by higher fuel costs. Changes in fuel costs explain around a third of
the change in rail patronage”.15
The fall in the real price of fuel at the pump is one factor which can explain the
slowdown in rail patronage growth in recent years.
The lower cost of fuel at the pump as a result of fuel duty declining in real terms has
had a direct impact on rail patronage. It is one reason to explain the sluggish rail
patronage growth since 2014 and then the 1% decline in rail patronage for the last
quarter of 201716
If we apply the 0.25 cross elasticity of demand17, then the 13% fall in the real price of
fuel resulting from fuel duty being frozen has led to a 3.25% fall in rail use.
As the result of the freeze in fuel duty since 2011, public transport usage has
decreased by between 1.3% and 3.9% causing there to be 60 million fewer rail
journeys and 200 million fewer bus journeys over the period since 2011.18
Urban areas
The problem with using average elasticity estimates is that they disguise significant
variations for different journeys. In rural areas where public transport is often not a
14 Tom Worsley, 2012, Rail Demand Forecasting
15 Tom Worsley, 2012, Rail Demand Forecasting
16 ORR, National Rail Trends, 2018
17 Rail demand forecasting using the passenger demand forecasting handbook On the Move Supporting Paper 2.
Tom Worsley Dec 2012
18 Rail Statistics – Gov.uk (2016) Bus Statistics – Gov.uk (2018)
8viable option the cross elastics of demand between car and public transport is much
lower. Changes in the cost of motoring therefore will have little impact on public
transport use.
However, in urban areas the market is more competitive between car and public
transport. This is reflected in higher cross elasticity of demand estimates with one
study stating they were as high as 0.59 for rail and 0.55 for bus19.
If we use these higher cross elasticities between car costs and rail and bus demand,
then the 13% fall in fuel costs resulting from fuel duty being frozen would lead to a
7.65% fall in rail use and a 7.15% fall in bus use.
In urban areas, public transport use is remarkably sensitive to car costs, but car use
is much less dependent on public transport costs. This reflects differences in market
shares of public and private transport: a small percentage change in car travel can
amount to a large percentage change public transport use.
However, we need to qualify the above estimates with an acknowledgement that
more car traffic results in more road congestion. Whilst this makes rail travel more
attractive it is bad for bus travel as buses suffer more from congestion than any other
mode of transport. In urban areas bus speeds have been falling by an average of
10% every decade with the downward trend accelerating in recent years. For every
10% increase in road congestion there is a 10-14% fall in bus patronage20.
2.3 Increased levels of pollution and congestion
The seven-year freeze in fuel duty means that the volume of traffic is 4% greater
than it would otherwise have been.
This has resulted in an additional 4.5 million tonnes of CO2, including 2.8 million
tonnes from the increase in car traffic, and 1.7 million tonnes from the increase in
lorries and vans. The increased volume of traffic has also produced an additional 12
thousand tonnes of NOx and 816 tonnes of PM10s vans21.
This assumes a direct correlation between car traffic volumes and CO2, i.e. a 4%
increase in car traffic results in a 4% increase in CO2. But this underestimates the
increase in CO2 as the extra traffic increases congestion and slower traffic speeds
increases emissions per vehicle km. Emissions from road traffic are increased by
approximately 40% as a result of congestion22.
19 Wardman 1997: Institute of Transport Studies, University of Leeds: referenced in: “The demand for public
transport: The effects of fares, quality of service, income and car ownership”, University of Leeds
Paulley, Balcombe, Mackett, Et al. (2006).
20 Prof David Begg, report for Greener Journeys 2016, The Impact of Congestion on Bus Passengers
21.Calculations based on data from Office for National Statistics, Environmental Accounts: November 2017
22 Bath and Boriboonsomin, 2008
9The increased volume of traffic has led to worsening congestion. Excess traffic is
the main cause of congestion. TfL estimate that 75% of traffic congestion is caused
by excess traffic with only 7% down to road works23.
Not only has the increased volume of led to worsening congestion, congestion itself
has further exacerbated levels of pollution. In nose-to-tail traffic, tailpipe emissions
are three to four times greater than they are in free flow traffic24.
Whilst it is difficult to quantify the precise correlation between the freeze in fuel duty
and increased levels of congestion, there is no doubt that the freeze contributes to
an overall trend of worsening congestion and pollution.
Urban traffic speeds are falling by on average 2% every year25, causing both
congestion and pollution to rise. Halving average city traffic speeds leads to a 50%
increase in NOx emissions from larger vehicles26.
Traffic congestion in the UK's largest cities is 14% worse than it was five years ago,
and in the last year alone has deteriorated by 4%27. Falling traffic speeds drastically
worsen air quality. Morning peak traffic average speeds in central London for
example have fallen from 16 kmph in 2006 to 12 kmph in 201628, causing a 10%
increase in NOx from diesel cars and vans, and a 25% and 27% increase for buses
and trucks.
2.4 Social equity implications
Approximately 4.9% of households total expenditure goes on vehicle fuel. It is often
claimed that the poorest are hit most by fuel duty, yet expenditure on fuel accounts
for only 3% of expenditure by households in the lowest income decile. This
compares with 5.9% for households in the 8th and 9th income deciles29.
People on lowest incomes are less likely to own a car and more likely to depend on
bus travel. There are also serious health impacts arising from car travel. Research
by the University of Surrey shows that drivers commuting in diesel cars produce six
times as much pollution as the average bus passenger, yet bus passengers suffer
far more from pollution in our cities than those travelling in cars30.
The research from the University of Surrey shows that bus passengers are
disproportionately affected by particulates (PMs), ultrafine particles (PNCs) and
black carbon (BCs) compared with motorists, yet motorists are responsible for more
of these pollutants per passenger journey than bus passengers. This is a clear
23 Travel in London Report 9, Transport for London 2016
24 Environmental Factors in Intelligent Transport Systems, IEE Proceedings, M.C. Bell 2006
25 Department for Transport Congestion Statistics 2017
26 Low Carbon Vehicle Partnership, 2017
27 TomTom June 2016
28 Travel in London Report 9, Transport for London 2016
29 Institute of Fiscal Studies, 2017
30 Environment International Today, University of Surrey 2017
10violation of the core principle of environmental justice: those who contribute the most
to air pollution in our cities are the least likely to suffer.
2.4 Reduced income for the Treasury
Chancellor Philip Hammond has described the freeze on fuel duty as a ‘fiscally
expensive’ measure which was delivered to ease the financial pressure on families31.
The freeze on fuel duty cost the Treasury around £7 billion in lost tax revenue in
201732. Since 2011 through to 2018/19 the freeze has cost the Treasury around £46
billion in lost tax revenues33. In 2000 fuel duty represented 2.3% of GDP but today
with eight years of fuel duty being frozen it represents only 1.5% of GDP.
Reduced tax receipts are not the only direct cost to the Treasury. Premiums paid to
DfT have fallen on profitable rail franchises and subsidies have increased on loss
making ones a result of the freeze on fuel duty.
Electric Vehicles pose a fiscal and congestion threat
The Government plans to phase out sale of petrol and diesel cars by 2040 (2030 in
Scotland). The Committee on Climate Change have forecast that 60% of new cars
will be electric by 2030. The impact electric vehicles will have on Government
finances, traffic volumes and congestion will be significant unless a new way to pay
for road use is introduced.
The National Infrastructure Commission notes that whilst “new vehicles will be
cleaner and safer, they will not solve the congestion problem. In fact, if driving is
cheaper and more attractive they will make congestion worse.”34
31 Chancellor Philip Hammond evidence to Treasury Select Committee, 25th April 2018
32 Source: OBR 2017
33
HM Treasury, June 2017
34 Congestion, Capacity, Carbon: Priorities for National Infrastructure, National Infrastructure Commission
October 2017
113. GETTING THE PRICE SIGNALS RIGHT
If the pricing of road use does not cover external costs, road space is over
consumed creating congestion, pollution and all the associated economic,
social and health costs. Government must send the right price signals to road
users and incentivize a switch from car to more sustainable transport.
The impact electric vehicles will have on Government finances and traffic
volumes will be serious unless a new way to pay for road use is introduced.
Whilst this has hitherto been too challenging politically, the advent of
autonomous vehicles presents a window of opportunity to introduce a new
way of paying for road use.
3.1 Government intends to increase fuel duty in 2019/20
The Government has stated that from the financial year 2019/20 fuel duty will be
uprated each year in line with the growth in the RPI. Given the Government’s track
record on postponing or cancelling increases in fuel duty in line with inflation there
must be a question mark about whether they will deliver on this commitment. This is
a concern that is shared by the OBR35
It is vitally important that Government delivers on this commitment as a minimum if it
is to send the right price signals to road users and begin to tackle some of the most
serious externalities: pollution and congestion.
3.2 Impact on public finances of cleaner vehicles.
The Government plans to phase out sale of petrol and diesel cars by 2040 (2030 in
Scotland). The Committee on Climate Change have forecast that 60% of new cars
will be electric by 2030.
35 OBR 2017 in Budget 2011, the Government cancelled the pre-existing fuel duty escalator (where fuel duty
rates were due to rise in line with RPI inflation plus a penny a litre in every year until 2014-15). The rate was
also cut by one pence a litre in April 2011. The April 2011 RPI rise was delayed until January 2012 and the
April 2012 rise was delayed until August 2012;
• in Autumn Statement 2011, it delayed the planned January 2012 RPI rise until August 2012– thereby
planning a rise before the next Autumn Statement;
• in June 2012, it delayed the planned August 2012 RPI rise until January 2013;
• in Autumn Statement 2012, it cancelled the planned January 2013 RPI rise and pushed back each
subsequent year’s April RPI rises until the end of the Parliament to September;
• in Budget 2013, it cancelled the planned September 2013 RPI rise;
• in Autumn 2014, it cancelled the planned September 2014 RPI rise;
• in Budget 2015, it cancelled the planned September 2015 RPI rise;
• in Budget 2016, it cancelled the planned April 2016 RPI rise; and
• in this Autumn Statement, the Government has cancelled the planned April 2017 RPI rise.
12The Office for Budget Responsibility (OBR) forecast that by 2029/30 fuel duty will
make up only 1.1% of GDP compared to 1.7% today. For VED, the figures are 0.1%
and 0.3% respectively.
The total decline in motoring taxes is equivalent to £13.2 billion a year in today’s
terms. This is roughly the revenue generated by increasing the basic rate of income
tax from 20p to 23.4p, increasing VAT from 20% to 22.7%, or increasing fuel duty by
more than 50%36
3.3 Projected increase in traffic volumes
Electric vehicles currently pay no tax on running costs, other than VAT on electricity
consumed, and are exempt from Vehicle Excise Duty. The fuel/energy costs of
running a petrol car are 14.55p per mile, compared to just 0.03p per mile for running
an electric car37.
This fall in the cost of running a car will result in an increase in traffic (vehicle
kilometres) of around 30% when the car fleet is electric [See Appendix I: Projected
growth in traffic calculation].
This 30% estimate is in addition to the 40% growth in traffic predicted by DfT by
203538, leading to an overall increase in traffic of around 70%.
While electric vehicles provide a solution to our air quality challenges, depending on
how the electricity is generated, they will significantly exacerbate our congestion
problem in the absence of introducing a new way to pay for road use.
3.4 Disruptive technologies and trends
The exponential growth in online shopping has led to a proliferation in the number of
delivery vehicles on the road. We need to make much more use of the road network
for the movement of freight and parcels when it is less busy. This includes evenings
and through the night.
Uber and other private hire vehicle (PHV) apps bring benefits to the consumer in
terms of cheaper rides and easier access. However, there is a tipping point when the
sheer numbers of new PHV registrations adds significantly to congestion levels.
This needs to be managed.
Department for Transport has forecast that the vehicle fleet will be all electric by
2050. Unless a way is found to ensure that electric vehicles pay for road
infrastructure then these costs will be borne by the taxpayer. This will expose
serious equity and fairness issues.
36 Institute of Fiscal Studies: “Fuel for Thought, The what, why and how of motoring taxation” May 2012
37 AA: Motoring Costs 2014 and pod-point.com
38 DfT Road Traffic Forecast 2017
13Autonomous Vehicles (A.V.s) will make it more appealing for passengers to spend
longer travelling as they can be more productive if they don't have to be attentive at
the wheel of the vehicle. Average journey length could increase significantly with
A.V.s. Congestion consequences will be drastic if Government does not take action.
3.5 Increasing road capacity
There is a widespread assumption that congestion is primarily a supply side problem
with too little of the tax paid by road users being used to pay for more and better
maintained road capacity.
However, while there is a strong case for more capacity where the investment case
is justified, 80% of the U.K.'s congestion is in urban conurbations and 40% is in
Greater London alone39. Increasing road capacity in urban areas is challenging to
say the least.
There is little appetite for demolishing residential dwellings or to tarmac over what
little green space there is. The pressure now, and in the future, is how to make our
cities more people friendly by reallocating road space from the movement of people
and goods to exchange/people space40. This has already happened in London,
which is one of the reasons why congestion in the capital has become so acute in
recent years. Even where we can increase road capacity, without a fair and efficient
charging system it will fill up too quickly.
The central problem we face is inefficient use of road capacity. Car occupancy rates
languish at around 1.2 per vehicle; roads are sparsely used for large parts of a 24-
hour cycle; freight and parcels are too often delivered when the road network is busy
rather than quiet; taxi's and private hire vehicles (PHVs) are more expensive to hire
when the roads are least busy.
It is difficult to think of any other sectors where we are making as inefficient use of a
scarce resource as we do with road space. The priority must be to tackle inefficiency
and not just reach for the capacity lever.
3.6 Changing how we pay for road use
Politically it will be very challenging for Government to impose a compulsory change
in how we pay for road use. However, the advent of autonomous vehicles (A.V.s)
offers the opportunity to make a change in how we pay for road use voluntary.
If road users want to deploy their vehicle in fully autonomous mode, not only should
they satisfy the authorities on safety issues, they should also agree to pay for road
infrastructure and congestion costs through road pricing. The desire to operate
vehicles in autonomous mode will be strong enough for many to accept the condition
39 Commission for Integrated Transport, Paying for Road use, 2002
40 Mayor of London's Roads Task Force 2015
14that they pay differently for road use. This is a one-off opportunity to get the public to
adopt change.
Moreover, there is a widely recognized risk that artificial intelligence will increase
unemployment and that we should tax artificial intelligence to create a more level
playing field for organisations which employ people. A.V.s will eliminate millions of
driving jobs. It would be unfair if companies were to continue to pay tax on their
employees (such as employers NI contributions) while companies operating A.V.s
pay nothing.
With regards electric vehicles, the Office for Road and Rail Regulation(ORR) should
be given an objective of incentivising take up but setting out a longer-term strategy to
ensure that eventually they pay for electric charging, road infrastructure and
congestion costs. The first two would be distance based and the latter time based.
We need to pass a tipping point where electric vehicles are price competitive and
take up would not be discouraged by charging for infrastructure and congestion.
We need to avoid the criticism government has faced on diesel where take up was
encouraged and incentivised and the public purchased diesel vehicles on good faith.
The ORR would need to set out a longer-term pricing strategy, in the same way that
the Bank of England gives warnings that interest rates will not always be low, to
prevent the public from taking on affordable debt when interest rates rise.
155. CONCLUSION & RECOMMENDATIONS
Increasing costs on road users is politically difficult. However, it is vitally important
that Government creates the right price signals if we are to reduce congestion and
pollution and create a more equitable society.
While the freeze in fuel duty has been welcomed by many road users there have
been unintended consequences in terms of growth in traffic; decline in rail and bus
patronage; increased levels of pollution; and, reduced income for the Treasury. As a
minimum, Government must honour its commitment to increase fuel duty in line with
inflation at the next Budget.
Government also needs to ensure that innovations and disruptive technologies work
in society’s interests and do not exacerbate congestion. The impact electric vehicles
will have on Government finances and traffic volumes will be severe unless a new
way to pay for road use is introduced. The move to autonomous vehicles presents a
window of opportunity to move to a new model for paying for road use.
RECOMMENDATIONS
1. Government to honour its commitment to increase fuel duty at least in line
with inflation at next Budget
2. Policies to encourage modal switch from car to public transport, walking
and cycling.
3. Government to move to a new model for paying for road use
16APPENDIX I – Marginal external costs and taxes paid by road users
(pence per km)
Department for Transport research in 2010 showed that road users failed by a
considerable margin to cover their external costs:
Year Congestion Environment /Safety Fuel Duty + VAT Uncovered Costs
2000 7.3 2.2 5.2 4.3
2010 12.3 1.6 3.9 10.1
A few things to note from this research. The pence per km raised from fuel duty and
VAT fell by one third between 2000 and 2010 as a result of more fuel-efficient
vehicles. We can expect this trend to accentuate as the vehicle fleet becomes
increasingly more fuel efficient and we move to zero emissions with electric vehicles.
There is a shortfall of 10 pence per km on what road users should be paying if they
were to cover their external costs. Note how the shortfall more than doubled over
the decade. Whilst fuel efficient vehicles reduce both environmental cost and fuel
duty paid they do nothing to tackle congestion.
17APPENDIX II – Projected growth in traffic calculation
If Government doesn’t introduce a new way for paying for road use the average
fuel/energy costs of running a car will fall from 14.55p per mile to 0.03p per mile41.
This fall in the cost of running a car will result in an increase in traffic (vehicle
kilometres) of around 30% when the car fleet is electric.
This calculation is based solely on the change in fuel/energy costs of electric cars
versus petrol cars. It is based on an averagely priced petrol car £18,000-£25,000
on a mileage of 15,000 p.a.42
The price elasticity of demand for fuel used in this calculation is -0.3. This is an
average of the range of elasticities -0.1 to -0.543.
While electric cars are currently more expensive to purchase than petrol and diesel
cars, and there is doubt about their battery life and the cost of replacement, this will
change as technology advances.
“As we scale up production E.V.s are going to become cheaper and we expect
battery costs are going to fall”44.
41 AA: Motoring Costs 2017 and pod-point.com
42 AA: Motoring Costs 2017
43 Study for DFT: Road Traffic elasticities -A rapid evidence assessment, Dunkerley, Rohr and Daly, 2014
44 Tate and Palmer, Journal of Applied Energy, University of Leeds, 2017
18You can also read