Modelling the lateral distribution of ship traffic in traffic separation schemes

Page created by Alfredo Cruz
 
CONTINUE READING
Modelling the lateral distribution of ship traffic in traffic separation schemes
Scientific Journals                                                                                          Zeszyty Naukowe
of the Maritime University of Szczecin                                                      Akademii Morskiej w Szczecinie
2018, 53 (125), 81–89
ISSN 1733-8670 (Printed)                                                                                         Received: 24.10.2017
ISSN 2392-0378 (Online)                                                                                          Accepted: 26.02.2018
DOI: 10.17402/269                                                                                                Published: 16.03.2018

Modelling the lateral distribution of ship
traffic in traffic separation schemes

          Agnieszka Nowy, Lucjan Gucma
          Maritime University of Szczecin
          1–2 Wały Chrobrego St., 70-500 Szczecin, Poland
          e-mail: {a.nowy; l.gucma}@am.szczecin.pl
          
            corresponding author

          Key words: vessel traffic streams, ships’ traffic flow, safety of navigation, probabilistic model, traffic separa-
          tion scheme, modelling
          Abstract
          This paper presents the method used for the creation of ship traffic models in Southern Baltic Traffic Separation
          Schemes (TSS). The analysis of ship traffic was performed by means of statistical methods with the use of his-
          torical AIS data. The paper presents probabilistic models of ship traffic’s spatial distribution and its parameters.
          The results showed that there is a correlation between the standard deviation of traffic flow and TSS lane width
          that can be used in practical applications to ensure the safety of navigation; improve navigation efficiency, safe-
          ty and risk analysis in given area, and for the creation of a general model of ship traffic flow.

Introduction                                                           Studies on the most adequate probability distribu-
                                                                       tion function for the position of a ship were con-
    A proper understanding of traffic stream                           ducted on restricted waters (Iribarren, 1999). The
behaviour is necessary for risk analysis and efficient                 author proposed the use of Weibull, Rayleigh or
design of sea routes and traffic facilities. Research                  Gaussian type distributions to describe the location
work on ship traffic analysis has been conducted for                   of a ship on the.
many years. These analyses were limited by insuf-                          Using radar data, offshore collision risk studies
ficient sample size, position accuracy ship course                     were performed. One of the conclusions was the
and speed accuracy resulting from the need for                         correlation between standard deviation and route
expensive measuring equipment and data collection                      length (Haugen, 1991). Prediction of ship traffic dis-
equipment. An additional problem was the difficulty                    tribution is widely used to calculate the number of
of obtaining data for all ships in the area. New capa-                 encounters in cross-traffic lanes. Pedersen (Peders-
bilities emerged with the AIS (Automatic Identifi-                     en, 2002) introduced a model to calculate the colli-
cation System) which enables not only vessel traffic                   sion risk in a congested shipping lane and to investi-
monitoring but also studies on the basic processes                     gate the distribution of different categories of traffic.
that govern the movement of vessels in a given area.                       Using AIS data, it is possible to conduct more
    The research on traffic flow is conducted in terms                 investigations on the actual behaviour of vessels.
of risk analysis. Early models assumed the random                      Numerous collision risk and traffic studies have been
spatial distribution of ships and the same speed for                   conducted in the past few years. A model introduced
each ship without regard for the vessel type (Fuji,                    by Goerlandt and Kujala (Goerlandt & Kujala, 2010)
Yamanouchi & Mizuki, 1974; MacDuff, 1974). In                          was based on a dynamic extensive microsimulation
coastal areas, a normal and uniform distribution                       of maritime traffic using the Monte Carlo simulation
was used as the theoretical distribution (Fuji, 1977).                 technique in a given area. Detailed studies on vessel

Zeszyty Naukowe Akademii Morskiej w Szczecinie 53 (125)                                                                            81
Agnieszka Nowy, Lucjan Gucma

traffic statistics were conducted. The important fac-       (Gucma, Ślączka & Zalewski, 2013). Characteristic
tor used in the model was the daily variation in traf-      sections are based on:
fic (Montewka et al., 2011); however, that factor can       • parameters of the individual section (available
be applied to particular areas only.                           depth and width);
    A number of studies have been performed in cer-         • type of manoeuvres performed in these sections;
tain waters including the Gulf of Finland (Montew-          • hydrometeorological conditions prevailing in
ka et al., 2011), Japan Strait (Yamaguchi & Sakaki,            these sections;
1971) and Adriatic (Lušić, Pušić & Medić, 2017).            • type of aids to navigation in each section.
Traffic flow in the Istanbul Strait was analysed to             To define the width of a sea waterway, ship traffic
improve the safety of navigation (Aydogdu et al.,           flow has to be investigated.
2012). Using AIS data, statistical analysis of marine           The ship traffic along a definite route is con-
traffic patterns and a risk of collision model off the      sidered to be a process affected by numerous
coast of Portugal have been developed (Silveira,            factors that change with time, as well as the route
Teixeira & Guedes Soares, 2013).                            length and type. These factors make the traffic a ran-
    A lot of research on maritime traffic flow was          dom process and probabilistic methods are used for
conducted by Chinese colleagues (Feng, 2013; Wen            its description.
et al., 2015; Liu et al., 2017). A mathematical model           One of the main parameters describing the traf-
was initially developed using classical traffic flow        fic flow is the spatial distribution, describing the
theories (Yip, 2013). The combination of an inte-           ship’s hull position relative to the axis of the track.
grated bridge system with a microcosmic cellular            In ship traffic modelling it is common practice to
automata (CA) model was proposed to simulate the            model transverse ship traffic distribution by a nor-
vessel traffic flow by taking the ship identity, type,      mal distribution (Guziewicz, 1996; Iribaren, 1999;
position, course, speed and navigation status into          Gucma, 1999). This is based on the assumption that
account (Feng, 2013). A cellular automaton mod-             most ships try to follow the official route as close
el that provides the basis for simulation and vessel        as possible and are thus normally distributed across
traffic management was developed (Blokus-Rosz-              the route. These assumptions, however, do not fully
kowska & Smolarek, 2014). Another approach is to            describe the behaviour of the traffic. Transverse dis-
model ship traffic flow in the context of concept drift     tribution of ship traffic depends largely on the type
(Osekowska, Johnson & Carlsson, 2017) where the             of route (bend, straight) and its character (Traffic
fluctuations of traffic relative to time are subject to     Separation Scheme, narrow channel etc). Prelimi-
studies.                                                    nary research on traffic flow in the Southern Baltic
    This article presents studies on traffic streams in     Sea shows that the centre of gravity of a ship relative
the TSS to develop a general mathematical model of          to a given route can be modelled by a number of dis-
vessel traffic flows by using the distance to danger as     tributions. The most common distributions are the
one of the main factors influencing the spatial distri-     normal distribution, logarithmic distribution, gam-
bution of ships. The calculations are performed par-        ma distribution, logistic distribution and Weibull
tially with the mathematical software tool IWRAP            distribution.
MK2 recommended by IALA. AIS data are used for                  The following step is to describe the standard
the studies. Results for the TSS in the Baltic Sea are      deviation (SD), σ, of ship traffic flow. Studies on this
presented.                                                  topic carried out on the Baltic Sea (real traffic) and
                                                            on the restricted area (simulation studies) lead to the
Spatial ships traffic model                                 assumption that the standard deviation of ship traffic
                                                            is mostly dependent on the distance to danger and
    A system of sea waterways from the marine traf-         size of ships (Gucma, Perkovic & Przywarty, 2009).
fic engineering perspective consists of a number of         The following relationship can be used to define the
separate sections. Each waterway section features           standard deviation of ship routes:
two basic components: a waterway subsystem and
                                                                                     σ = aD + b                          (1)
a ship position determination system (navigational
subsystem) (Gucma, 2013).                                   where: a and b are coefficients of regression, D is
    The stage preceding the optimisation of the             the distance to navigational danger (safety contour,
parameters of the sea waterway system determines            boundary of traffic lane).
the conditions for safe operation of the system                In the above formula, the coefficient a is depen-
and divides the waterway into distinctive sections          dent on the ship’s length (L).

82                                                        Scientific Journals of the Maritime University of Szczecin 53 (125)
Modelling the lateral distribution of ship traffic in traffic separation schemes

   To create a model for ship route design, different                at as small an angle to the general direction of traffic
types of waterways and ship types and dimensions                     flow as practicable.
(L, T) should be considered. The studies present-                        The authors analysed the movement of ships in
ed in this paper relate to TSSs where the boundary                   the following TSSs established in the Baltic Sea
of the traffic lane can be considered as a “virtual                  (Figure 1):
danger”.                                                             1) TSS Adlergrund;
   In most maritime traffic engineering applica-                     2) TSS North of Rugen;
tions where a ship is travelling on a given route with               3) TSS Bornholmsgat;
coordinate y = 0, the distribution of the ship’s hull                4) TSS Słupska Bank;
position relative to the axis of the lane can be trans-              5) TSS in the Gulf of Gdańsk;
formed into a conditional distribution of the condi-                 6) TSS Midsjöbankarna;
tion x1 < X < x2, where x1 and x2 are considered to                  7) TSS South Hoburgs Bank.
be the section range (Gucma, 2006). The cumulative
distribution function is presented in the form:
           FY|X (y, x) = P(Y ≤ y|x1 < X < x2)              (2)
where X and Y give the vessel’s position coordinates
in relation to the track axis.
    This distribution can be used in a simple way to
calculate the probability of a safe waterway cross-
ing/exit, PC, of the boundary line in position Xi as
(Gucma, 2006):
                                                                     Figure 1. Analysed TSSs in the Baltic Sea (picture made by
                     PC  1  FY X  X1                    (3)       IWRAP MK2 software, v5.2.0BETA)

                                                                     Data
Methods
Study area                                                               Research has been conducted on the basis of data
                                                                     collected from AIS obtained from the Polish Mari-
    The Baltic Sea has relatively dense traffic. There               time Administration. Vessel traffic was analysed
are a number of traffic separation schemes estab-                    using data from March to May 2017. The two largest
lished and adopted by the International Maritime                     groups of ships, general cargo (GC) and oil product
Organization (IMO) in the Baltic Sea. These are                      tanker (OPT),were considered to be the most com-
commonly used in areas difficult to navigate where                   mon in the given area.
corridors for shipping are narrow and winding. The                       AIS raw data was processed using the IWRAP
reason for this is to enhance the safety of naviga-                  MK2 application. IWRAP is a modelling tool use-
tion and the protection of the marine environment in                 ful for maritime risk assessment. Using IWRAP, the
most of the major congested shipping areas.                          frequency of collisions and groundings in a given
    There are regulations specifically established for               waterway, based on information about traffic vol-
traffic separation schemes. Rule 10 of the COLREGs                   ume/composition and route geometry, can be esti-
(Convention, 1972) precisely describes how naviga-                   mated (Engberg, 2016). The statistical function can
tors should behave when they navigate through TSSs                   be found using historical AIS data. The traffic pat-
adopted by the IMO. It can be assumed that the edge                  terns are illustrated in a density plot, which helps to
of the traffic lane is a virtual boundary for the vessel.            identify the location of navigational routes (legs).
Crossing of this lane/boundary does not pose a direct                Making a cross-section of the leg and creating a his-
risk of collision or grounding but navigation in TSSs                togram for each direction, the mathematical repre-
gives a good overview of a navigator’s behaviour on                  sentation using a number of probability functions is
limited waters. According to Rule 10 of COLREG,                      prepared.
the ships should proceed in the appropriate traffic
lane in the general direction of traffic flow for that               Statistical model of the spatial
                                                                     distribution of ship traffic streams
lane; so far as practicable to keep clear of a traffic
separation line or separation zone; normally join or                     The theory of traffic flow of ships involved
leave a traffic lane at the termination of the lane, but             describes the movement of many vessels through the
when joining or leaving from either side shall do so                 traffic lane in the some chosen period of time. One of

Zeszyty Naukowe Akademii Morskiej w Szczecinie 53 (125)                                                                     83
Agnieszka Nowy, Lucjan Gucma

the main parameters describing the traffic flow is the           between the empirical distribution and the theoret-
distribution, describing the ship’s hull position rel-           ical distribution. The hypothesis is that there is no
ative to the axis of the track. Information about the            significant difference between those distributions.
position of the vessel’s centre of gravity and course            The confidence level (answering the question “what
is used to define the distribution. A simple approach            is significant?”) is set at 95%. Also, Kolmogorov–
to describing traffic streams is their characterisa-             Smirinov and Anderson–Darling tests have been
tion by means of a single, specific resolution. This             performed. The K–S statistic and A–D statistic do
research consisted mainly of matching the distribu-              not require binning. But unlike the K–S statistic,
tion of traffic in relation to the axis and obtaining the        which focuses on the middle of the distribution, the
mean and standard deviation of the traffic lane for              A–D statistic highlights differences between the tails
two groups of ships.                                             of the fitted distribution and input data. Also, Akaike
    For each TSS, the centre of the traffic lane was             Information Criterion (AIC) and Bayesian Infor-
established. To describe changes in traffic flow, each           mation Criterion (BIC) were taken into account.
lane has been divided into the number of sections,               The AIC and BIC statistics are calculated from
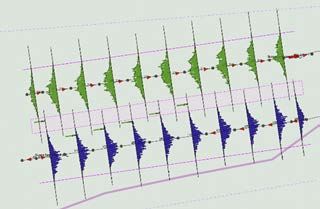
each section of 1 Nm wide (Figure 2). For subse-                 the log-likelihood function and take into account
quent sections, lateral distributions were determined            the number of parameters of the fitted distribution
by analysing the number of ship crossings of report              (Dziak et al., 2012). The P-P (Probability-Probabili-
lines perpendicular to each route.                               ty) graph plots the p-value of the fitted distribution
                                                                 versus the p-value of the input data. If the fit is good,
                                                                 the plot will be nearly linear (Figure 3c and 4c).
                                                                     Studies have shown that the distribution of
                                                                 a ship’s position in relation to the centre of the traffic
                                                                 lane is not right-sided or centrally located in rela-
                                                                 tion to the track axis. Figures 5a and 5b show that
                                                                 ship positions are located port from the centre of the
                                                                 track. The results relate both type of TSSs: with and
                                                                 without separation zones. Such distributions show
                                                                 that the navigators move away from the centre of
                                                                 the lane; for general cargo vessels, this deviation is
                                                                 significant.
                                                                     In a further step, the mean and standard devia-
Figure 2. TSS Slupska Bank, West part. Lanes divided into
sections, with section histograms, for general cargo vessels     tion of the lateral distribution for each section were
(picture made by IWRAP software)                                 determined. In Figures 6a and 6b, example results
                                                                 for TSS Slupska Bank “West” are shown.
    In a further step, the mean and standard deviation               It can be seen that there is a difference between
of the lateral distribution for each section were deter-         the mean and standard deviation for the two chosen
mined. The aim of the study was to find a relation-              groups of ships. For S_lane, differences in the first
ship between this standard deviation and the width               sections for SD are approximately 100 m, but in the
of the traffic lane.                                             following sections it decreases to 10 m. For N_lane,
                                                                 the differences are comparable for all sections of the
Results                                                          track (60 m to over 100 m). In the same way, the
                                                                 means of the lateral distribution can be compared.
    Figures 3a and 4a show examples of spatial dis-              This shows that the type of ship is a factor affecting
tributions, derived from the empirical data collected            the distribution of a vessel’s position in relation to
in a certain section. On the X-axis, a value of zero             the track axis.
correspondents to the middle of the traffic lane.                    Consequently, it was decided to compare these
A positive value for X means that the vessel sails               two groups and to check whether there was a statisti-
more to the starboard side.                                      cally significant difference in the results.
    Transverse ship traffic distribution can be mod-                 To compare two independent groups in terms
elled by different distributions. This is necessary to           of quotient variables, a Mann-Whitney U test was
calculate collision probability. Their goodness of fit           performed. Significant differences at p < 0.05 are
is first determined by performing a Chi-square test              marked by “*”. If p is less than 0.050 then the differ-
(χ2). This test determines the degree of agreement               ence between general cargo vessels and oil product

84                                                             Scientific Journals of the Maritime University of Szczecin 53 (125)
Modelling the lateral distribution of ship traffic in traffic separation schemes

a)                                            Fit Comparison for Distance from center                                                  a)                                              Fit Comparison for Distance from center
                                               BetaGeneral(10.167;5.3953;–2347.8;1993)                                                                                                                    Logistic(247.99;217.64)
                                                                   5.0%              90.0%             5.0%                                                                                                     5.0%               90.0%               5.0%
                                                                   6.5%              87.9%             5.6%                                                                                                     2.4%               90.7%               6.8%
                                                                –325                                       1251                                                                                              –555                                        817
                         9                                                                                                                                         14

                         8
                                                                                                                                                                   12
                         7
                                                                                                                                                                   10

                                                                                                                                       Probability Density,
Probability Density,

                         6

                                                                                                                                          Values × 10–4
   Values × 10–4

                         5                                                                                                                                          8

                         4                                                                                                                                          6
                         3
                                                                                                                                                                    4
                         2
                                                                                                                                                                    2
                         1

                         0                                                                                                                                          0

                                                                                                                                                                    –2000

                                                                                                                                                                                  –1500

                                                                                                                                                                                                   –1000

                                                                                                                                                                                                                  –500

                                                                                                                                                                                                                               0

                                                                                                                                                                                                                                            500

                                                                                                                                                                                                                                                            1000

                                                                                                                                                                                                                                                                     1500
                             –2000

                                      –1500

                                                  –1000

                                                                 –500

                                                                              0

                                                                                        500

                                                                                                    1000

                                                                                                                  1500

                                                                                                                           2000
                                                            Distance from center [m]                                                                                                                       Distance from center [m]

b)                                                    Fit Comparison-Probability                                                       b)                                                        Fit Comparison-Probability
                                              BetaGeneral(10.167;5.3953;–2347.8;1993)                                                                                                                Logistic(247.99;217.64)
                                              5.0%                                  90.0%                          5.0%                                                                   5.0%                                 90.0%                        5.0%
                                              6.5%                                  87.9%                          5.6%                                                                   2.4%                                 90.7%                        6.8%
                                                                –325                                1251                                                                                                    –555                                 817
                       1.0                                                                                                                                    1.0

                       0.8                                                                                                                                    0.8

                       0.6                                                                                                                                    0.6
 Probability

                                                                                                                                           Probability

                       0.4                                                                                                                                    0.4

                       0.2                                                                                                                                    0.2

                       0.0                                                                                                                                    0.0
                         –2000

                                      –1500

                                                 –1000

                                                                –500

                                                                             0

                                                                                     500

                                                                                                1000

                                                                                                                 1500

                                                                                                                          2000

                                                                                                                                                                    –2000

                                                                                                                                                                                  –1500

                                                                                                                                                                                                  –1000

                                                                                                                                                                                                                 –500

                                                                                                                                                                                                                               0

                                                                                                                                                                                                                                           500

                                                                                                                                                                                                                                                        1000

                                                                                                                                                                                                                                                                   1500
                                                           Distance from center [m]                                                                                                                       Distance from center [m]
                                     Input                  BetaGeneral                                                                                                        Input                       Logistic

c)                                   Probability-Probability Plot of Distance from center                                              c)                                      Probability-Probability Plot of Distance from center
                                                BetaGeneral(10.167;5.3953;–2347.8;1993)                                                                                                                    Logistic(247.99;217.64)
                        1.0                                                                                                                                        1.0

                        0.9                                                                                                                                        0.9
                        0.8                                                                                                                                        0.8

                        0.7                                                                                                                                        0.7

                        0.6                                                                                                                                        0.6
      Fitted p-Value

                                                                                                                                                  Fitted p-Value

                        0.5                                                                                                                                        0.5

                        0.4                                                                                                                                        0.4

                        0.3                                                                                                                                        0.3

                        0.2                                                                                                                                        0.2
                                                                                                BetaGeneral                                                                                                                                 Logistic
                        0.1                                                                                                                                        0.1

                        0.0                                                                                                                                        0.0
                               0.0

                                      0.1

                                                0.2

                                                          0.3

                                                                       0.4

                                                                              0.5

                                                                                     0.6

                                                                                              0.7

                                                                                                           0.8

                                                                                                                    0.9

                                                                                                                          1.0

                                                                                                                                                                         0.0

                                                                                                                                                                                 0.1

                                                                                                                                                                                           0.2

                                                                                                                                                                                                     0.3

                                                                                                                                                                                                               0.4

                                                                                                                                                                                                                         0.5

                                                                                                                                                                                                                               0.6

                                                                                                                                                                                                                                       0.7

                                                                                                                                                                                                                                                  0.8

                                                                                                                                                                                                                                                            0.9

                                                                                                                                                                                                                                                                   1.0

                                                                        Input p-Value                                                                                                                            Input p-Value

Figure 3. a) Spatial distribution of ship’s hull position rela-                                                                         Figure 4. a) Spatial distribution of ship’s hull position rel-
tive to the axis of the track at one cross section; b) probabil-                                                                        ative to the axis of the track at one cross section; b) proba-
ity; c) P-P graph. Adlerground TSS. General cargo vessels                                                                               bility; c) P-P graph. Adlerground TSS. Oil product tankers

tankers within a given variable is statistically signif-                                                                                                                                      n2 n2  1
                                                                                                                                                                                       U 2  n1n2         R2           (5)
icant (Table 1).                                                                                                                                                                                   2
   The U-test statistic for the Mann-Whitney test is                                                                                                                                            nn
given by the smaller of U1 and U2 as defined below:                                                                                                                                       U1  1 2
                                                                                                                                          Z                                                      2
                                                                                                                                                                                                                         (6)
                                              U1  n1n2 
                                                                             n1 n1  1
                                                                                          R1                                    (4)
                                                                                                                                                                         n1n2 n1  n2  1
                                                                                                                                                                                            
                                                                                                                                                                                                    n1n2  t 3  t                                     
                                                                                  2                                                                                              12           12 n1  n2 n1  n2  1

Zeszyty Naukowe Akademii Morskiej w Szczecinie 53 (125)                                                                                                                                                                                                              85
Agnieszka Nowy, Lucjan Gucma

     a)                                                                 Fit Comparison for GC and OPT                                                b)                                                   Fit Comparison for GC and OPT
                                                                                    Eastbound Traffic                                                                                                                 Westbound Traffic

                                              0.0012                                                                                                                        0.0014

                                                                                                                                                                            0.0012
                                              0.0010

                                                                                                                                                                            0.0010

                                                                                                                                                      Probability Density
                                              0.0008
                    Probability Density

                                                                                                                                                                            0.0008
                                              0.0006
                                                                                                                                                                            0.0006

                                              0.0004
                                                                                                                                                                            0.0004

                                              0.0002
                                                                                                                                                                            0.0002

                                              0.0000                                                                                                                        0.0000
                                                       –2000

                                                               –1500

                                                                           –1000

                                                                                   –500

                                                                                          0

                                                                                                    500

                                                                                                              1000

                                                                                                                      1500

                                                                                                                               2000

                                                                                                                                                                                     –2000

                                                                                                                                                                                             –1500

                                                                                                                                                                                                          –1000

                                                                                                                                                                                                                  –500

                                                                                                                                                                                                                            0

                                                                                                                                                                                                                                   500

                                                                                                                                                                                                                                              1000

                                                                                                                                                                                                                                                         1500

                                                                                                                                                                                                                                                                 2000
                                                                               Distance from center [m]                                                                                                       Distance from center [m]
                                                                       Logistic OPT                       Persons GC                                                                                     Logistic OPT                     BetaGeneral GC

     Figure 5. Distribution over the waterway at one cross section. Adlerground TSS: a) eastbound traffic; b) westbound traffic

     a)                                                                                                                                              b)
                                                                TSS Słupska Bank "West"                                                                                                      TSS Słupska Bank "West"
                         650                                                                                                                         400

                                                                                                                                                     300
Standard deviation [m]

                                                                                                                          SD S_lane GC
                         600
                                                                                                                          SD N_lane GC               200                                                                                             Mean S_lane GC
                                                                                                                                                                                                                                                     Mean N_lane GC
                                                                                                                                          Mean [m]

                                                                                                                          SD S_lane OPT
                                                                                                                                                     100                                                                                             Mean S_lane OPT
                         550                                                                                              SD N_lane OPT
                                                                                                                                                                                                                                                     Mean N_lane OPT
                                                                                                                                                           0

                                                                                                                                                 –100
                         500
                                                                                                                                                 –200

                         450                                                                                                                     –300
                                          1              3             5             7          9               11                                                    1              3               5            7            9          11
                                                                Section of traffic lane                                                                                                      Section of traffic lane
     Figure 6. a) Standard deviation for general cargo (GC) vessels and oil product tankers (OPT) for subsequent sections of the
     lanes; b) Mean for general cargo (GC) vessels and oil product tankers (OPT) for subsequent sections of the lanes; SD – standard
     deviation, S_lane – eastbound vessels, N_lane – westbound vessels

     Table 1. Mann-Whitney U test results for Traffic Separation Schemes
                          Vari- Rank                                                      Sum                                                                        Vari- Rank                                            Sum
         TSS                                                                                              U           Z           p                                         TSS                                                           U          Z            p
                          able OPT                                                         GC                                                                        able OPT                                               GC
         Adlerground       M 197.0                                                        103.0       25.0        2.685       0.007*                  Gdansk „East”/  M 204.0                                              391.0     51.0       –3.203          0.001*
         Eastbound         SD 91.0                                                        209.0       13.0       –3.377       0.001*                   Southbound     SD 288.0                                             307.0    135.0       –0.310          0.757
         Adlerground       M    79.0                                                      221.0       1.0        –4.070       0.000*                  Bornholmsgat/   M 855.0                                             1098.0    359.0       –1.704          0.088
         Westbound         SD 78.0                                                        222.0        0.0       –4.128       0.000*                   Southbound     SD 706.0                                            1247.0    210.0       –3.801          0.000*
         Slupska Bank      M 341.0                                                        124.0        4.0        4.478       0.000*                  Bornholmsgat/   M 912.0                                             1041.0    416.0       –0.901          0.367
         “East”/Eastbound  SD 261.0                                                       204.0       84.0       1.1614       0.245                    Northbound     SD 524.0                                            1429.0    28.0        –6.364          0.000*
         Slupska Bank      M 106.0                                                        300.0        1.0       –4.434       0.000*                     Rugen/       M    15.0                                             40.0      0.0       –2.507          0.012*
         „East”/Westbound SD 152.0                                                        254.0       47.0       –2.320       0.020*                    Eastbound     SD 15.0                                               40.0      0.0       –2.507          0.012*
         Słupska Bank      M    55.0                                                      155.0        0.0       –3.742       0.000*                     Rugen/       M 132.0                                              121.0     55.0        0.328          0.743
         „West”/Eastbound SD 143.0                                                         67.0       12.0        2.835       0.005*                   Westbound      SD 89.0                                              164.0     23.0       –2.430          0.015*
         Słupska Bank      M 147.0                                                         63.0        8.0        3.137       0.002*                 Midsjobankarna/  M    75.0                                             61.0     25.0        0.683          0.495
         „West”/Westbound SD 155.0                                                         55.0        0.0        3.742        0.00*                    Eastbound     SD 36.0                                              100.0      0.0       –3.308          0.001*
         Gdansk„West”/     M 261.0                                                        204.0       84.0        1.161       0.245                  Midsjobankarna/  M 101.0                                               52.0      7.0        2.742          0.006*
         Northbound        SD 267.0                                                       198.0       78.0        1.410       0.158                    Westbound      SD 56.5                                              96.5     20.5        –1.443          0.149
         Gdansk „West”/    M 184.0                                                        281.0      64.0        –1.991       0.046*                  South Hoburgs   M 177.0                                              123.0     45.0        1.530          0.126
         Southbank         SD 275.0                                                       190.0       70.0        1.742       0.081                  Bank/Eastbound SD 145.0                                              155.0     67.0        –0.260          0.795
         Gdansk „East”/    M 284.0                                                        311.0      131.0       –0.448       0.654                   South Hoburgs   M 132.0                                             121.0     55.0        0.328           0.743
         Northband         SD 214.0                                                       381.0      61.0        –2.859       0.004*                 Bank/Westbound SD 89.0                                                164.0     23.0       –2.430          0.015*

     86                                                                                                                                       Scientific Journals of the Maritime University of Szczecin 53 (125)
Modelling the lateral distribution of ship traffic in traffic separation schemes

where:                                                                                                 • Oil product tankers (OPT):
R1 – rank sum for group 1 (OPT);
R2 – rank sum for group 2 (GC);                                                                                                                       σ = 0.1332·D + 96.888                                   (8)
n1, n2	 – sample size;
Z – value of Mann-Whitney test, when the sample                                                        where: σ is the standard deviation of a ship’s dis-
       size of both groups is greater than 20;                                                         tance from the centre [m]; D is the width of the traf-
p – significance level for the test (for the Z test                                                    fic lane [m].
       value);                                                                                             By building individual sub-models for distinct
U1 can be replaced by U2;                                                                              types of ship, waterway and navigational conditions,
t – number of cases included in tied rank.                                                             etc. it is possible to create a general model of ship
    The Mann-Whitney test is a nonparametric equiv-                                                    traffic flows. The aim of the model is to determine
alent of the t-test for independent data. According to                                                 the standard deviation according to the mentioned
the results of the Monte Carlo test in some cases, this                                                parameters and the distance to danger. The results
test is even stronger than the t-test. When the test                                                   obtained can be implemented in navigation risk
feature has no normal distribution, the Mann-Whit-                                                     assessment models.
ney test can be safely used because the chance of                                                          It can be seen that, despite there being a statisti-
accepting the alternative hypothesis, if it is true, it is                                             cally significant difference between samples for gen-
not less than the chance of rejecting the null hypoth-                                                 eral cargo vessels and oil product tankers, there is
esis by the t-test (Francuz & Mackiewicz, 2007).                                                       no distinct difference between the models (Figure 8).
    In Figure 7a, the relationship between the stan-
                                                                                                                             1400
dard deviation of a ship’s distance from the centre
and the width of the traffic lane, D,is shown. It can                                                                        1200

be seen that there is a linear correlation between
                                                                                                  Standard deviation σ [m]

                                                                                                                             1000
these parameters with a correlation coefficient of
more than 0.8. This seems to be a very important                                                                              800

conclusion in the scope of traffic model creation.
                                                                                                                              600
This is due to the way the navigator navigates in cer-
tain areas. The more difficult (the narrower) the area                                                                        400

for navigation, the more accurately the steering of
                                                                                                                              200
the vessel is performed.
    These results allowed a linear regression model                                                                            0
                                                                                                                                    0       1000      2000     3000   4000    5000    6000   7000     8000    9000
to be built for the standard deviation of ship tracks in                                                                                                       Width of traffic lane D [m]
the TSS for two groups of analysed ships:                                                                                                       General cargo vessel                  Oil product tanker
• General cargo vessels (GC):
                                                                                                       Figure 8. Comparison of two models: general cargo vessels
                                         σ = 0.1519·D + 87.291                              (7)        and oil product tankers

a)                              Regression of Standard Deviation by Width of Traffic Lane              b)                                          Pred(Standard Deviation) / Standard Deviation
                                                   [m] (R2 = 0.731)                                                             1400
                     1400
                                                                                                                                1200
                     1200
Standard Deviation

                     1000                                                                                                       1000
                                                                                                      Standard Deviation

                      800
                                                                                                                                    800
                      600
                                                                                                                                    600
                      400

                      200                                                                                                           400

                        0
                            0        1000    2000     3000     4000      5000   6000    7000                                        200
                     –200
                                                 Width of traffic lane [m]                                                              0
                                                                                                                     –200                   0        200       400      600     800     1000        1200     1400
                            Model (Standard Deviation)              Conf. interval (Mean 95%)
                                                                                                                                –200
                            Conf. interval (Obs 95%)                                                                                                         Pred(Standard Deviation)

Figure 7. a) Linear correlation between the width of traffic lane D and standard deviation of distance from the centre σ;
b) prediction of standard deviation vs. standard deviation. Marked correlations are significant at p < 0.05000, R = 0.8549,
p = 0.00

Zeszyty Naukowe Akademii Morskiej w Szczecinie 53 (125)                                                                                                                                                        87
Agnieszka Nowy, Lucjan Gucma

In the case of the oil product tankers, where general-            Further studies are planned in this field for oth-
ly the crew is more highly trained and experienced,           er traffic routes. The influence of vessel size (L, T),
the deviations are smaller which indicates a more             type, and distance to danger will be determined.
accurate navigational system with compliance to
rules. Tankers, as vessels with highly dangerous car-         Acknowledgments
go, keep away from other vessels and navigate with
extra caution.                                                   This research outcome has been achieved under
                                                              the grant No. 11/MN/IIRM/17 financed from a sub-
Conclusions                                                   sidy of the Ministry of Science and Higher Educa-
                                                              tion for statutory activities.
    This paper presents the results of research into
ship traffic flow models in the Baltic Sea. Vessel            References
traffic in Traffic Separation Schemes was taken into
                                                               1. Aydogdu, Y.V., Yurtoren, C., Park, J.S. & Park, Y.S.
consideration. The presented samples of distribu-                 (2012) A study on local traffic management to improve ma-
tions are the basis for the development of a mathe-               rine traffic safety in the Istanbul Strait. Journal of Naviga-
matical model of traffic.                                         tion 65, pp. 99–112.
    Models for two vessel groups were built (gen-              2. Blokus-Roszkowska, A. & Smolarek, L. (2014) Maritime
eral cargo and oil product tankers). The results                  traffic flow simulation in the intelligent transportation sys-
                                                                  tems theme. Safety and Reliability: Methodology and Appli-
show a small difference between these two models,                 cations-Proceedings of the European Safety and Reliability
despite there being a statistically significant differ-           Conference (ESREL 2014), pp. 265–274.
ence between these two groups. This issue needs to             3. Convention (1972) Convention on the International Regula-
be investigated more thoroughly. It is necessary to               tions for Preventing Collisions at Sea. London, 20 October
                                                                  1972.
continue research in other waters in to expand and             4. Dziak, J., Coffman, D., Lanza, S. & Li, R. (2012) Sensitiv-
verify the model. It was noticed that navigators do               ity and specificity of information criteria. Technical Report
not always navigate on the centre or right-hand side              Series #12-119. The Methodology Center of The Pennsylva-
of the traffic lane as was previously suggested.                  nia State University.
    There is a linear correlation between the stan-            5. Engberg, P.C. (2016) IWRAP MK2 v5.2.0 Manual. Gate-
                                                                  House A/S.
dard deviation of a ship’s distance from the centre            6. Feng, H. (2013) Cellular automata ship traffic flow model
and the width of the traffic lane. The coefficient of             considering integrated bridge system. International Journal
determination is satisfactory according to the accept-            of u- and e- Service, Science and Technology 6, 6, pp. 121–
ed interpretation which leads to further research on              132.
                                                               7. Francuz, P. & Mackiewicz, R. (2007) Liczby nie wiedzą
the topic.                                                        skąd pochodzą. Przewodnik po metodologii i statystyce nie
    The presented method, based on a simple regres-               tylko dla psychologów. Wydawnictwo KUL.
sion model, can be used for designing waterway sys-            8. Fuji, Y. (1977) The behavior of ships in limited waters. Proc.
tems and calculating the probability of crossing the              of the 24th International PIANC Congress, Leningrad.
boundary line. The developed model will allow the              9. Fuji, Y., Yamanouchi, H. & Mizuki, N. (1974) Some Fac-
                                                                  tors Affecting the Frequency of Accidents in Marine Traffic.
design of sea routes during the development of wind               Journal of Navigation 27(2), p. 239–247.
farms and other marine constructions and facilities           10. Goerlandt, F. & Kujala, P. (2010) Modeling of ship colli-
that affect the nature of vessel traffic flow. Using this         sion probability using dynamic traffic simulation. Reliabil-
approach, it is possible to obtain generic rules that             ity, Risk and Safety. Ale, Papazoglou & Zio (Eds). London:
                                                                  Taylor & Francis Group, pp. 440–447.
describe the vessel path in many different areas. To          11. Gucma, L. (1999) Kryterium bezpieczeństwa manewru
do so, the case study area (Southern Baltic) will be              na torze wodnym. Materiały na Konferencję Explo-Ship,
split into several characteristic waterways and seg-              WSM, Szczecin.
ments and the location-specific results will be gener-        12. Gucma, L. (2006) The method of navigation risk assess-
alised to their specific segments.                                ment on waterways based on generalised real time simu-
                                                                  lation data. Proc. of International MARSIM Conference,
    It can be concluded that by using an analysis of              Terschelling.
historical AIS data, clearly more insight is obtained         13. Gucma, L., Perkovic, M. & Przywarty, M. (2009) Assess-
into detailed individual vessel behaviour. This                   ment of influence of traffic intensity increase on collision
understanding of the behaviour can be formulated                  probability in the Gulf of Trieste. Annual of Navigation 15,
                                                                  pp. 41–48.
into generic rules. These rules can be implemented            14. Gucma, S. (2013) Optimization of sea waterway system pa-
in the maritime model, which improves the simula-                 rameters in marine traffic engineering. Journal of KONBiN
tion of the individual vessel paths.                              2(26), pp. 51–60.

88                                                          Scientific Journals of the Maritime University of Szczecin 53 (125)
Modelling the lateral distribution of ship traffic in traffic separation schemes

15. Gucma, S., Ślączka, W. & Zalewski, P. (2013) Parametry              22. Montewka, J., Krata, P., Goerlandt, F., Mazaheri, A.
    torów wodnych i systemów nawigacyjnych wyznaczane przy                  & Kujala, P. (2011) Marine traffic risk modeling – an inno-
    wykorzystaniu bezpieczeństwa nawigacji. Monography edi-                 vative approach and a case study. Proceedings of the Institu-
    ted by Stanisław Gucma. Szczecin: Wydawnictwo Naukowe                   tion of Mechanical Engineers, Part O: Journal of Risk and
    Akademii Morskiej w Szczecinie.                                         Reliability 225 (3). pp. 307–322.
16. Guziewicz, J. (1996) Model manewrowania statkiem na                 23. Osekowska, E., Johnson, H. & Carlsson, B. (2017) Mar-
    wybranych basenach portowych Świnoujścia i Szczecina.                   itime vessel traffic modeling in the context of concept drift.
    Rozprawa doktorska, Wydział Budownictwa Wodnego, PW,                    Transportation Research Procedia 25, pp. 1457–1476.
    Gdańsk.                                                             24. Pedersen, P.T. (2002) Collision risk for fixed offshore struc-
17. Haugen, S. (1991) Probabilistic Evaluation of Frequency of              tures close to high‐density shipping lanes. Journal of Engi-
    Collision Between Ships and Offshore Platforms. Doctoral                neering for the Maritime Environment 216 (1), pp. 29–44.
    dissertation, University in Trondheim.                              25. Puszcz, A. & Gucma, L. (2011) Towards the Model of Traf-
18. Iribarren, J.R. (1999) Determining the Horizontal Dimen-                fic Flow on the Southern Baltic Based on Statistical Data.
    sions of Ship Manoeuvering Areas. PIANC Bulletin No.                    Proc. of the 9th International Trans-Nav Conference, Vol. 5,
    100, Bruxelles.                                                         Gdynia.
19. Liu, Z., Liu, J., Li, Z., Liu, R.W. & Xiong, N. (2017) Char-        26. Silveira, P.A.M., Teixeira, A.P. & Guedes Soares, C.
    acteristics analysis of vessel traffic flow and its mathemati-          (2013) Use of AIS Data to Characterise Marine Traffic Pat-
    cal model. Journal of Marine Science and Technology 25(2),              terns and Ship Collision Risk off the Coast of Portugal. The
    pp. 230–241.                                                            Journal of Navigation, 66, pp. 879–898.
20. Lušić, Z., Pušić, D. & Medić, D. (2017) Analysis of the             27. Wen, Y.Q., Huang, Y.M., Zhou, C.H., Yang, J.L., Xiao,
    maritime traffic in the central part of the Adriatic. In:               C.S. & Wu, X.C. (2015) Modelling of marine traffic flow
    Transport Infrastructure and Systems. Proceedings of                    complexity. Ocean Engineering 104, pp. 500–510.
    the AIIT International Congress on Transport Infrastruc-            28. Yamaguchi, A. & Sakaki, S. (1971) Traffic surveys in Ja-
    ture and Systems. Dell’Acqua G. & Wegman F. (Eds)                       pan. Journal of Navigation 24, pp. 521–534.
    pp. 1013–1020.                                                      29. Yip, T.L. (2013) A marine traffic flow model. International
21. MacDuff, T. (1974) The Probability of Vessel Collisions.                Journal on Marine Navigation and Safety of Sea Transpor-
    Ocean Industry.                                                         tation 7, 1, pp. 109–113.

Zeszyty Naukowe Akademii Morskiej w Szczecinie 53 (125)                                                                               89
You can also read