Characterizing the YouTube video-sharing community
←
→
Page content transcription
If your browser does not render page correctly, please read the page content below
Characterizing the YouTube video-sharing community∗

                                    Rodrygo L. T. Santos, Bruno P. S. Rocha,
                                   Cristiano G. Rezende, Antonio A. F. Loureiro
                                             Department of Computer Science
                                             Federal University of Minas Gerais
                                            Belo Horizonte, MG 31270-901 Brazil
                               {rodrygo,bpontes,rezende,loureiro}@dcc.ufmg.br

ABSTRACT                                                          February 2005, YouTube was officially launched in Decem-
The YouTube video-sharing community is a recent and suc-          ber of the same year and has not stopped growing since then.
cessful phenomenon that provides an expressive representa-        By July 2006, the site reported to serve 100 million videos
tion of a social network. Despite its accelerated growth, a       per day, with a daily upload of more than 65,000 videos and
deep study of YouTube’s topology has not yet been made            nearly 20 million unique visitors per month – a 29% share
available. For this work, we have collected a representative      of the US multimedia entertainment market and 60% of all
sample of YouTube using our Crawlanga tool and analyzed           videos watched online [12]. Its storage demands were es-
both its structural properties, as well as its social relation-   timated at around 45 terabytes with several million dollar
ships among users, among videos, and between users and            expenses on bandwidth per month [3]. Within one year of
videos. We analyze properties such as profile of users and        its launch, YouTube was purchased by Google for US$1.65
popularity of videos in order to highlight the impact of social   billion in stock.
relationships on a content-sharing network.
                                                                  YouTube’s success can be seen as an example of the “wisdom
Categories and Subject Descriptors                                of crowds” [14]: the site exerts no control over its users’ free-
H.2.8 [Database Management]: Database Applications-               dom for publishing 2 , in such a way that users not only share
Data Mining; J.4 [Computer Applications]: Social and              their videos with a few friends, but instead participate in a
behavioral sciences                                               huge decentralized community by creating and consuming
                                                                  terabytes of video content, ranging from home-made stand-
General Terms                                                     up performances to eyewitness footages from inside news as
                                                                  they occur anywhere in the world.
Human factors, Measurement
                                                                  Despite its enormous popularity and the sums of money in-
Keywords                                                          volved, it is rather surprising that (at least to our knowl-
Virtual communities, network sampling, network analysis           edge) no study has been carried on unveiling the virtual
                                                                  community behind YouTube.
1.     INTRODUCTION
The last decade has witnessed the emergence of several pop-       In this paper, we present an analysis of YouTube network,
ularity phenomena through the word-of-mouth and self-pub-         based on a sample of it we were able to collect using a
lishing made feasible by the World Wide Web. This is true         crawler tool. In our analysis we focus users and videos,
for people, the content they produce, and the vehicles that       and attributes and relationships between them. We observe
distribute their production. Some of these phenomena have         attributes such as number of videos visualizations, users sub-
declined or have been replaced as rapid as they rose, while       scription, users favorite lists, commenting, and others. We
others have retained a steady pace of growth.                     also model the collected network as different networks in-
                                                                  cluding specific views as, for instance, a friendship network
The TIME’s Invention of the Year for 2006 [4], the YouTube 1      between users and a network between videos connected by
video-sharing website is one of the most recent and aston-        edges that represent being part of a same user’s favorite list.
ishing such examples of a Web phenomenon. Founded in
∗Data set will be made available in the camera ready version      This paper is organized as follows. On Section 2 we present
1                                                                 work on similar networks and virtual communities. We
    http://www.youtube.com
                                                                  present some background on the YouTube video-sharing com-
                                                                  munity in Section 3. Sections 4 and 5 detail the crawling
                                                                  process and tool, as well as the data sample we used, re-
                                                                  spectively. Our analysis of attributes and relationships is
                                                                  discussed in Section 6. Finally, we present our conclusions
                                                                  in Section 7.

                                                                  2
                                                                    According to the site policy, copyrighted or inappropriate
                                                                  content is reviewed after being flagged by the community.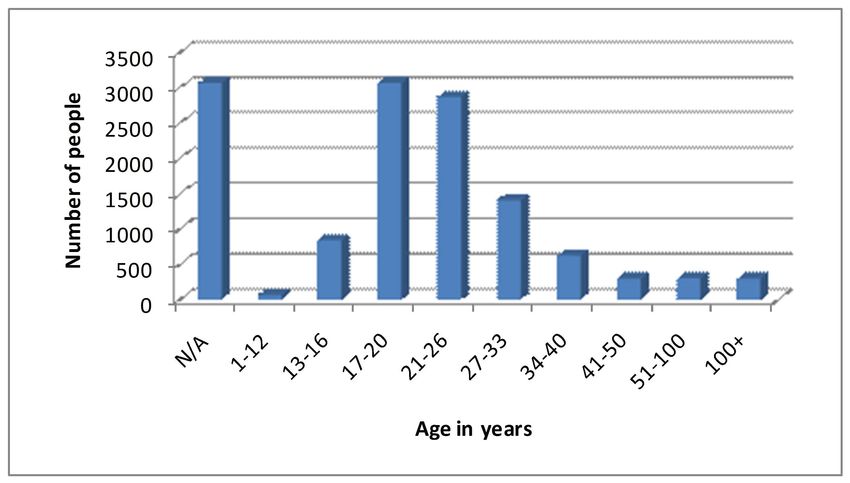
2.   RELATED WORK                                                 compares structural properties of the co-authorship networks
The analysis of structural properties of large networks have      in publication databases from different areas, including biomed-
received much attention in the late years. Typically, stud-       ical research, physics, and computer science. He presents re-
ies include network properties such as degree distribution,       sults on the mean and distribution of co-authorship degrees
diameter, clustering coefficient, betweenness centrality, net-    and clustering coefficients for these networks and shows the
work resilience, mixing patterns, degree correlations, com-       presence of the small world effect in all of them. Kumar
munity structure, network navigation, etc. In this section,       et al. [5] characterize the profile of more than one million
we briefly outline some publications on the analysis of large-    LiveJournal users with regards to three main dimensions:
scale virtual communities, organized as social networks and       age, geography, and interests. They show how over 70%
information networks [11].                                        of friendship links among these users can be explained by
                                                                  combining these three dimensions. They also investigate the
Anh et al. [1] compare structural properties of sampled friend-   cultural aspect of highly-dynamic local, informal community
ship networks from two social networking services (SNSs),         formation in the blogospace, through the establishment of
namely MySpace 3 and Orkut 4 , and the entire topology of         short-lived reading, posting, and listing relationships among
the Cyworld 5 SNS. They uncover a two-period scaling be-          small groups of users.
havior in Cyworld’s degree distribution, being the exponent
of each period correspondent to the exponent of the degree        3. THE YOUTUBE VIDEO-SHARING COM-
distribution of MySpace and orkut, respectively. Also, they
show how Cyworld’s testimonial network (a subset of its              MUNITY
friendship network) presents a similar degree correlation to      The YouTube video-sharing community can be seen as an
real-life social networks. Friendship network properties are      heterogeneous graph with basically two 10 types of node:
also studied by Kumar et al. [6]. They present measure-           user and video.
ments on two Yahoo! SNSs: Flickr 6 , a one-million-node
photo-sharing community, and Yahoo! 360 7 , a five-million-       Users can upload, view, and share video clips. Videos can
node social networking website. They present a model of           be rated, and the average rating and the number of times
network growth by classifying users in these networks as          a video has been watched are both published. Unregistered
either (1) passive, loner members; (2) inviters, who bring        users can watch most videos on the site; registered users
offline friends to form isolated communities; and (3) linkers,    have the ability to upload an unlimited number of videos.
who play the role of bridging a large fraction of the entire      Related videos, determined by the title and tags, appear to
networking the network evolution.                                 the right of the video. In the site’s second year new functions
                                                                  were added, providing the ability to post video ‘responses’
Liben-Nowell et al. [8] study the formation of friendship links   and subscribe to content feeds for a particular user or users.
in the LiveJournal 8 blogging community. They show that,          YouTube had (and still has) a lot of traffic coming to the
among the nearly 500,000 LiveJournal users with mappable          site to view videos, but far fewer users actually creating and
geographic locations (at the level of towns and cities), the      posting content [15].
probability of two people being friends is inversely propor-
tional to the number of people geographically close to them.      Among all the potential relationships present in the YouTube
Also, they find that this property influences the formation       community, we consider the following in this paper:
of two thirds of the friendship links among these users and
prove analytically that short paths can be discovered in ev-
ery network in which it is present. Link formation is also             • user-user friendship: two users mutually regard each
investigated by Backstrom et al. [2]. They study the influ-              other as a friend;
ence of network structural properties on the establishment
of community membership links in two large sources of data:            • user-user subscription: a user subscribes to video feeds
the LiveJournal social networking and blogging service, with             from another user;
several million members and explicitly defined membership
                                                                       • user-video favoring: a user adds a video to his/her list
links, and DBLP 9 , a publication database with several hun-
                                                                         of favorites;
dred thousand authors with conferences regarded as proxies
for communities. They show that the tendency of individu-              • video-video relatedness: a video is regarded related to
als to join a community is influenced by both the number of              another one by the YouTube’s search engine.
friends they have within the community and how connected
these friends are to one another.
                                                                  4. CRAWLING YOUTUBE
Some works on information networks analysis have also em-         Due to the amount of data required to analyze YouTube,
ployed data sets from virtual communities. Newman [10]            using a tool like a web crawler to collect data is a necessity.
                                                                  A web crawler needs to visit web pages of videos and user
3                                                                 profiles. It must be able to follow links representing rela-
  http://www.myspace.com                                          tionships, like user friendship or commenting, and store the
4
  http://www.orkut.com                                            information on visited nodes and followed edges in a format
5
  http://www.cyworld.com                                          which can be further analyzed. As there is necessity for a
6
  http://www.flickr.com
7                                                                 large amount of data, the tool must be efficient and scalable.
  http://360.yahoo.com
8                                                                 10
  http://www.livejournal.com                                       YouTube also features collective entities, namely groups
9
  http://www.informatik.uni-trier.de/∼ ley/db/                    and contests, but they will not be considered in this work.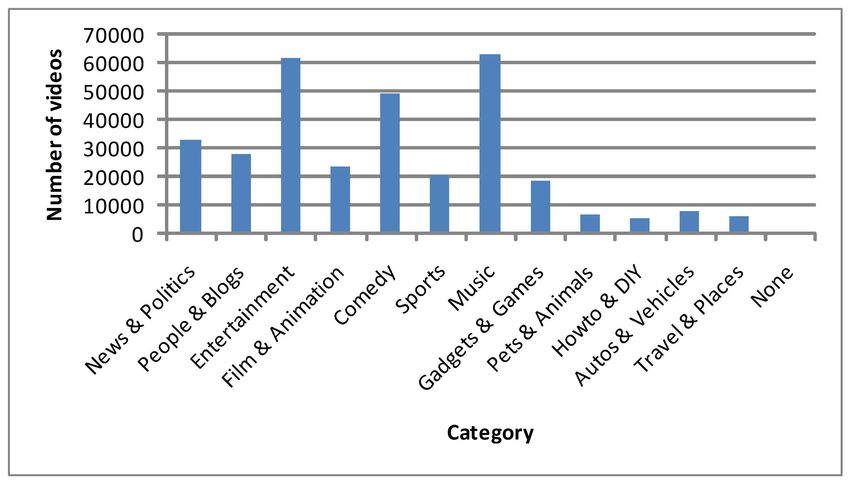
In order to crawl YouTube, we have used our own tool. This fourth 98,428 nodes (1,799 users and 96,629 videos) and in
tool is not only a crawler, but also an extractor, which gen- the last 236,003 nodes (10,996 users and 225,007 videos). As
erates a graph representation of the network. It is model- expected, the number of nodes in each layer grows exponen-
driven, in a way that it reads a network model file, contain- tially.
ing HTML patterns of the network to be crawled. By creat-
ing a network model for YouTube and setting up a crawling Our sample has a total of 338,001 nodes (12,832 users and
structure, we were able to achieve collection of large por- 325,179 videos) and indexed 12,131,796 nodes (625,383 users
tions of YouTube. Our crawler and extractor is presented in and 11,506,413 videos). This means that through the 300
detail in [13]. thousand nodes collected, more than 12 million other nodes
were found by the relationships modeled.
Our tool uses the snowball sampling method [7]. This can
be done with a single seed node, or multiple seeds. For this 6. ANALYSIS OF YOUTUBE
work, we’ve used the single-seed approach. In single seed The crawling process resulted in a dump file filled with
snowball sampling, we first choose a single node and all the a graph representation of about more than three hundred
nodes directly linked to it are picked. Then all the nodes nodes collected. From this data, several information can
connected to those picked in the last step are selected, and be extracted and our objective is to analyze the impact of
this process is continued until the desired number of nodes real-world relations in a technological environment.
is sampled. To control the number of nodes in the sampled
network, a necessary number of nodes is randomly chosen The data can be split in two kinds: attributes and edges.
from the last layer. This is similar to a breadth-first crawling Even though our collect sample is just a fraction of the en-
process [9]. tire network, attributes are relative to whole network prop-
erties since they are derived from data provided by YouTube
We’ve made more than one crawl, using different network database. Differently, the edges compose a network with
model files. The purpose of this was to collect different only the collected nodes. However, as the crawling process
views of the network, considering determined relationships followed the snowball method, these partial networks reflect
at each crawl. Our crawling structure consisted of a sin- properties of the whole network.
gle Pentium 4 3.2GHz server with 2 GBytes of RAM, and
6 client machines, with similar processors but 1 GByte of 6.1 Attributes of Nodes
RAM (our tool uses a client-server model).
As depicted earlier, the two types of nodes considered are
users and videos, each of them containing attributes useful
5. DATA SAMPLE for our analysis. There are attributes that provide informa-
An important issue in any analysis of a collected network is tion about network properties which are related to human
the validation of the gathered sample. The YouTube net- interaction, such as channel views, number of subscribers
work is composed of millions of nodes and the task of collect- and number of videos watched, from users, and number of
ing all of them is extremely hard. Therefore, only a part of times favorited, number of views and number of comments,
the network is actually collected. For this reason, it is fun- from videos.
damental that the fraction crawled represents the behavior
of the whole network. The distribution of these attributes as well of the degrees
of formed networks were all plotted in a log-log scale graph
There are several studies about sampling methods which in order to identify the presence (or absence) of power-law
guarantee that a small collected fraction of the network rep- distributions. Several works reported power-law degrees dis-
resents its entire behavior. The snowball sampling method [7] tributions and how they are related to some real-word prop-
is a well-known method that reliably collects a part of a net- erties. Power-laws are distributions where few values have
work that reflects the behavior of the whole network. The high frequency and plenty of values have low frequencies
method start with a single seed node, and follows the re- while still being a substantial part of the distribution (have-
lationships to discover new nodes in a breadth-first search tail phenomenon). When observed over social relationships,
fashion. Even though there are some studies that mention these distributions often imply on a “preferential attach-
the snowball method with multiple seeds, in this work we ment” scenario, where nodes on the network tend to attach
used the single seed version since it is more diffused and to certain more “popular” other nodes.
acknowledged.
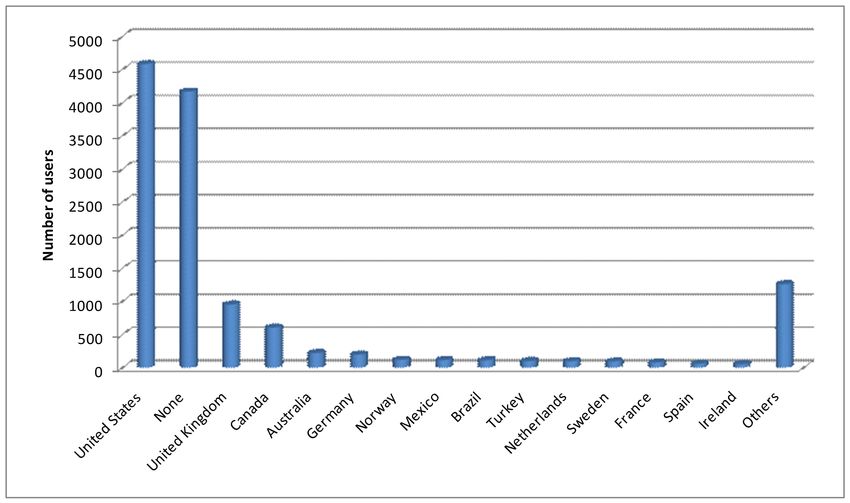
Figures 1, 2 and 3, show general statistics as well as dis-
For the crawling process we utilized the notions of nodes tributions of attributes from users and videos, respectively.
and their relationships. A node is an user or a video of On the general statistics we can observe that users ages and
the YouTube network, and the relationships are friendship, videos duration distributions can be modeled as normal dis-
favoring, subscription and publication, from the users part, tributions. Users nationality has a distribution with U.S.
and relatedness and ownership, from the videos part. being by far the most frequent, while there is a heavy tail
composed mostly of European countries. Videos categories
The gathered nodes can be grouped in layers where nodes is a more balanced distribution, having entertainment, com-
belong to the same layer if they are distant (in the crawling edy and music as most popular, maintaining a coherency
process) from the seed by the same number of hops. By this with user ages distribution (majority of users formed by
definition, in the zero layer we have the seed (which was a young people between 17 and 26 years). Distributions of
video), in the first layer 37 nodes (1 user and 36 videos), attributes from users and videos follow power-law distribu-
in the third 3,546 nodes (36 users and 3,510 videos), in the tions, and are discussed on the following paragraphs.
100000
                                                                                      X=k
                                                                                     X>=k

                                      10000

                                       1000

                         Frequency
                                       100

    (a) Users age                       10

                                         1
                                              1      10    100   1000 10000 100000 1e+06 1e+07 1e+08
                                                                  Number of Views
                                                  (a) Number of Videos Watched
                                     100000
                                                                                      X=k
                                                                                     X>=k

                                      10000

                                       1000
                         Frequency

(b) Users Nationality
                                       100

                                        10

                                         1
                                              1      10    100   1000 10000 100000 1e+06 1e+07 1e+08
                                                                  Number of Views
                                                          (b) Channel Views
                                     100000
                                                                                      X=k
                                                                                     X>=k

                                      10000
(c) Videos Categories

                                       1000
                         Frequency

                                        100

                                        10

                                         1
                                              1      10    100   1000 10000 100000 1e+06 1e+07 1e+08
                                                                 Number of Subscribers
                                                    (c) Number of Subscribers
(d) Videos Duration
                        Figure 2: User Network Attributes Distribution
Figure 1: Statistics
Videos watched
The number of videos watched by a user indicate the utiliza-
tion of the YouTube service by him/her. As it can be seen in
Figure 2(a), most of the users have watched a small number
of videos. However, there are a few users that intensively
use the YouTube service, characterizing the distribution of
videos watched as power-law. This attribute accounts only
1e+06
X=k for views of logged users (a lot of viewers do not even have
X>=k
a user account).
100000
10000 Number of subscribers
Users’ reputation is strongly connected to the videos they
Frequency
1000 publish. A metric than can quantify this reputation is the
number of subscribers an user has. When someone subscribe
100 to a user, he asks to be notified every time a new video is
published by this user. The distribution of this attribute is
10 shown in Figure 2(c).
1
1 10 100 1000 10000 100000 1e+06 1e+07 1e+08 Channel views
Number of Comments Channel views is also connected to users’ reputation but this
(a) Number of Comments connection is weaker than that of the number of subscribers.
1e+06
This is due to the fact that a user can be popular for a period
X=k
X>=k
of time and have a large number of channel views but, later,
100000
lose his reputation and he still remain with a high value of
channel views. Figure 2(b) shows the distribution of the
10000
users’ channel views.
Frequency
1000 Videos views
One important characteristic of a video is its popularity.
100 Videos views indicate the video all-time popularity, since
its does not take into account when the views took place.
10 As shown in Figure 3(b), the distribution has a “normal
like” distribution up to around videos with 50 visualizations.
1
1 10 100 1000 10000 100000 1e+06 1e+07 1e+08
For more than that, the distribution assumes a heavy tailed
Number of Views power-law distribution behavior.
(b) Number of Views
1e+06 Users comments
X=k
X>=k The number of users comments on a video is related to how
100000 controversial it is. As more polemic a video is, more users
will post their comments and discuss about the video’s con-
10000 tent. The distribution of the number of users comments can
be seen at Figure 3(a).
Frequency
1000
Number of times favorited
100
A stronger (compared to video views) metric of popularity is
the number of users that included the video in their favorites
10
list. This attribute is more suitable because it reflects the
current status of the video and not an old popularity. Fur-
1
1 10 100 1000 10000 100000 1e+06 1e+07 1e+08 thermore, adding a video to a favorites list not only tells us
Number of Times Favorited that an user watched the video but it also reflects that he en-
(c) Number of Times Favorited joyed it. Figure 3(c) shows the distribution of this attribute
on the YouTube network.
Figure 3: Videos Network Attributes Distribution
6.2 Relationships
It is important to analyze the impact of human interac-
tion in a technological environment. In the YouTube com-
munity there are two major ways of users relate to each
other: through friendship and subscription. Both relation-
ships were extracted from collected data and had the result-
ing network analyzed. These networks were studied by the10000
X=k
X>=k
1000
Frequency
100
10
1
1 10 100 1000 10000 100000 1e+06 1e+07 1e+08
Number of Friends
(a) Friendship 1e+06
X=k
100000 X>=k
X=k 100000
X>=k
10000 10000
Frequency
1000 1000
Frequency
100
100
10
10
1
1 10 100 1000 10000 100000 1e+06 1e+07 1e+08
1 Number of Related Videos
1 10 100 1000 10000 100000 1e+06 1e+07 1e+08
(a) Relatedness
Number of Users
(b) In-degree in Subscription 1e+06
X=k
X>=k
100000
Figure 4: Degree Distribution of User Networks
10000
Frequency
analysis of the degree distribution, number of nodes, clus-
1000
tering coefficient (number of triangles in the first neighbor-
hood), longest shortest-path (L1 ) and average shortest-path
100
(L2 ).
10
We also identify two relationships between videos. The first
is relatedness, which relates similar videos through the use
1
of tags and keywords. Although this is a relationship gen- 1 10 100 1000 10000 100000 1e+06 1e+07 1e+08
erated by a technological machine (YouTube generates re- Number of Times Favorited
lated lists automatically), it is influenced by social relations, (b) In-degree in Favoring
since a video can have a variable number of related videos,
depending on its associated keywords. For instance, a video
tagged as a soccer video, a very popular category, is likely to Figure 5: Degree Distribution of Videos Network
have many related videos. The second relationship between
videos is favorite lists. Since users can add videos to their
favorite lists, we can form a network of videos and connect
each two that are present on a same favorite list. This allows
us to identify clusters of videos and detect relatedness in a
different fashion than the first relation.
Figures 4 and 5 show degree distribution of users and videos
relationships, respectively. The following paragraphs further
detail these relationships.
Friendship
Through data collected from users nodes, it was possible to
create a representation of a graph were vertices are usersNetwork #Nodes CC L1 L2 Relatedness
Friendship 9,963 0.264221 10 2.76779 YouTube provides a way of finding videos related to each
Subscription 8,575 0.176046 10 3.03550 other. This relationship defines a relatedness network where
an edge exists between two videos if they are related by this
Table 1: Networks Properties engine. This data was collect from links in the main page of
videos.
and edges between them are created when they are friend Although the search engine utilized to find related videos
to each other (in the YouTube context). Therefore, this makes use of tags previous specified by human being users,
network represents how users are related one to another and the mechanism that defines this relationship it is not based
the degree distribution characterizes popularity of users in on human interaction. Therefore, the edges are defined
the YouTube community. based on the the recall of an algorithm.
Figure 4(a) shows a scatter of the degrees distribution of the The degree distribution of the relatedness network can be
friendship network. The single distribution behaves a little seen in Figure 5(a). Probably because of the algorithmic
erratic because some nodes have odd degrees even though source of the relationships, the distribution does not behaves
the friendship relationship in YouTube is reciprocal (degrees properly as a power-law, it does only in some parts of the
should all be even because they are the sum of in and out distribution.
degrees). The odd degrees happen because users accounts
can be suspended. When the crawler tries to collect these Favoring
suspended users, it gather only the user identification and Another kind of relationship present on the YouTube net-
stores on the dump, hence, the suspended user’s friendship work is the one formed by the action when a user adds a
list is not collected which results in an odd degree of the video to his/her favorites list. This list is extracted from
friend user. However, the cumulative distribution diminish the user profile and its composed by a list of video identi-
the impact of these users and behaves like a power-law dis- fiers.
tribution.
Through this relationship we can build a bipartite graph,
In Table 1, some of the friendship network properties are where every edge connects a user and a video. One interest-
listed. A network that has a high clustering coefficient (CC) ing network that can be formed from the favoring network
and a small diameter is called a Small-World network. This is the one formed with nodes of videos, and edges between
kind of network seen to emerge from a lot of different human them if they appear in the favorites list of a same user. A
interactions and is well-known to be easily navigable and comparison between this co-favoring video network and the
have a dense local cluster. Small-World networks merge relatedness network could be used to analyze the effective-
two desirable properties of two famous type of graphs, small ness of the YouTube related search engine.
diameter from random graphs and high clustering coefficient
from regular graphs (lattices). Different from the other networks, the distribution that is
more relevant in this network is the distribution of the in-
degrees. This distribution is plotted on Figure 5(b) and
Subscription evidences a power-law distribution. This power-law differs
The subscription network was built upon the data collected from the one found by the analysis of the attribute “number
from users nodes. From each user was gathered the list of of times favorited”. This is due to the same reasons that
users whose new added videos should be notified to the col- subscribers distribution differed from each other (as men-
lected user. This is an important network since it describes tioned before). But the inclination of the distributions are
how users are interested in the content publishing of other close one to another.
users. Nodes in this network with high degree are authori-
ties that will have their published videos watched by a large 7. CONCLUSIONS
public. In this work we were able to present a characterization of the
YouTube video-sharing virtual community. We were able to
The in-degree distribution of this network represents the collect a sample of this network using our own crawler and
distribution of the number of subscribers among YouTube make different analysis over this data.
users. This distribution is on Figure 4(b) and it behaves
like a power-law distribution. The difference between this By analyzing attributes and relationships we could see how
power-law and the one found on Figure 2(c) is due to the this technological network has a distribution of content ex-
fact that both information are incomplete. Despite the fact tremely influenced by social relationships. Visualizations
that the attributes are related to the whole network, our of videos, relations among users and others have statistical
sample has not all the nodes to plot the real distribution. As distributions that follow power-law functions, showing ev-
the built networks consider only the edges between collected idence of Small-World models and preferential attachment
nodes, they are a fraction of the whole YouTube community. scenarios.
The Table 1 shows some properties of the subscription net- As we do not have knowledge of any other work with the
work. As it can be seen, it has a high clustering coefficient as YouTube network, we present a first step towards charac-
well as a small diameter, which are properties of Small-world terizing this important virtual community. Our results con-
networks. firm that YouTube is, as some social networks like Orkutand MySpace, a technological network whose topology and Wisdom Shapes Business, Economies, Societies and
connections are heavily influenced by human social behav- Nations. Doubleday, May 2004.
ior. [15] Wikipedia. YouTube, May 2007. Available:
http://en.wikipedia.org/wiki/YouTube.
8. REFERENCES
[1] Y. Ahn, S. Han, H. Kwak, S. Moon, and H. Jeong.
Analysis of topological characteristics of huge online
social networking services. In WWW ’07: Proceedings
of the 16th international conference on World Wide
Web, pages 835–844, Banff, Alberta, Canada, 2007.
ACM Press.
[2] L. Backstrom, D. Huttenlocher, J. Kleinberg, and
X. Lan. Group formation in large social networks:
membership, growth, and evolution. In KDD ’06:
Proceedings of the 12th ACM SIGKDD international
conference on Knowledge discovery and data mining,
pages 44–54, Philadelphia, PA, USA, 2006. ACM
Press.
[3] L. Gomes. Will all of us get our 15 minutes on a
YouTube video? The Wall Street Journal, August
2006. Available: http://online.wsj.com/public/article/
SB115689298168048904-
f92aczYTlCtKrTSiZ8vumR3eZCI 20070830.html.
[4] L. Grossman. TIME Best Inventions 2006. TIME,
November 2006. Available: http://www.time.com/
time/2006/techguide/bestinventions.
[5] R. Kumar, J. Novak, P. Raghavan, and A. Tomkins.
Structure and evolution of blogspace. Communications
of the ACM, 47(12):35–39, 2004.
[6] R. Kumar, J. Novak, and A. Tomkins. Structure and
evolution of online social networks. In KDD ’06:
Proceedings of the 12th ACM SIGKDD international
conference on Knowledge discovery and data mining,
pages 611–617, Philadelphia, PA, USA, 2006. ACM
Press.
[7] S. H. Lee, P.-J. Kim, and H. Jeong. Statistical
properties of sampled networks. Physical Review E,
73:016102, 2006.
[8] D. Liben-Nowell, J. Novak, R. Kumar, P. Raghavan,
and A. Tomkins. Geographic routing in social
networks. Proceedings of the National Academy of
Sciences, 102(33):11623–11628, 2005.
[9] M. Najork and J. L. Wiener. Breadth-first crawling
yields high-quality pages. In WWW ’01: Proceedings
of the 10th international conference on World Wide
Web, pages 114–118, Hong Kong, Hong Kong, 2001.
ACM Press.
[10] M. E. J. Newman. The structure of scientific
collaboration networks. Proceedings of the National
Academy of Sciences, 98:404, 2001.
[11] M. E. J. Newman. The structure and function of
complex networks, 2003.
[12] Reuters. YouTube serves up 100 million videos a day
online. USA TODAY, July 2006. Available:
http://www.usatoday.com/tech/news/
2006-07-16-youtube-views x.htm.
[13] B. P. S. Rocha, R. L. T. Santos, C. G. Rezende,
A. A. F. Loureiro, and V. A. F. Almeida.
Model-driven crawling and extraction of web-based
virtual communities. Submitted, May 2007.
[14] J. Surowiecki. The Wisdom of Crowds: Why the Many
Are Smarter Than the Few and How CollectiveYou can also read