ANNEX 3 REMEDY 2B - FURTHER ANALYSIS ON NON-ADDITIONALITY - CASE STUDY OF THE REPUBLIC OF IRELAND MARKET - Utility Regulator
←
→
Page content transcription
If your browser does not render page correctly, please read the page content below
ANNEX 3

REMEDY 2B – FURTHER ANALYSIS
        ON NON-ADDITIONALITY

   CASE STUDY OF THE REPUBLIC OF
                 IRELAND MARKET

               19 December 2017

                             1
About the Utility Regulator
The Utility Regulator is the independent non-ministerial government department responsible
for regulating Northern Ireland’s electricity, gas, water and sewerage industries, to promote
the short and long-term interests of consumers.

We are not a policy-making department of government, but we make sure that the energy and
water utility industries in Northern Ireland are regulated and developed within ministerial policy
as set out in our statutory duties.

We are governed by a Board of Directors and are accountable to the Northern Ireland
Assembly through financial and annual reporting obligations.

We are based at Queens House in the centre of Belfast. The Chief Executive leads a
management team of directors representing each of the key functional areas in the
organisation: Corporate Affairs; Electricity; Gas; Retail and Social; and Water. The staff team
includes economists, engineers, accountants, utility specialists, legal advisors and
administration professionals.

                                                                                                2
Contents
1   ROI Market ..................................................................................4
    Reasons for using the ROI market as a suitable comparator ........................ 4
    Network Maturity ............................................................................................ 5
    Connection charges ....................................................................................... 7
    Regulatory incentives for domestic owner occupied connections, including
    the extent of marketing and advertising for owner occupied connections. ..... 8
    Comparison of owner occupied connection incentives for GNI versus those
    for firmus...................................................................................................... 11
    Fuel Poverty and Government assistance to connect to gas ....................... 11
    Gas Supply Competition .............................................................................. 15
    Rate of domestic owner occupied connections in ROI ................................ 16
           The basis of the 1.83% figure ....................................................................... 17
    Source of ROI information: .......................................................................... 17
           Update to the 1.83% figure ........................................................................... 18

2   Conclusions from available evidence in ROI ......................... 19

                                                                                                                     3
1 ROI Market
Reasons for using the ROI market as a suitable comparator
1.1 We consider that the Republic of Ireland Gas market given its current development
phase and relative maturity, close proximity to Northern Ireland and uptake of gas
connections to be an appropriate and valid comparator for Northern Ireland GDNs.
As part of the CMA referral of FE’s GD17 price control, the UR provided some
analysis based on connections in the Republic of Ireland that it considered supported
the 25% non–additionality rate. It submitted that 4,676 ‘one off residential’ properties
connected to the gas network in the Republic of Ireland in 2014, were achieved
’without any spend by the network operator on sales, marketing or incentives’. The
UR submitted that this supported the 25% assumption for non additionality.
1.2 Unlike the situation in Northern Ireland where there are three distribution network
companies i.e. PNGL, firmus and SGN (NI) developing and managing three separate
gas distribution networks, there is a single gas distribution network in the Republic of
Ireland and this is managed by Gas Networks Ireland (GNI).
1.3 Gas Networks Ireland is responsible for the safe, reliable and efficient transportation
of natural gas through its network of all gas customers. Development of the national
gas network began in 1976 and the network now consists of:
1,724km of high pressure onshore transmission pipelines in Ireland and Scotland
412km of subsea interconnectors between Ireland and Scotland
11,499km of low pressure distribution pipelines
Three compressor stations
Connection to three entry points, including the newest entry point, the Corrib gas field
176 above ground installations on the transmission network
933 district regulator installations on the distribution network
Connections to the transmission system for 51 large industrial and commercial
installations, including 12 power stations; and
Connections to the distribution system for c.678,000 users across Ireland.
1.4 Gas Networks Ireland and Irish water are part of the Ervia organisation. Ervia is led
by Ervia Group Centre, which sets the strategic direction of the Group. Ervia Group
Centre, Gas Networks Ireland and Irish Water are supported by the Shared Services
Centre and Major Projects divisions.
1.5 Gas Networks Ireland is regulated by Commission for Regulation of Utilities (CRU),
formerly known as Commission for Energy Regulation (CER). Gas Networks Ireland
has recently it’s completed its third price control period (i.e. it ended in October
2017). CRU issued its final decision for the fourth regulated period for GNI i.e.
October 2017 to October 2022 on the 30 August 2017.
1.6 The PC4 decision paper highlighted four key objectives for GNI in the PC4 period i.e.
4
Operate to the highest safety standard
Ensure reliability and security of demand
Ensuring competitive tariffs and support Ireland’s least cost transformation to a low
carbon economy; and
Respond to changing customer service demands.
1.7 The UR notes that in support of the objective to ensure competitive tariffs and
support Ireland’s least cost transformation to a low carbon economy that GNI intends
to continue its growth strategy which commenced in PC3 and intends to deliver over
100,000 additional domestic and commercial customers over the period of PC4. Of
these GNI has a target of achieving 46,244 mature housing connections in the PC4
period1.
1.8 The Utility Regulator considers that there are a number of aspects of the ROI market
which are of relevance to this consultation on ground 2b non additionality. These are
as follows:
Network Maturity
1.9 The GNI gas distribution network is older than the firmus network but is not mature.
GNI stated in its PC4 executive summary that ‘GNI commenced development of the
natural gas infrastructure in 1976. Over the following 40 years, GNI expanded the
transmission and distribution networks across Ireland and built interconnection with
Great Britain. During this time, network expansion has not been completed at a
constant rate, but in a series of investment tranches. The 1990s and 2000s, in
particular, saw periods of large scale infrastructure additions to the network’. We
observe that this continues to be the case as GNI are forecasting an increase in
annual connections for domestic owner occupied properties in the PC4 period (i.e.
October 2017 to October 2022) than was the case in the PC3 period (i.e. October
2012 to October 2017).
1.10 We have taken the opportunity for the purposes of this consultation to update our
analysis on the maturity of the firmus network, PNGL, and Northern Ireland as whole
and compare this to the GNI network. Our original analysis on network maturity was
based on number of connections versus population figures.
1Table 1: forecast connections in PC4, page 14, GNI PC4 Executive Summary@ PC4 SD001,
02/12/2016
5
Cumulative         Cumulative         %age of OO        Long term
                   OO                 OO                 prop passed       target OO
                   connected          properties         connected         connections
                                      passed                               as %age of
                                                                           prop passed
       PNGL             89,185           198,051              45%              81%2
       firmus           7,596             48,998              16%              66%3
         GNI           636,0124          936,0125             68%            No specific
                                                                               target
Table 1: OO connections as percentage of OO properties passed for firmus, PNGL
and GNI (2014)

1.11     We have updated our analysis to take account of data provided by firmus and PNGL
         in their annual cost reporting and from GNI information on the network in ROI. This
         data is shown in table 1. This shows that in 2014 the maturity of the firmus network
         was 16%, the PNGL network 45% and the GNI network was 68%. However it is
         worth noting that the firmus long term target for OO connections as %age of prop
         passed is significantly less than that for PNGL at 66% v 81% for PNGL.

1.12     A further way to measure the maturity of the gas distribution network is to measure
         the number of OO connections versus the total number of OO domestic properties. A
         comparison of the maturity of the ROI v N.I. network is shown on this basis in table 2.

                   Cumulative         Total OO           %age of OO
                   OO                 properties         connected
                   connected
    Northern          97,409             654,4306             15%
     Ireland
       GNI             649,445          1,554,4877            42%
Note: Total OO properties excludes social housing e.g. housing executive properties and equivalent in ROI

Table 2: OO connected versus OO properties (2016)

1.13     Using this measure of maturity shows that network is Northern Ireland is 15% while in
         the Republic of Ireland is 42%, however this measure of maturity will include
         properties that may never connect to the gas network.

2 PNGL GD14 BP submission + GD17 BP submission (East Down) anticipated connections as %age
of properties passed.
3 Firmus GD17 business plan submission: supplementary paper – connection incentive extract ‘Our

long-term plan is to extend the benefits of natural gas to many more customers over time. Although
the analysis of our network build programme is ongoing, we indicatively expect that it will be economic
for our network to be extended to pass approximately 175,000 properties by 2045. We aim to achieve
an overall penetration rate of 66% of properties passed, leading to total connections in 2045 of
approximately 115,000’
4 Table 9.2, page 66 of the 2016 GNI Systems Performance Report
5 636,012 properties already connected plus 300,00 readily connectable
6 2016 NIHE preliminary report: table 2 i.e. 464,740 + 128,120+ 34,650 + 26,920
7 From 2016 ROI central statistics office i.e. 1,697,665 domestic properties – 143,178 social housing

properties

                                                                                                            6
1.14 We maintain our view that while the gas distribution network in GNI is more
advanced than that in either PNGL or the firmus area, it cannot be considered
mature. This is evidenced by the fact that GNI are forecasting a significant increase
in its domestic owner occupied connection activity in the PC4 period as compared to
the PC3 period and this includes potentially extending the distribution network into
new areas8.
1.15 However we do not consider that the maturity of a network in of itself to be a key
driver of the decision making process of a domestic owner occupied property owner
in deciding whether or not to connect to the gas network. Rather, that as the network
makes a rapid expansion in the start-up years, the connections do not follow at the
same pace. As time moves on, this establishes into a more consistent trend,
whereby properties passed and consumers join on a more regular basis.
Connection charges
1.16 According to the firmus energy distribution connection policy (v3.1 – 1st May 2017) 9
firmus does not charge domestic owner occupied properties a connection charge for
connecting to the gas network for connections up to 30 metres. The exception to this
is for housing association properties where by ‘Housing Association developments
will be subject to financial appraisal (based on costs, Regulatory allowances and
expected volume of gas to be burned). Any shortfall in payback from the financial
appraisal may be requested from the Housing Association’10.
1.17 In contrast to the situation in Northern Ireland (including the firmus area), Gas
Networks Ireland charge a connection fee for domestic owner occupied properties in
the Republic of Ireland. The current charge is €249.70 for connections up to the first
15 metres. The rate per meter for connections above 15 metres is €51.32 (if the
relevant trench work is completed by GNI). We understand from GNI that around 8%
of its domestic owner occupied customers who connect each year to its network
would pay more than the standard is €249.70 connection charge.
1.18 A summary of the costs of domestic owner occupied connections in the firmus area
versus that in the Republic of Ireland for connections over 14m, 20m and 29m
distances are shown in table 3.
8
Page 42 of the GNI 2016 network development plan states in relation to residential new connections
growth ‘A number of new towns have been connected (e.g. Nenagh and Wexford) and further towns
are currently under assessment’.
9 https://www.firmusenergy.co.uk/publications/category/distribution-connection-policy/specific/firmus-
energy-distribution-connection-policy-document
10 Para 2.12.3 of the firmus 2017 connection policy
7Connection scenario Firmus charge GNI charge11
Connection of 14 metres £0 £224.73
Connection of 20 metres £0 £455.67
Connection of 29 metres £0 £869.74
Note: we have assumed an exchange rate of €1 = 90p
Table 3: Comparison of Connection charges in the firmus area and GNI area
1.19 We consider that connection charges are a relevant factor in the decision making
process by domestic owner occupied property owners in deciding whether to connect
to the gas network. It is clear from table 3 that domestic owner occupied property
owners in the Republic of Ireland face a significant additional cost burden compared
to domestic owner occupied property owners in Northern Ireland in deciding whether
to make a connection to the gas distribution network. Our understanding is that in the
Republic of Ireland once the connection rate increases above the standard €249.70
this can become an increasingly negative consideration for a potential domestic
owner occupied property owner in deciding if they want to connect to the gas
network.
Regulatory incentives for domestic owner occupied connections,
including the extent of marketing and advertising for owner
occupied connections.
1.20 In the PC3 period there were no regulatory incentives for GNI to connect domestic
owner occupied properties to the gas distribution network, nor where there any
specific allowances for market development for the domestic owner occupied section.
Therefore any expenditure by GNI on marketing and development in the PC3 came
from within its overall opex allowance.
1.21 The 2015 GNI Systems Performance Report discusses its promotion of gas
connections to domestic owner occupied properties on pages 33 to 35, for example:
‘The Gas Networks Ireland sales team continues to promote connecting to natural gas in the
residential sector to households that are on the network but not connected to natural gas.
These are categorised as “mature housing”. Many external factors influence this household
type in choice of energy, more recently low oil and coal prices have acted as a deterrent in
replacing older heating systems. Similarly access to finance, choice of alternative fuels and
investing in energy efficiency have been impacting the figures.
Through the Gas Networks Ireland Connections Policy, Gas Networks Ireland continually
brings the benefits of natural gas to new towns. The Connections Policy is a Gas Networks
Ireland policy that is approved by the Commission for Energy Regulation (CER). The
Connections Policy was revised in 2015, it encourages the connection of new customers,
offers transparency around charges, treats connections consistently and minimises the
impact on tariffs. The more customers that are connected to the gas network, the more
throughput on the system which in turn reduces the tariffs for all gas customers. Gas
11 https://www.gasnetworks.ie/home/get-connected/connection-costs/
8Networks Ireland actively promotes natural gas as a fuel of choice for homes, businesses
and industry, greater utilisation of the natural gas network and looks for opportunities to
expand the network where economically viable’.
1.22 It is however important to note that some of this commentary relates to GNI achieving
connections in new areas. In this context it is important to note that the UR provided
firmus with a new area allowance for the GD17 period and this was not appealed by
firmus. We also understand from GNI that in relation to its promotional activities for
domestic owner occupied connections it is placing less emphasis on its sales forces
and more focus on its online activity e.g. through development of its website and
through the use of social media.
1.23 This would appear to be consistent with evidence provided by firmus in the course of
the CMA appeal12 where the examples provided by firmus of GNI promotional activity
were based on either GNI website material or social media based advertising such as
Youtube, twitter and linkedin. We also note that one of the examples provided by
firmus in its evidence to the CMA had no relationship to promoting gas connections
to domestic owner occupied properties but rather was about gas safety.
1.24 The situation in terms of regulatory incentives for GNI to connect domestic owner
occupied properties in the PC4 period has changed in comparison to the PC3 period.
CRU has developed an incentive mechanism that rewards GNI if it exceeds its
business as usual (BAU) targets, but GNI suffers a penalty if it fails to meet its BAU
target.
1.25 CRU based the BAU numbers upon the volume of connections made in the first 4
years of PC3 and the first 5 months of 2016/17. Table 4 shows the connection
targets submitted by GNI for the PC4 price control. The CRU has expressed some
doubt over the level of new connections forecast by GNI in PC4. CRU set the PC4
connection targets at the business as usual rate but provided a reward / penalty
mechanism to incentivise GNI to outperform the BAU targets.
2017/18 2018/19 2019/20 2020/21 2021/22 Average
GNI forecast 7,181 8,006 7,878 8,114 8,327 7,901
connections
BAU 4,519 4,519 4,519 4,519 4,519 4,519
connections
%age BAU 62.9% 56.4% 57.4% 55.7% 54.3% 57.2%
Note: above figures will include social housing but this does not affect %age BAU calculation.
Table 4: PC4 BAU and target domestic owner occupied connections for GNI
1.26 The CRU decided on a symmetric marginal incentive (reward/penalty) rate for each
connection that falls below or exceeds the PC4 BAU target. So for example, if the
marginal incentive rate was €22 per domestic housing connection, then if actual
12 See Annex 4 FE submission 14 March on ROI GNI advertising for OO connections
9connections were to fall below the PC4 target by 100, the penalty applied under the
scheme would be €2,20013.
1.27 The CRU also noted that ‘a priority of the commercial function with GNI was to
maximise the potential of the existing gas network while seeking opportunities to
expand and diversify into new markets through research and innovation’. The CRU
noted that during PC3 there has been the creation/growth of the Commercial
Department to specifically provide the focus on growth of customer numbers and
other new and innovative approaches to increase gas demand. The object of this
being to maximise the benefit from the installed network asset base14’.
1.28 Our understanding is this covered promoting gas connections to all customer groups
e.g. domestic owner occupied, industrial and new homes. The increased expenditure
by GNI in this area was partly to cover for the envisaged increase in domestic owner
occupied connections in the PC4 period versus those connections delivered in the
PC3 period.
1.29 We note that while it could be inferred that the %age BAU in table 4 could reflect non
additional connections in the PC4 period these figures may reflect the upper
boundary of a possible non additional %age assumption as it would not take into
account the level of any promotional activity undertaken by GNI in the PC3 period.
Figure 1: PNGL billboard on Boiler Replacement Allowance
13 Page 117 CER Decision on October 2017 to September 2022 Distribution Revenue for Gas
Networks Ireland (CER/17/259, 30/08/2017)
14 Page 18 of the PC4: REVIEW OF DISTRIBUTION REVENUES COMMISSION FOR ENERGY
REGULATION (CER), June 2017, Technical and Economic Review, Final Report
101.30 We consider however there are aspects of advertising and marketing undertaken by
firmus and PNGL that is different to the Republic of Ireland i.e. some advertising and
marketing undertaken by firmus and PNGL features government assistance to
connect to the gas network. An example of this form is advertising in shown in figure
1. A further example can be found on the firmus website15 part of which states ‘Boiler
Replacement Scheme – with the government’s Boiler Replacement Scheme if you’re
an owner occupier you could claim up to £1,000 towards the cost of a new SEDBUK
‘A’ rated natural gas boiler and heating system. So hurry there’s never a better time
to convert to natural gas just in time for winter!’
Comparison of owner occupied connection incentives for GNI
versus those for firmus
1.31 We understand the incentive provide by CRU to GNI for owner occupied connections
in the PC4 period is €125 per connection (or £112.50 assuming exchange rate of €1
= 90p) for those connections gained over and above the BAU target. There is also a
penalty of €125 per connection for each connection below the BUA target connection
number.
1.32 For firmus the UR decided in the GD17 FD to provide for a connection incentive of an
average of £635 per connection over the annual connection target. This is 5.6 times
the connection incentive provided by CRU for GNI in the PC4 period. The UR also
provided for a collar as part of the connection incentive regime in the GD17 period
which is an average of £158.75 over the GD17 period. The collar comes into effect
where firmus to underperform by over 50% in its annual connection target.
Consequently it can be seen that the collar amount in the connection incentive
regime provided by the UR is above the connection incentive provided by CRU to
GNI. Firmus did not appeal this this aspect of the connection incentive to the CMA.
1.33 The UR also notes that the ‘new area’ allowance it provided to firmus in the GD17
period of an average of £150 per connection (if calculated across all OO
connections) is also above the connection incentive provided by CRU for GNI in the
PC4 period.
Fuel Poverty and Government assistance to connect to gas
1.34 GNI note in their PC4 executive summary that ‘Energy poverty affects more than
460,000 households in Ireland16’. If we divide this into the total number of occupied
properties in the Republic of Ireland of 1,697,665 then circa 27% of households in the
Republic of Ireland are in fuel poverty if we define fuel poverty as those households
spending more than 10% of income on energy. This is consistent with information on
15https://www.firmusenergy.co.uk/home/firmus-energy-network/switching-to-firmus-energy/firmus-
energy-incentives-natural-gas-heating-grants
16 Page 9 of GNI PC4 executive summary, PC4 SD001, 02/12/2016
11the ROI Department of Communities, Climate Change and Environment website
which puts the fuel poverty figure at 28%17. This rate of fuel poverty would be
marginally higher than in Wales at 23%18 but below that which exists in Northern
Ireland.
1.35 The equivalent level of fuel poverty in Northern is 42%19 and is also defined as those
households spending more than 10% on income on energy. One reason why the rate
of fuel poverty may be higher in Northern Ireland in comparison to the Republic of
Ireland is that the average salary in the Republic of Ireland is higher than in Northern
Ireland20. However we consider that the difference in disposable income levels
between Northern Ireland and the Republic of Ireland to be less than the difference in
salary levels due to for example differences in the personal tax regimes and in
relation to input prices e.g. housing costs.
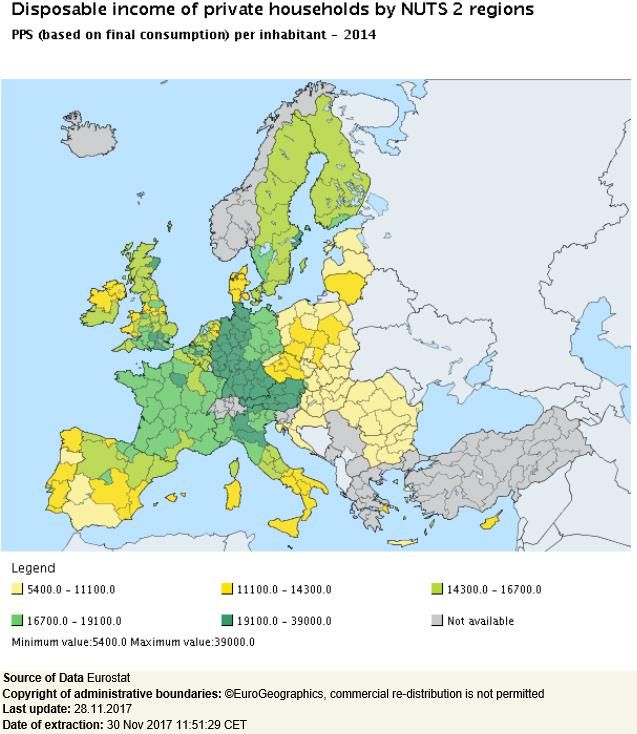
1.36 We note that Eurostat provides data on disposable income of private households per
EU region. The units used by Eurostat are Purchasing Power Standard based on
final consumption per inhabitant. According to Eurostat21, Northern Ireland has a
disposable income per inhabitant of around 91% of the Republic of Ireland average
i.e. 9% less. A comparison of Purchasing Power Standard based on final
consumption per inhabitant for Northern Ireland, the UK and regions of the Republic
Of Ireland are shown below in table 5. The information is also shown graphically on
page 13.
Region PPS disposable income per inhabitant
UK 16,900
Northern Ireland 13,800
Republic of Ireland 15,100
Republic of Ireland (Border, Midland and 13,800
Western)
Republic of Ireland (Southern and Eastern) 15,600
Table 5: Purchasing Power Standard disposable income per inhabitant (2014)
17
https://www.dccae.gov.ie/documents/An%20Objective%20Analysis%20of%20Energy%20Poverty%20
in%20Ireland.pdf
18 http://fuelpovertyni.org/
19 https://www.communities-ni.gov.uk/topics/housing/fuel-poverty
20 https://www.belfasttelegraph.co.uk/news/northern-ireland/northern-irelands-average-pay-packet-is-
8000-lighter-than-one-earned-in-the-republic-29901251.html
21
http://ec.europa.eu/eurostat/en/web/products-datasets/-/TGS00026
121.37 We note that while the average Purchasing Power Standard based on final
consumption per inhabitant for Northern Ireland is lower than the Republic of Ireland
average it is similar to that for the border, midland and western regions of the
Republic of Ireland.
1.38 In conclusion we do not consider that the difference in average income levels
between NI and ROI (as measured by Purchasing Power Standard based on final
consumption per inhabitant) is a major factor in the different level of connection rates
between NI and ROI.
131.39 In relation to the measures available from the respective governments’ to support
domestic owner occupied to convert to natural gas the measures in Northern Ireland
appear to be more generous than in the Republic of Ireland and some of their
measures are specifically targeted at encouraging domestic owner occupied
properties to connect to gas whereas the measures in ROI do not specifically target
conversions to the natural gas network.
1.40 For example in Northern Ireland a significant outlay of expenditure was undertaken
by the NI Executive on various ‘social schemes’ to assist customers in modernising
their heating systems and insulating their homes. These schemes operated
throughout all of Northern Ireland, including the firmus network area. This is in
addition to GDNs’ AMPR spend.
1.41 One such scheme is the Boiler Replacement Allowance. The scheme is open to
Owner Occupiers whose household income is less than £40,000 and who have an
inefficient boiler of at least 15 years old. You are only be eligible to replace your
existing gas boiler if the gas connection to your property was made at least 15 years
ago. The allowance does not apply to Economy 7 heating, stoves used only for
cooking, back boilers or room heaters.
1.42 The grant of up to £1,000 dependent on total gross annual income is available to
help with replacing an inefficient boiler with a more energy efficient condensing oil or
gas boiler; switching from oil to gas; or switching to a wood pellet boiler22. The
customer needs to submit a Boiler Replacement Application Form to begin the
process23.
1.43 Between September 2012 and March 2016 grants for 31,255 replacement boilers
were approved under the Boiler Replacement Scheme, amounting to £21.4 million.
This equates to an average grant of £684 per household. Of these, 25,855
replacements have been completed.
1.44 In the Republic of Ireland grants under government energy support schemes are
administered by the Sustainable Energy Authority of Ireland (SEAI). The UR is not
aware of any grants that are specifically linked to domestic owner occupied
customers connecting to natural gas. Rather there are a range of grants available but
none that give an enhanced grant for choosing gas rather than alternative such as
oil, for example the grant available for installing heating controls as well as a new
boiler is €700 whether the property owner upgrades to gas or oil24.
1.45 The UR also notes that in Northern Ireland Phoenix Gas and Firmus have linked their
advertising campaigns25 to government incentives for domestic owner occupied
property owners to connect to natural gas but that this has not been the case in ROI.
22 https://www.nidirect.gov.uk/articles/grant-to-replace-your-boiler
23 https://www.nihe.gov.uk/boiler_replacement_leaflet.pdf
24 https://www.seai.ie/resources/publications/Better_Energy_Homes_Application_Guide.pdf
25 For example advertising related to boiler replacement scheme.
14Gas Supply Competition
1.46 Historically and currently there is only one gas supplier in the firmus network area i.e.
Firmus Energy Supply Limited.
1.47 In contrast to the situation in the firmus network area there are seven suppliers26 to
the domestic gas market in the Republic of Ireland (at time of writing) and these
companies advertise to attract customers. The CMA considered that ‘advertising
undertaken by gas supply companies in the Republic of Ireland is likely to increase
potential customers’ awareness of gas, and is therefore likely to have an impact on
the level of connections to the gas network. As a result, we consider that it cannot be
assumed that all connections in the Republic of Ireland should be considered as non
additional, in the Republic of Ireland’.
1.48 It is for this reason that we have concluded that the our analysis on the connection
rate in ROI should be amended before determining an upper bound for the non
additional rate for firmus. However we note that this advertising as referred to by the
CMA is undertaken by the gas suppliers and not GNI and therefore could be
regarded as free related advertising which is beneficial to GNI i.e. it is advertising for
which GNI does not incur a cost.
100%
80%
60%
40%
Domestic gas market share over time by customer
20%
numbers
0%
Q1-14
Q4-09
Q1-10
Q2-10
Q3-10
Q4-10
Q1-11
Q2-11
Q3-11
Q4-11
Q1-12
Q2-12
Q3-12
Q4-12
Q1-13
Q2-13
Q3-13
Q4-13
Q2-14
Q3-14
Q4-14
Q1-15
Q2-15
Q3-15
Q4-15
Q1-16
Q2-16
Q3-16
Q4-16
Q1 2017
Q2 2017
Bord Gáis Energy SSE Airtricity Electric Ireland Flogas Energia PrePayPower
Figure 2: ROI Domestic Gas Market to Q2 201727
1.49 Figure 2 shows the development of retail competition in the natural gas market in
ROI since quarter 4, 2009. We have taken account of the potential impact of
advertising associated with retail competition on owner occupied connection numbers
26CRU Communication Guidelines for Suppliers and Network Operators
27https://www.cru.ie/wp-content/uploads/2017/07/CER17019-Review-of-Competition-in-the-
Electricity-and-Gas-Retail-Markets-1.pdf
15by reducing the adjusted 2014 owner occupied connection numbers recorded by GNI
by 22.8%.
1.50 We calculated the potential impact of the advertising associated with retail
competition on owner occupied connection numbers as follows:
Average of 2009 and 2010 one off residential connections i.e. (3997 + 3467) / 2 =
3,732 representing the average number of connections prior to retail competition
taking hold in the ROI.
The average of 2012 to 2014 inclusive one off residential connections i.e. (4,441+
4,631 + 4,676) / 3 = 4583 representing the average number of connections in the
period when retail supply competition became more embedded in ROI.
Therefore the potential percentage age increase due to impact of retail competition =
(4583 - 3732) / 3732 = 22.8%.
We consider that the 22.8% figure to be a maximum potential impact from advertising
in the retail sector and from the evidence in the Greater Belfast area we consider that
the potential increase in connection numbers due to retail competition is likely to
dissipate over time and from our analysis of the Greater Belfast area this could be by
up to 15%.
We have taken account of the potential impact of retail supply competition on
connection numbers by the reducing the actual 2014 mature housing connection
number of 4841 (adjusted for 10% social housing) equals 4357, by 22.8% to give a
figure of 3538. We have used the 3538 figure in our calculation to determine a
revised connection rate in ROI.
Rate of domestic owner occupied connections in ROI
1.51 The UR said in its evidence to the CMA on the non additional assumption, that ‘in
addition in the Republic of Ireland, where there is no allowance for connections, there
were 4,676 28 ‘one off residential’ connections in 2014 (and we understand this
category broadly aligns with DOO Connections). If we use the 15% assumption29 to
determine the number of properties available to connect and calculate a connection
rate, that rate is 1.83%. In other words, 1.83% of properties in the Republic of Ireland
in 2014 connected without any spend by the network operator on sales, marketing or
incentives. This again supports the 1.25% assumption in the case of FE’s area as
being reasonable’.
28 Table 2.5.1 New Connections, page 32 of the 2014 GNI Transmission and Distribution System
Performance Report
29 The CMA FD in para 5.102 concluded that the UR was not wrong in using its 15% assumption as
part of its methodology in deriving target OO connection numbers for firmus for the GD17 price control
period.
161.52 Paragraph 5.139 to 5.143 of the CMA FD30 discusses the UR evidence derived from
OO connection numbers in ROI to support its 25% non additional assumption for
firmus OO connections in the GD17 period. In relation to the 1.83% figure the CMA
stated, ‘it is also not clear how the UR derived its 1.83% figure. While the UR
included a reference to the number of properties that connected in the Republic of
Ireland in 2014, it did not include a reference to the number of properties passed,
which would be required to calculate the connection rate. As a result, we were unable
to verify this calculation’.
The basis of the 1.83% figure
1.53 The basis of the 1.83% referred to be the UR in its evidence to the CMA was
calculated as follows.
1.54 If we take the 2014 connection numbers in ROI for ‘one of residential’ i.e. 4,676 and
divide this by the number of households using oil that have a gas network nearby, or
in other words properties passed but not connected i.e. 300,000 31 * 85% and which
could be readily connected to gas we get a figure of 1.83% i.e. 4676 / 255,000.
1.55 If we compare this to the 5% connection rate discussed in para 6.149 in the GD17
FD i.e. ‘in our view the increased connection target for GD17 reflects the planned
extension of the network. The connection targets are commensurate with the
increase in the number of properties passed but not connected. The 5% connection
rate (of properties passed and not yet connected) is supported by an analysis of
historical connection rates in both the firmus area and PNGL and reflects local
expertise.’
1.56 If we compare the connection rate in ROI based on 2014 data i.e. 1.83% and
compare this to the 5% discussed in the GD17 FD we arrive at 1.83 / 5 = 36.6% or in
other words it could be inferred that in comparing the OO connection rates in ROI to
Firmus and PNGL we can extrapolate that the connection non additional rate in ROI
is 36.6%.
Source of ROI information:
1.57 The main source of data for our calculations that we provided to the CMA for
domestic owner occupied connections in the Republic of Ireland has been obtained
from GNI system performance reports.
30 https://assets.publishing.service.gov.uk/media/5953bfd8e5274a0a69000079/firmus-final-
determination.pdf
31 Page 39 of the 2015 GNI Network Development Plan and page 42 of the 2016 GNI Network
Development Plan
172009 2010 2011 2012 2013 2014 2015 2016
Total length (km) 11,030 11,131 11,218 11,288 11,339 11,52733
distribution system32
One off residential34 3,99735 3,46736 5,983 4,441 4,631 4,676
Mature housing new 5,378 4,722 5,321 4,841 4,544 4,31438
connections37
Total distribution 618,08840 622,573 626,791 630,921 636,012 642,836 649,44541
connections for Dx
NDM RES39
Table 6: OO connection data in ROI 2010 to 2016
1.58 The UR notes that footnote 12 of page 34 of the 2015 GNI systems performance
report states ‘there is often a time lag from when a new connection order is received
to when it is installed. To ensure that the numbers reported are for connections only
rather than a mix of orders and connections there has been an adjustment in how
new connections are reported in 2015. This is to ensure consistency across the
business units that record connections’.
1.59 The UR understands that this explains the variation between ‘mature housing new
connections’ and ‘one off residential’ numbers in the period 2011 to 2014 and that
GNI now records owner occupied new connections only using the mature housing
new connections reporting line.
Update to the 1.83% figure
1.60 Given that we are now aware that GNI now records its domestic owner occupied new
connections against a new reporting line i.e. ‘mature new housing connections’ we
can have updated the calculation we provided in our evidence to the CMA. The
updated calculation also takes account of the fact that GNI estimate that 10% of its
historic mature housing connection figures are related to social housing. GNI also
informed us that this trend is likely to continue in existing areas, although the
percentage of domestic properties for any new areas which are related to social
housing could be higher i.e. up to 30%.
1.61 Our revised calculation therefore takes account of the 10% assumption for social
housing in both historic OO connection numbers as well as for readily connectable
property numbers. We have also sense checked the 10% social housing assumption
32 Table 9.3, page 50 of the 2015 GNI Systems Performance Report (except for 2016 year)
33 Table 9.3, page 66 of the 2016 GNI Systems Performance Report
34 Table 2.5.1 page 32 of the 2014 GNI Transmission and Distribution System Performance Report
(except for 2010)
35 Page 29 of the 2010 GNI Transmission and Distribution System Performance Report
36 Table 2.5.1 page 30 of the 2011 GNI Transmission and Distribution System Performance Report
37 Table 9.4 page 50 of the 2015 GNI Systems Performance Report (except for 2016 year)
38 Table 9.4, page 66 of the 2016 GNI Systems Performance Report
39 Table 9.2, page 49 of the 2015 GNI Systems Performance Report (except for 2010 and 2016 year)
40 Table 2.2.2, page 28 of the 2011 GNI Transmission and Distribution System Performance Report
41 Table 9.2, page 66 of the 2016 GNI Systems Performance Report
18provided by GNI. We used data from the Republic of Ireland Central Statistics office
as follows:
No of domestic occupied properties in 2016: 1,697,665 42
No of domestic properties rented from local authority: 143,17843
143,178 / 1,697,665 = circa 8.4%.
1.62 This updated calculation gives a revised connection rate in ROI of 2.3% and a non-
additional rate of 46%. The calculation is revised to take account of a 10%
assumption for social housing and to align with the GD17 connection model. It also
takes account of the potential impact of retail supply competition in ROI on owner
occupied connection numbers.
2 Conclusions from available
evidence in ROI
1.63 We have considered the use of connection data from other jurisdictions as a basis for
estimating non-additionality. To do so requires data from a developing network and
sufficient differences in the way connections are promoted to allow non-additionality
to be tested.
1.64 We do not believe that there is any useful data in GB where the gas network has
been developed for many years and connection penetration rates are already very
high. There is no need in GB to drive connections of existing properties and no
comparable incentive schemes to promote such connections.
1.65 However, the gas network in the Republic of Ireland is similar to the firmus network in
that it continues to expand and there are still connections of existing properties to be
made, although the development of the network in ROI is well in advance of firmus
energy in terms of age (40 years compared to 10 years) and proportion of properties
passed which have been connected (68% compared to 16%).
1.66 We obtained information on connection numbers and ‘properties passed’ for ROI
drawing on publically available reports published by GNI which provided data back to
2009. We recognised that there are differences between the way properties are
categorised for the purpose of reporting in ROI and NI. We also noted changes in
reporting methodologies in ROI data over the years. As a result, it was necessary to
make a number of assumptions to align data used in our analysis and this introduces
a degree of uncertainty into any comparison.
1.67 We used the connection model developed for GD17 to calculate a connection rate for
the ROI data. This made the same assumptions used in GD17, that 15% of
42 Infographics - CSO - Central Statistics Office
43 http://www.cso.ie/en/releasesandpublications/ep/p-cp1hii/cp1hii/tr/
19properties would never connect and that a constant connection rate would apply to
the remaining properties passed but not connected. This assessment gave a
connection rate for ROI of 2.8% compared to an equivalent connection rate in the
firmus area of 5%.
1.68 The fact that the rate of connections in ROI is lower than that in the firmus area could
be attributed to a number of factors.
GNI has not had the same incentive based funding for advertising and marketing
available to firmus energy. The CRU introduced an incentive for GNI for connections
it attains over and above its projected Business as Usual connections as part of its
PC4 determination which began in October 2017, however this connection incentive
is much more limited than that which is available to firmus in the GD17 period.
The general level of advertising and marketing activity by GNI is not of the same type
and scale as that experienced by firmus energy.
GNI consumers have to contribute €250 for connections whereas firmus are funded
to provide these free of charge with the cost recovered over time through consumer
bills. This is likely to act as a disincentive which will depress connection rates.
Unlike the situation in NI there is no dedicated government incentives in ROI to target
connections to the gas network, rather there are grants in ROI for installing heating
controls as well as a new boiler but the grant doesn’t favour gas over oil.
1.69 Adjusting the ROI connection rate for supply competition gives a connection rate of
2.3% compared to an equivalent connection rate in the firmus energy area of 5%.
This suggests that non-additionality could be as high as 46%.
1.70 While GNI does not have the same incentive based funding for advertising and
marketing available to firmus energy, and the connection charge in ROI will act as a
disincentive to connections, it is possible that GNI’s activities will have some impact
on connection rates. It is reasonable to assume that some part of the connection rate
in ROI will be attributable to GNI activities but this will not be high. Assuming that up
to 50% of connections would not be made without GNI’s limited marketing activities,
we arrive at a range for non additionally of 20% to 45%. Taking account of the
awareness and influence of advertising / activities revealed in our survey of firmus
energy consumers it is reasonable to conclude that non-additionality is at the upper
end of this range.
20You can also read