Winter Storm Uri - Natural Gas Analysis - Prepared for: Texas Oil and Gas Association (TXOGA)
←
→
Page content transcription
If your browser does not render page correctly, please read the page content below
Winter Storm Uri – Natural Gas
Analysis
 Prepared for: Texas Oil and Gas Association (TXOGA)

 April 2021

                                                       ENVERUS.COM | 1
Situational Review and Findings
Texas had one of, if not the, coldest and most impactful winter storms observed in state history during the week of February
12–17. A combination of record winter demand and generation unit outages cascaded into instability and power losses
across the ERCOT power grid, resulting in 4.5 million Texans without electricity at the peak.
This cold snap not only impacted Texas (ERCOT) but also Oklahoma and Louisiana. The Southwest Power Pool (SPP) and
Midcontinent Independent System Operator (MISO) manage the electricity grid for Oklahoma (SPP) and Louisiana (MISO).
In addition, California ISO (CAISO) who manages SP-15’s southern California area was impacted by high natural gas prices
which sent wholesale prices soaring.
Along with natural gas supply, a dip in power generation resources was observed for every fuel type, including coal, wind,
solar and even nuclear.
During the worst of the cold snap, all power generation resources showed a decline in output while demand peaked to
unprecedented levels. Although natural gas production fell significantly during this event, the timeline indicates that power
outages made this decline worse. Even with this decline, data confirms Texas natural gas supply exceeded Texas demand
during this period, although matching the supply to the demand could not be accomplished in all circumstances.
During this event, the peak demand observed was near 70,000 MW on the evening of Sunday, February 14. This level of
demand had never been observed before in the winter season in ERCOT.
Planning for this cold snap by ERCOT was based on 2011 events which, in hindsight, was not as extreme as this February
2021 event. ERCOT could have planned for colder weather, potentially using 1989 as its baseline for preparation.
The timelines included illustrate how events unfolded.

                                                                                                                      ENVERUS.COM | 2
Timeline
The following timelines illustrate how events unfolded.
• First week of February: ERCOT meteorologists reportedly warns Market Participants and the public of the coldest weather of the
  year.
• February 8: ERCOT issues an Operating Conditions Notice (OCN) for an extreme cold weather system approaching Thursday,
  February 11 through Monday, February 15 with temperatures anticipated to remain 32° F or below.
• February 10: ERCOT issues an Advisory for the predicted extreme weather for the ERCOT Region.
• February 12: Governor Greg Abbott declares a state of emergency in all Texas counties ahead of the expected severe winter
  weather.
• February 12: Natural gas supply begins declining through February 15, with February 14 being the most impactful day.
    • Natural gas supply declined ~0.2 Bcf/d and ~0.7 Bcf/d on February 12 and 13, respectively, leading up to February 14.
    • The declines observed on February 12 are within a typical range of drops observed during previous cold weather events.
    • The declines on February 13, although material, were not large enough to cause the power generation failures seen across the
      board.
• February 14: As early as 1:00 AM, power generation reported output limitations or significant capacity was forced offline by the
  extreme weather. At its highest point more than 48.6% of all generation in ERCOT was in forced outage.
    • Natural gas declines showed ~2 Bcf/d declines. Power generation outages exacerbated the drop in natural gas supply, as
       reported by oil and gas operators after the event and survey data compiled and presented in this report.
    • Peak demand observed is near 70,000 MW during the evening.
• February 15: ERCOT enters Emergency Operations Level 3 at 01:20 AM, and does not return to normal operations until 10:35 AM
  Friday, February 19.
     • At least 4.5 million customers were without power and more than 13 million customers had water service interruptions.

                                                                                                                             ENVERUS.COM | 3
ERCOT Timeline – What Happened?

Little Time to Prepare

   Fri. 03 Feb. 2021
                                                                      Wed. 10 Feb. 2021
   ERCOT meteorologist reportedly warns Market
   Participants and the public of coldest weather of                  ERCOT issues an Advisory for the predicted extreme
   the year.                                                          weather for the ERCOT Region.

                                 ERCOT issues an OCN for an extreme cold
                                 weather system approaching Thursday, February             Governor Greg Abbott declares a state of
                                 11, 2021 through Monday, February 15, 2021 with           emergency in all 254 Texas counties ahead of the
                                 temperatures anticipated to remain 32°F or below.         expected severe winter weather.

                                 Mon. 08 Feb. 2021                                         Fri. 12 Feb. 2021

                                                                                                                               ENVERUS.COM | 4
ERCOT Timeline – What Happened?

Event Overview
                                                                                                          Mon. 15 Feb. 2021
 Fri. 12 Feb. 2021                                                                                        Energy Emergency: EEA Level 1: At
                                                    Sat. 13 Feb. 2021 08:43                               00:15, ERCOT at EEA 1 - Reserves below
 Over the week natural gas pipeline flow                                                                  2, 300 MW.
 data shows a significant drop. Spot gas           ERCOT Physical Responsive Capability (PRC),
                                                   which is a measure of online capacity that is          EEA Level 2: At 01:07, ERCOT at EEA 2 -
 prices soar on Friday to over $150/MMBtu                                                                 Reserves below 1, 750 MW. Load
 at HSC (other locations experienced               available to respond quickly to disturbances, falls
                                                   below 3 GW for the first time during the weekend.      resources are being deployed.
 prices as high as $1250 according to
 Natural Gas Intelligence).                                                                               EEA Level 3 With Firm Load Shed: At
                                                                                                          01:20, rotating outages are in progress to
                                                                                                          maintain frequency.

                           ERCOT notes the first major thermal                   ERCOT issues a Watch for a projected
                           generator failure at 04:02. Frequency                 reserve capacity shortage with no market
                           declines to 59.238 Hz, while load was at              solution available for HE 17:00-21:00,
                           55,391 MW.                                            which causes a high risk for an EEA event.

                            Sat. 13 Feb. 2021 04:02                              Sun. 14 Feb. 2021

                                                                                                                                  ENVERUS.COM | 5
ERCOT Power Grid Outage: What Went Wrong?
Could the other
regions have helped
ERCOT?
On Sunday, Feb. 14 Eastern
Interconnect MISO issues a Max
Gen Emergency Alert for Monday,
Feb. 15 for the South Region
during the on peak
hours. Blackouts are experienced
on Monday and Tuesday.
On Monday, Feb. 15 Eastern
Interconnect SPP issues a Gen
Emergency Alert for Tuesday,
Feb. 16 for the South
Region during the on peak
hours. Blackouts are experienced
on Tuesday.

Key Takeaway: Interconnections with
other non-ERCOT regions don’t help
in peak load periods. Connection
doesn't matter if these other regions
don't have power to send.

                                            ENVERUS.COM | 6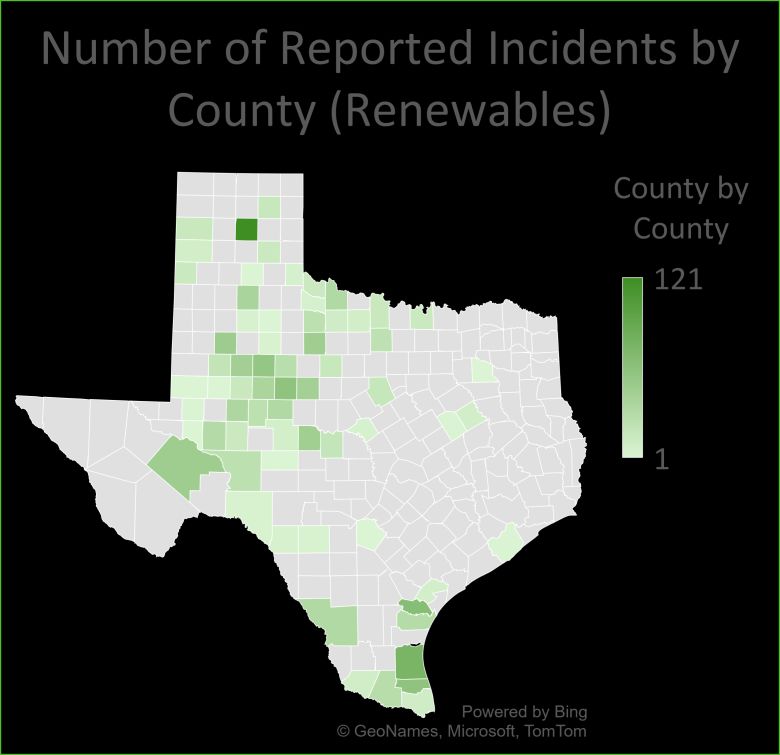
Primary causes for loss of
upstream gas and transmission
Based on survey data whose participants represent over 50% of the natural
gas production in Texas, there were several consistent themes that stood out
related to causes of supply outages. Both upstream and midstream operators
were polled.

Upstream responses identified loss of power and electricity, equipment freeze-
offs, and not being able to get production out due to facilities being shut down
as the causes that influenced operations the most.

Midstream survey responses identified loss of power and lack of production
from upstream as the main causes.

Key Takeaway: The common denominator that caused most disruptions to
both upstream and midstream sectors was the loss of power and electricity.

                                                                                   ENVERUS.COM | 7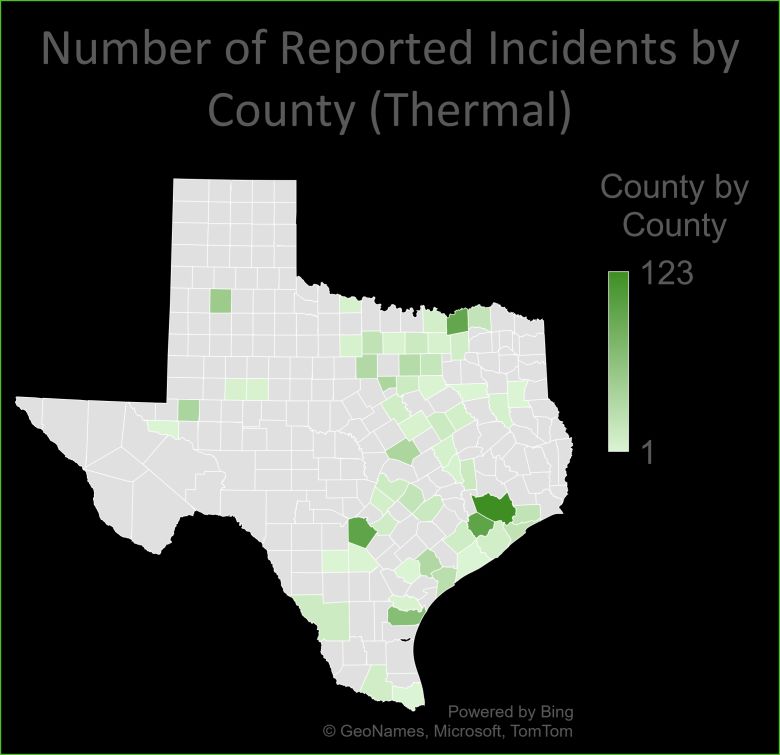
Upstream Analysis
Oil and gas operators that are representative of 51% of natural gas
production in Texas were surveyed with questions regarding their
experiences during Winter Storm Uri and how their operations were
impacted. The focus areas were how much production was affected and the
main causes for production levels to fall off, as well as how and why an
operator’s hydrocarbon transportation was impacted.

Key Takeaway: Upstream survey responses focused on loss of power
(65%), wellhead and equipment freeze-offs (13%) and not being able to get
production out due to issues with third-party facilities (pipelines, gathering,
transmission, processing facilities, plants) (8.7%) as the main causes that
influenced operations.

                                                                            ENVERUS.COM | 8
Upstream Results
This chart shows the average percentage
breakdown of causes for the production lost Production loss causes (Average of participant results)
from upstream operators that responded to
the data collection survey. Loss of power to
the well site and wellhead and equipment
freeze-offs are the most frequently cited Loss of power to the site
reasons for significant production losses.
Third-party issues downstream forcing well
shutdown, and road/crew/truck logistical
Wellhead and equipment freeze-offs
issues are the third and fourth most common
cited reasons, respectively.
In addition to the data, respondents provided Third party issues downstream forcing well
several notable comments highlighting shutdown
logistical issues they experienced.
Specifically: Road/crew/truck – logistical issues including icy
• Road conditions (ice) prevented operators roads limiting movement of personnel
from hauling produced water and oil and
limited their ability to get crews out to the
production sites to make repairs and Communication issues or inability to reach
mitigate wellhead freeze-offs. personnel due to power outages
• Production loss would still have happened
if only well sites retained electricity service
Other
since outages at infrastructure downstream
(including pipelines and other facilities) also
prevented the flow of production. Stable 0%
electricity service from well-site to end user 10%
20%
is necessary to facilitate the supply and 30%
40%
transport of production. 50%
Source | TXOGA Member Responses to Enverus Survey
Other includes: Controlled Shut In of Production and downstream facilities going ENVERUS.COM | 9
down, having power would not have helped if downstream still lost powerUpstream Results
Most of the participants (~91%) are
connected to the grid and this is
Did you experience a drop in production How are your wells, surface facilities and sites powered?
how they operate their sites and
during TX Uri event? (Operators replied for multiple answers)
facilities, which explains why nearly
60% of the operators lost 76%+ of 100% 100%
the production during this weekend, 80% 80%
and the main cause they attribute is
loss of power and electricity. 60% 60%
40% 40%
Equipment freeze-offs and third-
party issues in the midstream 20%
20%
sector are also reasons production
decreased. According to several 0%
0% Connected to Powered by Produced Gas Solar, wind, etc Other
responses from oil and gas Yes No the grid generators
operators, although equipment
freeze-offs forced wells to be
shutdown, this would have been
only a temporary problem if How much did daily production drop on What was the most important factor contributing to
electricity had been available to average from Monday through Wednesday? production loss?
power their equipment and they 100% 70%
were able to communicate with 90% 60%
their crews to dispatch them to well 80% 50%
sites to complete repairs. Both 40%
70%
challenges impacted their ability to
60% 30%
bring production back online
quickly. 50% 20%
40% 10%
30% 0%
20%
10%
0%
0-10% 11-25% 26-50% 51-75% 76+% n/a
Source | TXOGA Member Responses to Enverus Survey
Other for powering sites includes: Combination of electric and natural gas powered ENVERUS.COM | 10
Other for production loss includes: Controlled shut in of production, loss of electricity and third-party takeawayUpstream (Transportation Focus) Results
Of all operators surveyed, only a Is any of your volume contracted for sale to Do you have firm transportation capacity contracts
small percentage were contracted to marketers or end-users outside of TX? on dry gas transmission pipelines to transport your
sell their production to marketers or natural gas?
70% 100%
end-users outside of Texas.
However, it should be noted that it is 60% 80%
typical for operators to enter into 50%
agreements to sell their production at 60%
40%
locations near gathering and 30% 40%
processing, with purchasers often 20%
reselling volumes further downstream 10%
20%
at markets or locations that may be
0% 0%
outside of Texas. Yes No na Yes No na
Nearly 70% of respondents reported
having firm transport contracts for
Do you have firm transportation capacity Approximately what % of your average daily
their dry natural gas production contracts to transport your crude? production can be transported with your firm
volumes, and 60% reported having transport capacity?
firm contracts for their crude oil 70% 70%
production volumes. This indicates 60% 60%
that operational flow orders on
50% 50%
pipelines during the event that restrict
service to firm contracts was not 40% 40%
likely a significant factor that 30% 30%
prevented production transport.
20% 20%
Reported issues with power supply to 10% 10%
infrastructure and wellhead freeze- 0% 0%
offs were likely the primary factors in Yes No na 0-10% 11-25% 26-50% 51-75% 76%+ n/a
the drop in supply.
Source | TXOGA Member Responses to Enverus Survey ENVERUS.COM | 11Midstream Analysis
Midstream companies representing different midstream segments responded to
survey questions about their experiences during Texas’ Winter Storm Uri. The
question focus areas were how much throughput was lost and what were the
main causes that led to downtime.
Key Takeaway: Midstream survey responses focused on loss of power and
lack of production from upstream as the main causes of downtime for
infrastructure.
ENVERUS.COM | 12Midstream Results
What segment of the midstream/downstream industry
Did you have to shut-down your facilities
does your company operate within?
during the TX Uri event?
100%
100%
90% 90%
80% 80%
70% 70%
60% 60%
50% 50%
40% 40%
30% 30%
All companies surveyed 20%
experienced outages at their 20%
10% 10%
facilities at some point during 0%
the event, which also 0% Processing Pipeline - Compressor Terminals Pipeline - Other Pipeline -
Yes No Facility Gathering Station Transmission Distribution
impacted upstream operators.
From reported answers, it can
Did you have to shut-down your pipelines If you shutdown facilities, pipelines, and/or gathering
also be seen that both crude during the TX Uri event? systems, which type of infrastructure was impacted?
and natural gas
100% 45%
infrastructures were impacted.
90% 40%
80% 35%
70% 30%
60% 25%
50%
20%
40%
15%
30%
20% 10%
10% 5%
0% 0%
Yes No Crude Infrastructure Only Natural Gas Infrastructure Both Crude and Natural
Only Gas Infrastructure
Source | TXOGA Member Responses to Enverus Survey
Other includes: Nat. Gas Pretreatment Facility & LNG Liquefaction Terminal and ENVERUS.COM | 13
Fractionators, refineries, co-gen facilitiesMidstream (Transportation Focus) Results
What was the throughput percentage lost Did you have to shut down operations and send back power
during the TX Uri Event? to the grid for emergency usage?
70%
When these midstream 100%
operators were asked to 60% 90%
quantify the volume scope of 50% 80%
the outages, all responses 70%
40% 60%
are in the 51-75% and 76%+
30% 50%
range.
40%
20% 30%
The reported causes of 20%
10%
outages/downtime are highly 10%
attributed to loss of electricity 0% 0%
and lack of production from 0-10% 11-25% 26-50% 51-75% 76%+ Yes No
other upstream facilities and
pipelines.
What were the main causes of downtime for the infrastructure?
These responses are 100%
generally in line with 90%
responses from upstream oil 80%
70%
and natural gas survey data.
60%
50%
40%
30%
20%
10%
0%
Loss of electricity and Lack of production from Road/crew/truck – Other Equipment freeze-offs Communication issues
power upstream to facilities logistical issues
and pipelines
Source | TXOGA Member Responses to Enverus Survey
Other in causes includes: Voluntary shutdown, equipment malfunction (potentially due to ENVERUS.COM | 14
weather) and loss of essential inputs from other facilities like nitrogen and steam.Power Generation – ERCOT
Demand Load
A combination of record winter demand and power unit outages cascaded into
instability and outages across the ERCOT power grid, resulting in 4.5 million
Texans without electricity at the peak.
Key Takeaway: Based on our assessment of available data and the timing of
outages, it is likely the issues started at power generation units.
Key Takeaway: Once power outages began, natural gas production was
impacted because surface facilities and infrastructure relies heavily on
electricity for operations, which then exacerbated the ability for power
generators to receive natural gas supplies.
ENVERUS.COM | 15ERCOT Power Grid Outage: Power Load/Demand
Texas was hit with one of the Load/Demand and Synthetic Measurement of Power Needed but Not Served
coldest winter events in its history.
On Tuesday, Feb. 16, Dallas 80,000
recorded temperatures as low as
-2° F.
70,000
ERCOT reports, as early as
01:00 AM on Saturday, Feb. 14, a 60,000
cascade of power generation
reported output limitations or were
forced offline that was impacted by 50,000
the extreme weather. At its highest
point, more than 48.6% of all
MW
generation in ERCOT was in 40,000
Difference between Actual load and
forced outage. forecasted represents blackout impact
At least 4.5 million customers were 30,000 (power needed was not available)
without power during the event.
More than 13 million customers 20,000
had water service interruptions.
ERCOT entered Emergency 10,000
Operations Level 3 at 01:20 AM
Monday, Feb. 15 and did not return
to normal operations until 10:35 0
2/14/21 6:00
2/14/21 12:00
2/14/21 18:00
2/15/21 0:00
2/15/21 6:00
2/15/21 12:00
2/15/21 18:00
2/16/21 0:00
2/16/21 6:00
2/16/21 12:00
2/16/21 18:00
2/17/21 0:00
2/17/21 6:00
2/17/21 12:00
2/17/21 18:00
2/18/21 0:00
2/18/21 6:00
2/18/21 12:00
2/18/21 18:00
AM Friday, Feb. 19.
ERCOT ordered firm-load shed,
cutting off customers’ power from
01:20 AM Monday, Feb. 15
through the evening of Thursday,
Feb. 18. Date-Time
Actual Load/Demand
PRT Load/Demand Forecast
Deviation (Sythetic Measurment Power Needed but Not Served)
Source | ERCOT
Note: As early as 01:00 on 2/14/2021, two units at NRG’s WA Parish Power Plant reported ENVERUS.COM | 16
output restrictions (capacity derates).ERCOT Power Grid Outage: Temperature Overview
The Seasonal Assessment Minimum Low Temperature For Uri Event By Largest City
of Resource Adequacy
(SARA) for the ERCOT Region 25
Winter 2020/2021 used 2011 as
the load comparison. 21
20
This chart illustrates lowest 20 19
minimum temperatures for the
four main cities in Texas for the
2021 cold snap event and the 15
15 14
eight other events in history. 13 13
The low temperature for 2011, 11 11 11 11 11
Degrees (Fah.)
10 10 10
on a historic perspective, 10 9
was relatively warm compared
to other events. 7 7 7
6 6 6 6
5 5 5
The event in 1989, adjusted for 5 4
current load, transmission,
2 2
population, and resource
variables, may have been a 0 0
better option for extreme winter 0
demand (load) planning. -1 -1
-2
-5
-8
-10
Feb 1895 Jan-1930 Jan-1940 Jan-1949 Feb-1951 Dec-1983 Dec-1989 Feb-2011 Feb-2021
Date
Houston Dallas Austin San Antonio
Source | NOAA, National Weather Service ENVERUS.COM | 17ERCOT Power Grid Outage: Temperature Overview
ERCOT Based the 2020/21 Extreme Winter Peak on the 2011 Winter
This weather comparison Houston
illustrates max/min trends across 50
Degrees (Fah.)
three days of the cold snap 40
events for the four most recent 30
events. 20
10
These comparison charts show
0
2011 was warmer during almost Day 1 Max Day 1 Min Day 2 Max Day 2 Min Day 3 Max Day 3 Min Avg
every day during these cold snap Feb-21 37 26 25 16 35 13 25
periods too. Feb-11 39 21 34 28 31 23 29
Dec-89 34 13 28 7 43 11 23
Dec-83 27 14 28 11 31 18 22
Feb-21 Feb-11 Dec-89 Dec-83
Dallas
35
Degrees (Fah.)
30
25
20
15
10
5
0
-5
Day 1 Max Day 1 Min Day 2 Max Day 2 Min Day 3 Max Day 3 Min Avg
Feb-21 14 4 18 -2 27 18 13
Feb-11 20 13 23 17 29 19 20
Dec-89 29 12 14 3 22 -1 13
Dec-83 15 5 19 11 13 7 12
Feb-21 Feb-11 Dec-89 Dec-83
Source | NOAA, National Weather Service ENVERUS.COM | 18ERCOT Power Grid Outage: Electricity Generation
During this event, the peak was
February ERCOT Hourly Electricity Generation by Fuel Type
observed Sunday evening near
80,000
70,000 MW. This level of demand 2/14 - 2/18
has never been observed before in
the Winter season in ERCOT. 70,000
Traditional resources began going
offline rapidly on Monday morning
(see the dip in the gray area in the 60,000
chart).
A dip in resources was observed in 50,000
every fuel type, even nuclear. During
this event, natural gas (orange)
MW
provided the majority of generation 40,000
but also represented the largest
share of outages. Wind and solar
30,000
generation also dipped during this
time as a result of weather,
equipment freeze-offs, and 20,000
transmission congestion.
At the peak of the event, 20,000 MW
of natural gas generation came 10,000
offline, followed by 6,000 MW of coal,
4,000 MW of wind, and 1,000 MW of
0
nuclear.
Total Generation Coal Natural Gas Nuclear Fuel Oil Hydro Solar Wind Other
ENVERUS.COM | 19Seasonal Assessment of Resource Adequacy (SARA) for the ERCOT Region Winter
2020/2021 Final Version Released 11/5/2020 vs. How Much Power Was Produced by
Fuel Type
Early Monday morning (Feb. 15) power
units of all types began tripping offline.
Approximately 48.6% of generation was
forced out at the highest point due to the
impacts of various extreme weather
conditions.
Controlled outages were implemented to
prevent a statewide blackout. Generation by Fuel Type
90,000
The ERCOT SARA report expected 67.2
GW of peak load which was based on 80,000
the 2011 cold snap. The total resources
that were expected to be available 70,000
during such an event were 71.3 GW, 60,000
which would have been adequate to
meet that load. The top table shows the 50,000
MW
expected capacity by fuel type. The table
40,000
in the next slide shows the power
actually produced by each fuel type 30,000
during the 2021 event.
20,000
However, the 2021 winter event was 10,000
much colder. ERCOT forecasted load
reached 75.8 GW, which far exceeded 0
the resources available. ERCOT’s Sun
Feb
Mon
Feb
Tue
Feb
Wed
Feb
Thu
Feb
Fri
Feb
planning group should have used the 14 15 16 17 18 19
1989 winter temperatures (see page 17).
Wind Generation (MWh) Hydro Generation (MWh) Other Generation (MWh)
Natural gas Generation (MWh) Coal Generation (MWh) Nuclear Generation (MWh)
Solar Generation (MWh) ISO_Forecast (vintage 2/14 HE12)
Source | EIA, ERCOT ENVERUS.COM | 20Power Generation by Fuel Type
All major power generation fuel Nameplate
Natural Gas
Actual Coal Nameplate Nuclear
Capacity ERCOT SARA Generation and SARA are
types underperformed the Peak Capacity 6,000
16,000 equal
expected winter capacity rating 60,000
that was planned in the SARA. 14,000 5,000
50,000 12,000
Actual generation was less than 4,000
50% of the planned generation 40,000 10,000
3,000
for an extreme winter event. 8,000
30,000
2,000
Natural gas power generation 6,000
20,000
units were the worst performing 4,000 1,000
of all fuel types. However, this 10,000 Orange Area is Power 2,000
illustration does not point to Shortfall
0
2/14
2/15
2/16
2/17
2/18
2/19
why the gas plants performed 0 0
2/14
2/15
2/16
2/17
2/18
2/19
2/14
2/15
2/16
2/17
2/18
2/19
worse.
Wind Solar Hydro
Fuel SARA/Short Nameplate
30,000 5,000 600
Type of SARA Capacity/% Source | EIA
Expectations SARA 4,500
25,000 500
(Average) 4,000
3,500
Nat. 48.4/17.3 GW 56.1/92% 400
Gas GW 20,000 3,000
2,500 300
Coal 10.9/5.1 GW 13.6/100% 15,000
GW 2,000
200
1,500
Wind 6.1/1.4 GW 25.0/24% 10,000
GW 1,000
100
500
Nuclear 5.2/0.7 GW 5.2/100% 5,000
0 0
GW
2/14
2/15
2/16
2/17
2/18
2/19
2/14
2/15
2/16
2/17
2/18
2/19
0
Hydro 0.4/0.1 GW 0.5/80%
2/14
2/15
2/16
2/17
2/18
2/19
GW
ENVERUS.COM | 21Storage and Natural Gas –
ERCOT Demand Loads
The entire energy infrastructure chain was under significant stress during the
storm. Texas lost significant natural gas production while local demand
increased.
Key Takeaway: Even with these challenges, Texas natural gas production
exceeded Texas demand during the storm, yet matching supply with demand
proved challenging.
Key Takeaway: Natural gas storage withdrawals increased, however, some
facilities faced power outages and were not able to operate at maximum
levels.
Key Takeaway: Natural gas deliveries to LNG terminals, exports to Mexico,
and exports to other neighboring regions were decreased and a significant
amount of the natural gas available was used to meet demand within Texas.
ENVERUS.COM | 22Texas Natural Gas Supply/Demand Balance and
Pricing
Daily cash prices set all-time records Texas Production, Demand and Prices
across much of the U.S. in mid-
February, with the Intercontinental 30.0
Exchange (ICE) lifting its $999/MMBtu
price cap as some hubs saw
transactions at that level.
25.0
The supply shortage occurred due to
shut-ins across the western half of the
U.S. and extended to markets served
by central and western U.S. supplies, 20.0
including Chicago and SoCal but not
areas served by WCSB, Haynesville or
Appalachian supplies on the margin,
Texas Gross (Bcf/d)
such as Transco Zone 6 or Henry 15.0
Hub.
In Texas specifically, production
dropped while demand spiked [see 10.0
Texas supply vs demand bar in chart],
causing exports via LNG and pipelines Excess
from the state to be curtailed. Like the
Supply
rest of the U.S., cash prices jumped to 5.0
record-high levels, as shown in the
chart on the next page. Houston Ship
Channel (HSC) traditionally trades
near Henry Hub or a cash basis of +/- 0.0
$0.05/MMBtu. However, during the
1/1/2021
1/6/2021
2/5/2021
1/11/2021
1/16/2021
1/21/2021
1/26/2021
1/31/2021
2/10/2021
2/15/2021
2/20/2021
mid-February events, the HSC basis
traded as high as $385/MMBtu (basis
is the difference between the Henry
Hub benchmark and the regional price
hub). Production minus Demand Texas Production Texas Demand
Source | Enverus OptiFlo Gas ENVERUS.COM | 23Production and Price Activity Around the Storm
Each table displays average daily production and prices in key basins over two different periods in February (see legend in lower right).
• The intent is to highlight pre-storm or normal levels as compared to elevated levels experienced during the storm.
• Production (or ‘Prod’) is the Enverus modeled estimate which is grossed up from the observable interstate pipeline sample.
• The peak price for each hub is also displayed in the lower right of each table.
Midwest (Chicago) Northeast
(Transco Z6)
Rockies (CIG) Prod Price
Prod Price
Prod Price 0.2 $3.01
Anadarko (ANR SW) - $4.10
9.8 $3.00 0.2 $12.76
Prod Price - $10.35
10.1 $26.79 - $250.00 Appalachian
6.7 $3.06 (TETCO M2) - $17.00
+0.4 $180.00
5.5 $33.85 Prod Price
-1.2 $300.00 32.8 $2.88
Arkla (Haynesville) 31.8 $6.13
Permian (Waha) ETX (Carthage)
Prod Price
California (SOCAL) -1.0 $9.50
Prod Price Prod Price
8.7 $2.95
Prod Price 6.6 $2.93
12.9 $2.89
7.1 $6.10
0.3 $3.34 6.6 $16.20
4.6 $70.84
-1.6 $6.10
0.3 $37.72 - $67.50
-8.4 $350.00
- $195.00
Houston (HSC) SLA (HH)
STX (Agua Dulce) Legend
Prod Price Prod Price
Prod Price Feb 1-10 (pre-storm)
0.6 $2.98 2.3 $3.04
6.4 $2.99 Feb 17-20 (storm peak)
0.6 $201.80 2.0 $13.26
5.4 $20.26 Production Delta / Max Storm Price
- $400.00 -0.3 $30.00
-1.0 $125.00 ENVERUS.COM | 24Texas Natural Gas Production
Because intrastate pipelines deliver Texas Production Sample by Facility Type and Total Dry Gas (Grossed Up)
so much Texas supply to markets,
tracking daily production levels is 25
more challenging in the state than in
markets served by interstate
pipelines.
Based on Enverus’s sample of 20
interstate receipts and deliveries,
grossed up to account for intrastate
volumes, natural gas production
began to drop off on Feb. 12, when 15
temperatures dropped below
Bcf/d
freezing in Dallas and Austin. As the
deep freeze extended to all counties
in Texas, ~5 Bcf/d of supply was 10
offline. Freeze-offs and pipeline
force majeures cut production.
Based on our samples, the cuts
were steepest in the Permian. 5
Although production has been
almost fully restored, the collapse in
completions and a slower recovery
in frac activity could slow supply 0
recovery in the basin in the months
1/5/2021
2/2/2021
2/9/2021
12/15/2020
12/22/2020
12/29/2020
12/1/2020
12/8/2020
1/12/2021
1/19/2021
1/26/2021
2/16/2021
2/23/2021
ahead.
Wellhead Gathering
Processing Plants Intrastate
Total Dry Gas Production (Grossed up)
Source: Enverus OptiFlo Gas
ENVERUS.COM | 25Texas Natural Gas Inflows/Outflows Deltas
The tables show natural gas pipeline flow changes between the peak of the storm Inflows/Outflows (Bcf/d) Feb 1-10 Feb17-20 Delta
(Feb. 17-20) vs. pre-storm levels (Feb. 1-10):
➢ For the most part, Texas sent less natural gas out, which is represented by
Permian to SW 0.6 0.1 -0.5
outflows showing negative figures. Therefore, Texas sent less natural gas out to Permian to MidCon Prod 1.0 0.5 -0.5
LNG, Mexico and the West (SW toward California).
LNG 3.3 1.0 -2.3
➢ Texas only received more natural gas from South LA (+1 Bcf/d), specifically
from TETCO and Transco pipelines. Mexico 1.7 1.2 -0.5
ArkLa 2.4 0.9 -1.5
Total Outflows 9.0 3.7 -5.3
South LA to Houston 0.9 1.9 +1.0
NE Texas Bcf/d MidCon Prod to NE Texas 0.6 0.1 -0.5
Permian to MidCon Prod Bcf/d Inflows from MidCon Prod -0.5 Total Inflows 1.5 2.0 +0.5
Net Outflows -0.5
NE Texas Bcf/d
Permian to SW Bcf/d
Outflows to ArkLa -1.5
Outflows -0.5
STX Outflows Bcf/d
Houston Bcf/d
LNG (Corpus) -1.1
To LNG (Freeport) -1.2
Via Pipeline -0.5
Inflows from South LA +1.0
Total -1.6
Source: Enverus OptiFlo Gas ENVERUS.COM | 26Texas February Inflows and Outflows
Texas is a net supply state, meaning it produces more than its local demand. Gas moves out of the state via pipelines and LNG terminal facilities.
During the recent storm, these paths were largely impacted.
Permian to Southwest Permian Midcon Prod to NE Texas
0.8 1.4
0.7 1.5 To Midcon Prod 1.2
0.6
Bcf/d
From Midcon Prod 1.0
Bcf/d
0.5
Bcf/d
1.0 0.8
0.4
0.3 0.6
0.2 0.5 0.4
0.1 0.2
0.0 0.0
0.0
2/1/2021
2/8/2021
2/15/2021
2/22/2021
2/1/2021
2/8/2021
2/15/2021
2/22/2021
2/1/2021
2/8/2021
2/15/2021
2/22/2021
South Texas to LNG and MX Houston NE Texas to ArkLa
5.0 LNG Exports Inflows SouthLA 3.0
2.5
4.0 2.5
Bcf/d
Bcf/d
2.0 2.0
3.0 Bcf/d
1.5 1.5
2.0 1.0 1.0
1.0 0.5 0.5
0.0 0.0 0.0
2/1/2021
2/8/2021
2/15/2021
2/22/2021
2/1/2021
2/8/2021
2/15/2021
2/22/2021
2/1/2021
2/8/2021
2/15/2021
2/22/2021
Source | Enverus OptiFlo Gas ENVERUS.COM | 27Underground Natural Gas Storage
EIA South Central Region comprises the Texas Gas Infrastructure Map
states of TX, LA, OK, KS, AR, MS and AL.
Texas has 30 storage fields, which represent
35% of the working gas capacity of the
region.
A record-high withdrawal of -156 Bcf was
reported by EIA for the week ending Feb.
19. This withdrawal could have been higher,
but power outages and other operational
conditions due to the extreme temperatures
limited the ability to bring more natural gas
to the market.
EIA South Central Region
100
50
0
-50
-100
-150 -153
-156
-200
2010
2011
2012
2013
2014
2015
2016
2017
2018
2019
2020
2021
Source | Enverus OptiFlo Gas, EIA ENVERUS.COM | 28Texas Storage Sample from Pipeline Data
There are five natural gas storage facilities Texas Gas Storage Facilities – Net Storage Withdrawals
observable in the pipeline flow data. Storage
activity around Winter Storm Uri is shown in the
chart.
Keystone Golden Triangle Tres Palacios Katy Moss Bluff
Even though the sample is small (~15%), it
provides some insight into how storage facilities
responded during this critical time. 0.5
Storm Uri
Three out of the five fields reported lower 0.4
withdrawals during the storm. Tres Palacios was
one of these facilities and a Critical Notice was 0.3
issued indicating loss of power as the reason.
Injections (-), Withdrawals (+)
The other two fields, Keystone and Moss Bluff, 0.2
did report higher withdrawals during the storm,
providing much-needed supply to the Texas 0.1
market.
0.0
-0.1
-0.2
-0.3
-0.4
-0.5
2/10/2021
2/11/2021
2/12/2021
2/13/2021
2/14/2021
2/15/2021
2/16/2021
2/17/2021
2/18/2021
2/19/2021
2/20/2021
2/21/2021
2/22/2021
Source | Enverus OptiFlo Gas ENVERUS.COM | 29Pipeline Notices
Pipeline notices are published in Pipeline
Pre- Storm
OFO/FM During the Storm
Power
natural gas pipeline portals called (Weather Alerts) Outage
EBBs (Electronic Bulletin Boards) to Washington gas storage (NM) on maximum
communicate with shippers and El Paso 2/10 SOC/COC: 2/12-18 withdrawal. Permian basin supply losses -
natural gas market players. due to freeze offs
Various locations at risk for transport. IT
NGPL 2/10-High demand - -
A summary of these notices is storage also limited.
included in the table: Tennessee - OFO: 2/12-2/20 - -
Restricted IT and secondary out of path
➢ Pre-Storm (Weather Alerts): Texas Eastern - OFO: 2/12-2/20
volumes.
-
Some pipelines sent critical Texas Gas 2/10 - - -
notices as early as Feb. 2nd Notices of some Texas meters having
notifying of the colder-than- Transco - - -
capacity reduced.
normal temperatures in the Black Marlin - - - -
forecast. Cimarron 2/15 - 2/15-2/23: lack of supply volumes -
➢ Pipelines in stress. Due to the Golden Pass - FM: 2/16-2/17 - 2/16
storm, most pipelines declared Golden Triangle - - - -
either an OFO (Operational Flow Gulf States - - - -
Order), SOC/COC (Strained and High Island - - - -
Critical Operating Condition) or Tiger - - Underperforming meters in LA -
FM (Force Majeure). During Tres Palacios - FM: 2/15-2/18 - 2/15-2/17
these events, only firm and ANR - - - -
primary receipt and delivery Supply advisory, Human needs
nominations are accepted. Enable - OFO: 2/10-2/18
requirements
-
➢ During the Storm: Notices about Florida Gas 2/2: Operational Alerts - Operational alerts: tolerance 5-15% -
pipeline imbalances and lack of Gulf South - - - -
supply. MRT - OFO: 2/11-2/18 - -
Panhandle 2/3 OFO: 2/15-2/18 - -
➢ Loss of power was only Northern Natural - FM: 2/15-2/16 - -
announced at 2 of the 24 Southern Star 2/2 OFO Storage: 2/15-2/17 Underperforming notices due to imbalances -
systems reviewed: Golden Pass
Transwestern 2/11 - - -
and Tres Palacios.
Trunkline 2/3 OFO: 2/17-2/19 - -
Source | Enverus, Pipeline EBBs Note: Primary receipt and delivery meters are defined in contracts. During OFO events shippers can only nominate ENVERUS.COM | 30
to/from, from these primary meters and lose flexibility to nominate to other meters (or out of path meters).Power Demand for Natural Gas During the Storm
Natural gas pipeline data indicates Demand by Sector - Pipeline Sample
power and residential/commercial
meters were up significantly during 2.5 60
the peak of the storm (Feb. 17-20)
compared to pre-storm levels (Feb. 2.0 50
HDD-Temperature
1-10) and post-storm levels.
40
However, power demand after Feb. 1.5
Bcf/d)
14 declined, as power service 30
necessary for natural gas midstream 1.0
infrastructure to operate was offline 20
and remaining available natural gas
0.5 10
supplies were prioritized for home
heating. Residential/commercial
natural gas demand was more 0.0 0
2/1/2021
2/2/2021
2/3/2021
2/4/2021
2/5/2021
2/6/2021
2/7/2021
2/8/2021
2/9/2021
2/10/2021
2/11/2021
2/12/2021
2/13/2021
2/14/2021
2/15/2021
2/16/2021
2/17/2021
2/18/2021
2/19/2021
2/20/2021
2/21/2021
2/22/2021
2/23/2021
2/24/2021
2/25/2021
2/26/2021
2/27/2021
2/28/2021
consistent through the peak period.
The industrial facility sample
decreased over the same time
period, as service to homes for
Date
heating and power plants was
prioritized.
Industrial Power ResCom HDD-Degrees
Definition of Heating Degree Day Feb. 17-20 vs Feb. 1-10 Bcf/d %
(HDD): The number of heating Industrial -0.03 -43%
degrees in a day is defined as the
difference between 65°F and the
mean temperature (average of the Power +0.15 +12%
daily high and daily low).
Residential/Commercial +0.32 +112
%
Total Inflows +0.45 +28%
Source | Enverus OptiFlo Gas ENVERUS.COM | 31Generator Failures
Power generators across the state of Texas failed.
Key Takeaway: Power generators in South Texas were more suspectable to
outages as their tolerance for cold weather is lower. Power plants around the
Houston area were also especially vulnerable to the cold weather. In addition,
some of the older wind generators in West Texas saw heavy capacity
reductions.
ENVERUS.COM | 32Capacity Reduction Incidents (Derate/Outages) by
Resource Class from February 10 – 19, 2021
Widespread issues were observed in
South Texas. Kenedy County appeared
to have a disproportionate number of
issues during the event.
Older wind farms in West Texas near
Scurry and Nolan Counties also
appear to have had an inordinate
number of reported capacity related
incidents.
Thermal resource incidents and
outages were heavily focused in the
Houston area. Harris and Fort Bend
Counties experienced a significant
number of capacity incidents.
ENVERUS.COM | 33Capacity Reduction Incidents (Derate/Outages) of
Units by Resource Class February 15 00:00-02:00
Between Midnight and 02:00 AM, the
power units that tripped offline were
localized south of Austin.
A large unit in North Texas tripped with
a significant amount of capacity offline
at 13,700 MW.
KIAMICHI ENERGY FACILITY
reported several incidents at 00:30
AM.
South Texas wind farms comprised the
majority of renewable capacity
reductions during this time.
The quick succession of outage
observed in this limited timeframe,
combined with the wide geographic
location of these outages indicates the
initial problems did not occur as a
result of natural gas supply outages,
but instead likely occurred due to other
reasons at the power generation level.
ENVERUS.COM | 34Capacity Reduction Incidents (Derate/Outages) of
Units by Fuel Class from February 10 – 16, 2021
Wind units were reporting capacity
Capacity Reduction Incidents (Derates/Outages) by Fuel Class
reductions as early as Wednesday, 45
Feb. 10, likely due to icing of the
turbine blades and similar weather- 40
related issues.
These issues with the wind farms 35
persisted through the cold snap
event and contributed to grid 30
Incident Counts
instability.
25
20
15
10
5
0
2/10
2/11
2/12
2/13
2/14
2/15
2/16
2/17
2/18
2/19
Date
COAL NG WIND
ENVERUS.COM | 35Capacity Reduction Incidents (Derate/Outages) by
Fuel Class from February 14 – 16, 2021
Capacity Reduction Incidents (Derates/Outages) by Fuel Class
Natural gas was the dominant fuel 45
class to report capacity reductions
for power generation during the
event, followed by derates/outages 40
at wind farm sites.
35
Capacity reductions at coal plants
Hourly Count of Incidents
increased during the peak of the
blackouts. 30
25
20
15
10
5
0
2/14/ 2/15/ 2/16/
2021 2021 2021
COAL NG WIND SOLAR
ENVERUS.COM | 36Capacity Reduction Incidents (Derate/Outages) by
Generator Owners from February 12 – 19, 2021
Top 3 Generation Owners in ERCOT
NRG in the Houston area 9
had a large number of 8
Incident Count
capacity related issues over 7
the course of the event. 6
5
The other two top generation 4
owners show increased 3
capacity related issues later 2
in the week. 1
0
For all other Generation 2/12 2/13 2/14 2/15 2/16 2/17 2/18 2/19
Owners, the capacity related Date
issues increased CALPINE CORP (RE) LUMINANT GENERATION COMPANY LLC (RE) NRG TEXAS POWER LLC (RE)
substantially during the heart
of the blackout event. This All Other Generation Owners in ERCOT
data represents an
50
aggregation of incidents for Incident Count
each hour; the high incident 40
count in the bottom chart is a
result of the large number of 30
individual plant operators. 20
10
0
2/12 2/13 2/14 2/15 2/16 2/17 2/18 2/19
Date
OTHER GEN OWNERS
ENVERUS.COM | 37Capacity Reduction Incidents (Derate/Outages) by
Plant from February 12 – 19, 2021
Incident Counts By Hour For Each Plant
This chart illustrates the count
of incidents by plant and by 14
hour. You can see issues in a
large number of plants across
the cold snap event, with some
12
facilities even experiencing up
to 12 incidents in one hour
during the peak outage period
of Feb. 15-17. 10
Incident Count
8
6
4
2
0
2/12 2/13 2/14 2/15 2/16 2/17 2/18 2/19 2/20
ENVERUS.COM | 38Key Takeaways
• Based on our assessment of available data and the timing of outages, it is likely the issues started at power generation units.
• Once power outages began, natural gas production was impacted because surface facilities and infrastructure relies heavily on
electricity for operations, which then exacerbated the ability for power generators to receive natural gas supplies.
• Power generators across the state of Texas failed. Power generators in South Texas were more suspectable to outages as their
tolerance for cold weather is lower. Power plants around the Houston area were also especially vulnerable to the cold weather. In
addition, some of the older wind generators in West Texas saw heavy capacity reductions.
• Interconnections with other non-ERCOT regions don’t help in peak load periods. Connection doesn't matter if these other regions
don't have power to send.
• The entire energy infrastructure chain was under significant stress during the storm. Texas lost significant natural gas production
while local demand increased. Even with these challenges, Texas natural gas production exceeded Texas demand during the storm,
yet matching supply with demand proved challenging.
• Natural gas storage withdrawals increased, however, some facilities faced power outages and were not able to operate at maximum
levels.
• Natural gas deliveries to LNG terminals, exports to Mexico, and exports to other neighboring regions decreased and a significant
amount of the natural gas available was used to meet demand within Texas.
• The common denominator that caused most disruptions to both upstream and midstream sectors is the loss of power and electricity.
• Upstream survey responses focused on loss of power (65%), wellhead and equipment freeze-offs (13%) and not being able to
get production out due to issues with third-party facilities (8.7%) as the main causes that influenced operations.
• Midstream survey responses focused on loss of power and lack of production from upstream as the main causes of downtime
for infrastructure.
ENVERUS.COM | 39Strategy & Analytics Group
CONTACT sag@enverus.com
1-888-290-7697
Enverus
8000 S. Chester St., Suite 100
Centennial, CO 80112
ENVERUS.COM | 40Power Generation Sources
Data
File Name : Unit_Outage_Data_20210312.xlsx
• Source: http://ercot.com/content/wcm/lists/226521/Unit_Outage_Data_20210312.xlsx
• Description: ERCOT disclosure of all generator outage data from the winter storm.
• Page Reference: Pg.1
File Name : EIA_930_data_through_2021-02-19.csv
• Source: https://www.eia.gov/beta/electricity/gridmonitor/dashboard/electric_overview/US48/US48
• Description: Hourly generation data for each fuel type through the winter event.
• Page Reference: Pg.5, Pg.6
File Name : ERCOT_Operations_Messages_through_2021-02-19.xlsx
• Source: http://www.ercot.com/services/comm/mkt_notices/opsmessages
• Archived: February 19, 2021 09:10 AM
• Description: All ERCOT Operation messages though the winter event.
• Page Reference: Pg.4, Pg.5
File Name : ERCOT_SARA-FinalWinter2020-2021.xlsx
• Source: http://www.ercot.com/gridinfo/resource
• Description: ERCOT Winter 2020-2021 Seasonal Assessment of Resource Adequacy (SARA), Final Version.
• Page Reference: Pg.4, Pg.5
Report
File Name: ERCOT_Urgent_Board_of_Directors_Meeting_2-24-2021.pdf
• Source: http://www.ercot.com/content/wcm/key_documents_lists/225373/Urgent_Board_of_Directors_Meeting_2-24-2021.pdf
• Description: Review of February 2021 Extreme Cold, Weather Event – ERCOT Presentation
• Page Reference: Pg.1, Pg. 4, Pg. 5
ENVERUS.COM | 41You can also read