2018 TEXAS CIVIC HEALTH INDEXTM - Moody College of Communication
←
→
Page content transcription
If your browser does not render page correctly, please read the page content below

2018 TEXAS
CIVIC HEALTH INDEX TM
NAT IONAL CONFERENCE ON C I T IZENSHIP                                  THE ANNE T T E S T R AUSS INS T I T UT E FOR C I V IC L IFE
The National Conference on Citizenship (NCoC) is a congressionally      The Annette Strauss Institute for Civic Life in the Moody College of
chartered organization dedicated to strengthening civic life in         Communication at The University of Texas at Austin was founded
America. We pursue our mission through a nationwide network             in the year 2000 on the belief that active, engaged citizens are
of partners involved in a cutting-edge civic health initiative and      made, not born, and that society benefits from increased citizen
our cross-sector conferences. At the core of our joint efforts is the   participation in civic life. The Institute’s focus is in four areas –
belief that every person has the ability to help their community and    civic campus, civic schools, civic communities, and civic nation.
country thrive. ncoc.org                                                These areas drive the Institute’s research and educational
                                                                        programs, prepare ordinary citizens for extraordinary leadership,
                                                                        participation, and to have an impact at home, school, work, in the
RGK CENT ER FOR PHIL ANTHROP Y AND COMMUNI T Y SERV ICE                 community and society. The Institute bears the name of Annette
The RGK Center for Philanthropy and Community Service prepares          Greenfield Strauss, former mayor and member of the Dallas City
the next generation of nonprofit and philanthropic leaders              Council and seeks to honor her legacy as a respected elected
through graduate education and research. Research areas                 official, philanthropist, and active citizen. annettestrauss.org
address pressing issues in philanthropy, nonprofit management,
sustainable community leadership, and global civil society. The
RGK Center’s collective work, ranging from graduate course
offerings to international exchange programs, new books, and
publications, is all focused on helping the nonprofit leaders of
today and tomorrow make informed and innovative contributions
to the public good. rgkcenter.org

This report was produced in collaboration with the National Conference on Citizenship, the Annette Strauss Institute for
Civic Life, the RGK Center for Philanthropy and Community Service, Leadership Austin, the Austin Community Foundation,
KLRU - TV, and KUT Radio.
TA BL E OF CON T EN T S
Texas Civic Health Checkup..............................................................................................................................................................4                     AUTHORS:
Political Participation............................................................................................................................................................................5
                                                                                                                                                                                                              Jay Jennings, PhD, Postdoctoral Fellow,
Civic Involvement & Social Connectedness.......................................................................................................................9                                              Annette Strauss Institute for Civic Life
Recommendations & Conclusion............................................................................................................................................. 12
Technical Note.......................................................................................................................................................................................... 13   Emily Einsohn Bhandari, MPAff, MSSW,
                                                                                                                                                                                                              Director of Public Engagement, Annette
                                                                                                                                                                                                              Strauss Institute for Civic Life
HOW TO READ THIS REPORT
The U.S Census Bureau’s Current Population Survey (CPS) asks questions to approximately                                                                                                                       CONTRIBUTORS:
60,000 households nationwide. This survey includes occasional supplements on topics such
                                                                                                                                                                                                              Jeff Coates, Research and Evaluation
as volunteering, civic engagement, and voting. From that data, this report focuses on: 1) the
                                                                                                                                                                                                              Director, National Conference on Citizenship
rates of political, civic, and social engagement among Texans; 2) state-by-state comparisons,
and 3) other factors that correlate with the overall rates of participation, such as income,                                                                                                                  Lisa Matthews, Program Director, National
education, and age of the population. The survey findings reported here, unless otherwise                                                                                                                     Conference on Citizenship
noted, are obtained from the CPS data. The year for each of the findings ranges from 2013 to
2017, and the exact year is noted in each section.                                                                                                                                                            Susan Nold, JD, Director, Annette Strauss
                                                                                                                                                                                                              Institute for Civic Life
While the report findings are based on a scientifically rigorous sample of citizens, it is important
to note that each data point has a small margin of error. Therefore, the numbers reported here                                                                                                                Patrick Bixler, PhD, RGK Center for
should be considered thoughtfully. Small numeric differences across groups of citizens may not                                                                                                                Philanthropy and Community Service
be meaningful either substantively or statistically. For more background on the issues covered
in this update, please access the 2013 Texas Civic Health Index by visiting the Annette Strauss                                                                                                               The Annette Strauss Institute for Civic
Institute for Civic Life website at annettestrauss.org.                                                                                                                                                       Life thank the staff of its national partner,
                                                                                                                                                                                                              the National Conference on Citizenship,
A note on race: Texas is a diverse state made up of 53% Non-Hispanic whites, 29% Hispanics,                                                                                                                   for its guidance and support, particularly
13% African-Americans, and 4% Asians. The analysis below, however, does not evaluate                                                                                                                          its Program Director, Lisa Matthews. The
measures of civic health according to race. A long and rich history of academic research has                                                                                                                  Institute is also indebted to the many
consistently found that differences in participation and engagement across races are largely                                                                                                                  community collaborators who provided
driven by socioeconomic factors.1 Because data cited in this report could not account for                                                                                                                     support for this report.
individual-level socioeconomic differences, results are not presented according to race in order
to avoid conclusions misattributing race as a cause for differences in civic health.

1 Marvin Olsen (1970) “Social and political participation of blacks”; Jan Leighley and Arnold Vedlitz (1999) "Race, ethnicity, and political participation”; and Frederick Solt. (2010).
“Does economic inequality depress electoral participation?”
T E X A S C I V IC H E A LT H C H EC K U P

                                                         Thriving communities and a healthy democracy depend on active
                                                         citizen participation. Through political engagement, citizens have
                                                         an opportunity to influence governmental action and the policies
                                                         that affect their lives. By joining groups, volunteering, donating, and
                                                         helping neighbors, citizens have an opportunity to directly impact
                                                         their communities and enrich the lives of others around them.
                                                         Research has shown that when levels of political participation,
                                                         community involvement, and social connectedness are relatively
                                                         high, a state enjoys the benefits of civic health.

                                                         We think of “civic health” as the way that communities are organized to define and address public
                                                         problems. Communities with strong indicators of civic health have higher employment rates, stronger
                                                         schools, better physical health, and more responsive governments.2

                                                         The importance of these actions, and the lack of information we know about them, led the Annette
                                                         Strauss Institute for Civic Life to publish the first Texas Civic Health IndexTM (CHI) in 2013. Given the
                                                         state’s rapidly growing and changing population demographics, and our nation’s evolving political
                                                         landscape, the civic habits of Texas’ residents deserve revisiting. This report provides an update to
                                                         the 2013 Texas CHI and presents an assessment of civic health in Texas in 2018.

                                                         Key Findings
Communities with                                                  ■■ P
                                                                      olitical participation remains extremely low. Based on figures from the 2016 general
strong civic health have                                             election, the state ranked 44th in voter registration and 47th in voter turnout among the
                                                                     50 states and the District of Columbia. This ranking is a slight improvement from the 2013
higher employment
                                                                     Texas Civic Health IndexTM, where Texas was ranked last (51st) in voter turnout during a
rates, stronger schools,                                             midterm election year.
better physical health,
and more responsive                                               ■■ A
                                                                      dislike for the candidates and the issues is the reason Texans did not vote in 2016.
governments.                                                         In contrast, the top reason given for not voting in 2012 was “too busy” or had a “conflict
                                                                     with work” and dislike of the candidates and issues ranked a distant third.

                                                                  ■■ T exans do not regularly talk about politics. When asked how frequently they talk about
                                                                      politics with friends and family, only 23% say they do so often – ranking the state 50th in
                                                                      the nation.

                                                                  ■■ D
                                                                      onating and volunteering is not a priority for many Texans. Texas ranks in the bottom
                                                                     quarter of states in supporting charitable organizations: 46% of Texans donate at least
                                                                     $25 to a charitable organization annually and 23% report doing volunteer work in their
                                                                     communities in the past year.

                                                                  ■■ T exans make relatively good neighbors. Texans rank slightly above the national average
                                                                      and 24th among the states and the District of Columbia in doing favors for their neighbors.

                                                              1

                                                              2   National Conference on Citizenship, Civic Health Index, ncoc.org

4 2 0 1 8 T E X A S C I V I C H E A LT H I N D E X T M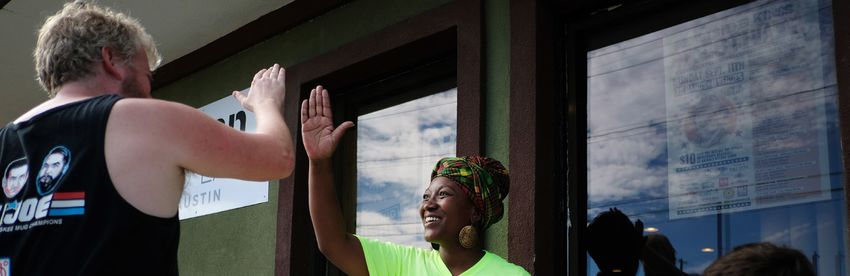
P OL I T IC A L PA RT IC I PAT ION
Robust political participation is fundamental to civic health. A resilient democracy requires citizens
who vote regularly. Texas ranks lower than most other states in political participation.

Voter Registration and Turnout
U.S. citizens are required to register before being eligible to vote. In voter registration, Texas ranks 44th
out of the 50 states and the District of Columbia, with only 68% of all eligible citizens being registered
to vote. This is well below the national leader, District of Columbia, where 82% of citizens are registered
to vote.

In Texas, there is a great disparity among age groups when it comes to voter registration, with older
Texans being registered to vote at much higher levels than younger Texans. For the 2016 general
election, only 48% of Texans ages 18 to 24 were registered to vote, while 78% of Texans over the
age of 65 were registered. The voter registration level of older Texans is nearly identical to their U.S.
counterparts. The national average for state voter registration among those ages 18 to 24 is 55%.
Texas ranks 7 percentage points below the national average for the youngest age group. This problem
is amplified by the fact that Texas’ electorate is younger than the national average.

Chart 1. Voter Registration by Age
 90%

 80%                                                                                                  78% 78%
                                                                                        74%   75%
                                                                   72% 73%
 70%                                               68%
                                                         70%
                                        65%
 60%                              60%
                 55%
 50%       48%

 40%

 30%                                                                                                                    Only 32% of Texans
 20%                                                                                                                    ages 18-24 voted in the
 10%                                                                                                                    2016 election.
  0%
             18-24                 25-34             35-44            45-54                55-64     65 and older

                                                           Texas   U.S.

The figure below describes the strong relationship between educational attainment and voter registration
and turnout. Only 32% of Texans with no high school diploma voted in 2016, while 74% of those with a
bachelor’s degree turned out to vote.

Chart 2. Voting Registration and Turnout by Education in Texas
 90%
                                                                                                             82%
 80%
                                                                                     73%               74%
 70%
                                                         62%                   61%
 60%

 50%                    46%                       47%

 40%
                  32%
 30%

 20%

 10%

  0%
                 Less than H.S.                  H.S. Diploma                 Some College          Bachelor’s Degree
                    Diploma
                                              Voter Turnout        Voter Registration

                                                                                                                                                  5
In 2010, a midterm election year, Texas ranked dead last (51st) compared to other states and the District
of Columbia for voter turnout. In 2016, a presidential election year, Texas ranked 47th, with 55% of
citizens voting in the general election. While Texas’s rank has slightly improved, it is still well behind the
national average of 61%. Texas continues to be one of the lowest-ranked states in the nation in both voter
registration and voter turnout.
As was seen with voter registration, voter turnout is the lowest in the youngest age groups. Only 32% of
Texans ages 18 to 24 voted in the 2016 election. This is 11 percentage points less than the national
average of 43% for the same age group. Older Texans voted at a much higher rate, although still below
the national average in every age group.
Chart 3. Presidential Election Year Voter Turnout in Texas and the U.S. (1972-2016)
80%
65.5 64.9 67.7
70% 61.6 64.0 63.8 63.6
63.2 61.8 61.4
58.4 59.5
60% 62.3
59.4 59.2 57.1
55.0 55.9 56.1
50% 53.2 51.5
54.1 53.8 55.4
40%
30%
20%
10%
0%
1972 1976 1980 1984 1988 1992 1996 2000 2004 2008 2012 2016
U.S. Texas
Chart 4. Voter Turnout in 2016 by State
75%
Photo Credit: Daemmrich Photography
70%
Texas ranked 47th in 65%
voter turnout and 44th
60%
for voter registration
55%
for the 2016
50%
presidential election.
45%
40%
HAWAII
WEST VIRGINIA
TENNESSEE
NEW MEXICO
TEXAS
OKLAHOMA
KENTUCKY
ALABAMA
NEW YORK
CALIFORNIA
INDIANA
ARKANSAS
SOUTH DAKOTA
FLORIDA
GEORGIA
ARIZONA
NEVADA
RHODE ISLAND
KANSAS
ALASKA
UNITED STATES
NEW JERSEY
LOUISIANA
SOUTH CAROLINA
IDAHO
DELAWARE
VERMONT
PENNSYLVANIA
UTAH
IOWA
OHIO
ILLINOIS
CONNECTICUT
NORTH DAKOTA
MICHIGAN
MISSOURI
WYOMING
MARYLAND
MONTANA
WASHINGTON
OREGON
MASSACHUSETTS
NEBRASKA
NORTH CAROLINA
MISSISSIPPI
VIRGINIA
MINNESOTA
NEW HAMPSHIRE
COLORADO
WISCONSIN
MAINE
DISTRICT OF COLUMBIA
6 2 0 1 8 T E X A S C I V I C H E A LT H I N D E X T M
Reasons for Not Voting
The chart below lists the various reasons Texans chose not to vote in the 2016 presidential
election. The most frequent response (28%) was they “didn’t like the candidates or campaign
issues.” This is a notable departure from the response given in 2012, when only 13% of Texans
avoided voting because of dislike of the candidates and issues. In 2012, the most common reason
for not voting was shared by 21% of Texans who were “too busy” or had a “conflict with work.”

Chart 5. Reasons for Texans Not Voting in 2016

        Didn’t like candidates or                                                Too busy, conflicting work or school 20%
        campaign issues 28%

                                                                                                Not interested, felt my vote
                                                                                                wouldn't make a difference
                                                                                                13%
        Inconvenient hours 4%

        Bad weather
        conditions
The impact of education is particularly evident when looking at those who have contacted an
                                                         elected official. As can be seen from the graph below, only 3% of those with no high school
                                                         diploma report contacting an official, compared to 26% of those with a four-year college degree.

                                                         Chart 7. Contacting an Elected Official at Least Once Per Year by Education Level
                                                          30%
         DISCUSSING POLITICS                                                                                                                  26%
       WITH FRIENDS AND FAMILY                            25%

                                                          20%
              100%                                                                                                      16%
                                                          15%

                                                          10%
                                                                                                    6%
                                                           5%                 3%

                                                           0%
                                                                         Less than H.S.        H.S. Diploma         Some College       Bachelor’s Degree
                                                                            Diploma

                                                         For those under age 30, the most common form of non-voting political participation is signing a
                                                         petition. Of those 18-to-29 years old, 25% report having signed a petition.

           DC 1                                          Discussing Politics
          48%
                                                         A regular practice of discussing politics with family and friends is an indicator of vibrant civic health.
                                                         Texas, however, ranks 50th in the nation, with only 23% of Texans saying that they frequently
                                                         discuss politics. This is less than half of the percentage of respondents from the national leader
                                                         – the District of Columbia – who talk about politics with their family and friends at a rate of 48%.
    U.S. Avg.
         27%
          TX 50
        23%                                              Social and economic factors predict how often Texans talk about politics. Those with lower income
                                                         and less education discuss politics with less frequency. Texans earning less than $35,000
                                                         annually profess frequently discussing politics only 14% of the time, while those making more
                                                         than $75,000 annually report talking about politics 33% of the time. The graph below shows a
                                                         similar correlation by education level.
                  0%
                                                         Chart 8. Frequently Talks About Politics by Education Level in Texas
      Texas ranks 50th with
                                                          40%
      only 23% discussing                                                                                                                     37%
                                                          35%
      politics with family or
      friends.                                            30%

                                                          25%                                                           24%

                                                          20%                                      18%

                                                          15%
                                                                             11%
                                                          10%

                                                           5%

                                                           0%
                                                                         Less than H.S.        H.S. Diploma         Some College       Bachelor’s Degree
                                                                            Diploma

8 2 0 1 8 T E X A S C I V I C H E A LT H I N D E X T M
CIVIC INVOLVEMENT & SOCIAL CONNECTEDNESS
Non-political community action is indicative of civic health. Rates of donating to a charity,
volunteering and group involvement, and social connectedness are each measures of the strength
of our social bonds and the resilience of our communities.

Donating
In Texas, donating money is the most common form of civic involvement, with 46% of Texans
reporting they give at least $25 annually to a charitable organization. This rate is lower than most
other states, ranking Texas 40th. Utah is the leader, with 65% of residents donating money.

Older and more educated Texans are more likely to donate to charitable organizations. Texans in
the 18-to-24 age range donate at the rate of 24%, with a steady increase across age groups to 60%
of those age 65 and older donating. Those Texans without a high school degree donate at a 27%
rate, while 67% of those with a bachelor’s degree or higher donate.

Volunteering
Another way for citizens to contribute to their community is to volunteer their time and energy.
In Texas, only 23% of respondents said they volunteered in the past year. This puts Texas in the
bottom third of states – ranking 39th. While the national average is only 25%, the highest rate was
found in Utah where 39% report volunteering in the past year.

Again we see those more educated and with higher income levels volunteering at a higher level.
Differences arise, however, when we look at the relationship between age and volunteering. While
those in the 18-to-24 age range are again in the lowest category, only volunteering at a rate of
                                                                                                       Photo Credit: Daemmrich Photography
18%, we see the highest volunteering rates among those who are ages 35 to 44 and 45 to 54 –
both at 25%. Rates slip a little in the older brackets with 23% of the 55-to-64 and 65 and older       Civic involvement
age ranges volunteering. Since volunteering for a child’s school or youth organization was included    strengthens our social
in this measure, it is not surprising that the ages when adults are most likely to have school-aged
                                                                                                       bonds and the resilience
children have the highest levels of volunteering.
                                                                                                       of our communities.

Chart 9. Donating and Volunteering by Age in Texas
 70%

 60%                                                                                 60%
                                                                      54%
                                                          52%
 50%                                     48%
                          43%
 40%

 30%
           24%                                   25%            25%                        23%
                                23%                                         23%
 20%             18%

 10%

  0%
             18-24         25-34           35-44            45-54      55-64          65 and
                                                                                       older
                                      Donating         Volunteering

                                                                                                                                             9
Photo Credit: KUT Radio
Group Involvement4
In 2017, 35% of Texans reported being a member of at least one group, such as a religious group
or sports league. The figure below describes the groups that Texans join most frequently.
Chart 10. Five Most Common Membership Groups for Texans
30%
26%
25%
20%
15%
12%
10%
Photo Credit: Corporation for National & 7% 7%
Community Service 6%
5%
Group involvement 0%
Church or Religious Community or Sports or Social Group Charitable or Service
increases as age, Group Neighborhood Recreation League or Club Organization
income, and education
levels rise. 35% of Group involvement increases as age, income, and education levels rise. Only 20% of those ages
Texans report being a 18 to 24 are members of groups, while those 65 and older are members of groups at a rate of
48%. Twenty-two percent of Texans earning less than $35,000 are members of groups, while
member of a community
those making over $75,000 are members of groups at a rate of 53%. Survey data also show that
group. having a college degree is highly correlated with group involvement. While those with only a high
school degree are members of a group 28% of the time, those with a bachelor’s degree or higher
are members of a group at a rate of 62%. See the figure below for a representation of group
membership across age, education, and income in Texas.
Chart 11. Group Membership Across Age, Income, and Education in Texas
70%
62%
60%
53%
50% 48%
43% 44%
41% 39% 39%
40%
32% 32%
30% 28%
23%
20% 22%
20%
10%
0%
k
K
S.
a
ge
ee
K
+
35
4
om
4
4
4
74
4
5K
H.
49
e l o o ll e
gr
-2
-4
+
-3
-6
-5
0-Social Connectedness
Data on social connectedness and neighborliness suggests that Texas may not be living up to the
promise that its state motto – The Friendship State – suggests. By surveying how often people
talk to their neighbors, how much they trust their neighbors, and how often they do favors for their
neighbors, we can gain insight into the level of social connectedness within Texas communities.
Unfortunately in two of these measures, Texas ranks among the 10 worst states.
Only 38% of Texans say they talk to their neighbors frequently – placing Texas 41st of 50 states
and the District of Columbia. Texas ranks 20 percentage points lower than West Virginia, the state
with the most talkative neighbors.
Texans ranked 24th in the country in doing favors for their neighbors, with 13% reporting they
do so frequently. While this is still low, it is slightly above the national average of 12%. There TRUST THE PEOPLE
are few differences among age groups, but interestingly, we do see an inverse relationship IN YOUR NEIGHBORHOOD
between neighborliness and education and income, with less educated and lower income-earning
respondents doing favors for their neighbors slightly more often than those with more education 100%
and higher incomes. Those earning below $35,000 a year report doing frequent favors, at a rate
of 14%, while only 12% of those earning more than $75,000 annually report exchanging favors
frequently with neighbors.
Chart 12. Talk, Do Favors or Trust People in Neighborhood, by Income Level in Texas UT 1
77%
70%
62%
60%
50% 46%
43% 43%
40% 37% 36% 36% 34% U.S. Avg.
56%
30%
20% TX 45
14% 13% 48%
10% 12%
10%
0%
Less than $35,000 $35,000 - $49,999 $50,000 - $74,999 $75,000 or more
Do favors for neighbors Talk with neighbors Trust the people in your neighborhood
When looking at levels of trust between neighbors, Texas is ranked 45th, with 48% trusting their
neighbors most or all of the time. This is nearly 30% below the national leader, Utah, where
neighborly trust occurs at a rate of 77%. There also are large differences in trust between
educational attainment levels. Texans with no high school degree only trust their neighbors 33% 0%
of the time, while those with a college degree trust their neighbors 61% of the time. This gap also
exists between income groups, with Texans earning less than $35,000 annually only trusting
their neighbors 36% of the time, while those earning over $75,000 trust their neighbors 62% of
the time.
Photo Credit: KUT Radio
11R ECOM M EN DAT ION S
Overcoming Texas’ civic health deficiencies requires intervention and investment at all levels of society
including our social systems, public institutions, and ourselves. There are many efforts that will be necessary
to meet these challenges. Below are a few recommendations for ways Texans can improve their civic health.
Reimagine Civics Education. Civic knowledge and skills are learned early, so the more our schools,
parents, grandparents, and community organizations teach the habits of civic engagement, the
stronger Texas will be in the long term. It is our collective responsibility to modernize the way we
prepare the next generation to take on the duty of self-governance.
Explore Opportunities for Institutional, Systems-level Changes. The United States has been
called a laboratory for democracy with each of the 50 states testing their unique blend. Many states
have different rules and laws regulating political participation that undoubtedly lead to state-by-
state differences in engagement. It would benefit the health of our communities to make use of this
laboratory and use best practices from other states that support civic life.
Develop Civic Leaders. Strong leadership has the potential to guide the future in positive ways that
strengthen our social connectedness and build resiliency in our communities. As the population of
Texas continues to diversify, it is important to develop civic leaders who can represent the values
and priorities of all Texans. Texans should strive to create educational opportunities that build skills
around civic leadership, running for office, and non-profit board service.
Encourage Innovation. As Texas grows, it also changes - creating the need for new and diverse
pathways for engagement. Citizens need to reduce obstacles for civic participation. Utilizing
innovative engagement methods, online platforms, and harnessing new technology will jumpstart
our civic health.
Support Organizations That Invest in Texas. Whether it is a neighborhood association, a local
nonprofit, or school, it is important to invest time and money in organizations focused on making
Texas better. There are organizations in every community that are working daily to solve problems
and make lives better by bringing Texans together. Find a way to get involved.
CONC LU SION
The benefits of civic health remain elusive for many Texans, and on most measures of civic engagement Texas
does not compare favorably with other states. These findings should sound an alarm for anyone who cares
about the future of Texas and of the United States more broadly. Texas is currently the second most populous
state in the nation, and the state of Texas’ civic health has social and economic implications far beyond the
state’s borders.
A pattern emerges from this report allowing us to see a relationship between socioeconomic differences
and levels of engagement. The data presented above show those who are younger, those with lower levels of
education, and those earning less income are less civically engaged. The civic health of Texas needs to be
addressed with these realities in mind. While efforts to improve the symptoms of our ailing civic health can
alleviate our engagement problems, the findings of this report suggest we will not see lasting and sustainable
change until we address the root cause. Finding solutions to these challenges will not be easy - they require
our leaders to be forward-thinking and our citizens to be active and engaged.
We hope this report becomes a tool for policy discussion, a catalyst for community conversations, and a
reason for renewed social connection. By highlighting the practices that define civic health, and the vast room
for improvement in all of these areas, we hope each Texan discovers relatively simple and everyday actions
that will lead to dramatic progress in the state of Texas’s civic health.
12 2 0 1 8 T E X A S C I V I C H E A LT H I N D E X T MT EC H N IC A L NO T E
Unless otherwise noted, findings presented in this report are based on the National Conference on
Citizenship’s (NCoC) analysis of the U.S. Census Current Population Survey (CPS) data. Any and all errors
are NCoC’s. Volunteering estimates are from CPS September Volunteering Supplement from 2015, voting
estimates from 2016 November Voting and Registration Supplement, and all other civic engagement
indicators, such as discussion of political information and connection to neighbors, come from the 2013
CPS Civic Engagement Supplement.
Using a probability selected sample of about 150,000 occupied households, the CPS collects monthly
data on employment and demographic characteristics of the nation. Depending on the CPS supplement,
the single-year Texas CPS sample size used for this report ranges from 1,121 to 1,848 (civic engagement
supplement) to 4,215 (volunteer supplement), and to 4,732 (voting supplement) residents from across
Texas. This sample is then weighted to represent population demographics for the state.
Estimates for the volunteering indicators (e.g., volunteering, working with neighbors, making donations)
are based on U.S. residents ages 16 and older. Estimates for civic engagement and social connection
indicators (e.g., favors for neighbors, discussing politics) are based on U.S. residents ages 18 and older.
Voting and registration statistics are based on U.S. citizens who are 18 and older (eligible voters). When
we examined the relationship between educational attainment and engagement, estimates are based on
adults ages 25 and older, based on the assumption younger people may be completing their education.
Because multiple sources of data with varying sample sizes are used, the report is not able to compute
one margin of error for Texas across all indicators. Any analysis that breaks down the sample into smaller
groups (e.g., income, education) will have smaller samples and therefore the margin of error will increase.
Furthermore, national rankings, while useful in benchmarking, may be small in range, with one to two
percentage points separating the state/district ranked first from the state/district ranked last.
It is also important that our margin of error estimates are approximate, as CPS sampling is highly complex
and accurate estimation of error rates involves many parameters that are not publicly available.
The Texas Media & Society Survey seeks to capture the voice of Texans and Americans on the media,
civic engagement, and politics over time. Launched in 2015 as an endeavor of the Moody College of
Communication, the Annette Strauss Institute for Civic Life, and the School of Journalism, the survey
reveals the attitudes of Texans and Americans on media and politics, measures habits of news
consumption, and offers insight into how people become informed in the digital age. In 2017, survey
questions were asked of a sample of 986 Texans and 1,058 Americans. Survey weights have been
employed in this report to adjust for demographic differences between our sample and the populations
of Texas and the United States. For more information about the survey, including the full questionnaire
and methodology, visit txmediaandsociety.org.
13C I V IC H E A LT H I N DE X
State and Local Partnerships
NCoC began America’s Civic Health Index in 2006 to measure the level of civic engagement and health of our democracy. In 2009, NCoC
was incorporated into the Edward M. Kennedy Serve America Act and directed to expand this civic health assessment in partnership
with the Corporation for National and Community Service and the US Census Bureau.
NCoC now works with partners in more than 30 communities nationwide to use civic data to lead and inspire a public dialogue about
the future of citizenship in America and to drive sustainable civic strategies.
S TAT E S
Alabama Illinois University of Missouri Kansas City
University of Alabama McCormick Foundation University of Missouri Saint Louis
David Mathews Center for Civic Life Washington University
Indiana
Auburn University
Indiana University Center on Representative Nebraska
Arizona Government Nebraskans for Civic Reform
Center for the Future of Arizona Indiana Bar Foundation
New Hampshire
Indiana Supreme Court
California Carsey Institute
Indiana University Northwest
California Forward Campus Compact of New Hampshire
IU Center for Civic Literacy
Center for Civic Education University System of New Hampshire
Center for Individual and Kansas New Hampshire College & University
Institutional Renewal Kansas Health Foundation Council
Davenport Institute
Kentucky New York
Colorado Commonwealth of Kentucky, Siena College Research Institute
Metropolitan State University of Denver Secretary of State’s Office New York State Commission on National
The Civic Canopy Institute for Citizenship and Community Service
Denver Metro Chamber Leadership & Social Responsibility,
North Carolina
Campus Compact of Mountain West Western Kentucky University
Institute for Emerging Issues
History Colorado Kentucky Advocates for Civic Education
Institute on Common Good McConnell Center, University of Louisville Ohio
Miami University Hamilton Center for
Connecticut Maryland
Civic Engagement
Everyday Democracy Mannakee Circle Group
Secretary of the State of Connecticut Center for Civic Education Oklahoma
DataHaven Common Cause-Maryland University of Central Oklahoma
Connecticut Humanities Maryland Civic Literacy Commission Oklahoma Campus Compact
Connecticut Campus Compact
Massachusetts Pennsylvania
The Fund for Greater Hartford
Harvard Institute of Politics Center for Democratic Deliberation
William Caspar Graustein Memorial Fund National Constitution Center
Wesleyan Univesity Michigan
Michigan Nonprofit Association South Carolina
District of Columbia
Michigan Campus Compact University of South Carolina Upstate
ServeDC
Michigan Community Service Commission Texas
Florida Volunteer Centers of Michigan The University of Texas at Austin
Florida Joint Center for Citizenship Council of Michigan Foundations The Annette Strauss Institute for Civic Life
Bob Graham Center for Public Service Center for Study of Citizenship at Wayne RGK Center for Philantrophy & Community
Lou Frey Institute of Politics State University Service
and Government
Minnesota Virginia
Georgia Center for Democracy and Citizenship Center for the Constitution at James
GeorgiaForward
Missouri Madison’s Montpelier
Carl Vinson Institute of Government,
Missouri State University Colonial Williamsburg Foundation
The University of Georgia
Park University
Georgia Family Connection Partnership
Saint Louis University
I S S UE S P E C IF IC
Latinos Civic Health Index Millennials Civic Health Index Economic Health
Carnegie Corporation Mobilize.org Knight Foundation
Harvard Institute of Politics Corporation for National & Community
Veterans Civic Health Index
CIRCLE Service (CNCS)
Got Your 6
CIRCLE
14 2017 TEXAS CIVIC HEALTH INDEXC I T IE S
Atlanta Chicago Pittsburgh
Community Foundation of Greater Atlanta McCormick Foundation University of Pittsburgh
Carnegie Mellon University
Austin Kansas City & Saint Louis
The University of Texas at Austin Missouri State University Seattle
RGK Center for Philanthropy and Community Park University Seattle City Club
Service Washington University Twin Cities
Annette Strauss Institute for Civic Life Miami Center for Democracy and Citizenship
Leadership Austin Florida Joint Center for Citizenship Citizens League
Austin Community Foundation John S. and James L. Knight Foundation John S. and James L. Knight Foundation
KLRU-TV, Austin PBS Miami Foundation
KUT 90.5 - Austin’s NPR Station
C I V IC HE A LT H A D V I S O R Y G R O UP
John Bridgeland Shawn Healy Stella M. Rouse
CEO, Civic Enterprises Program Director, McCormick Foundation Director, Center for American Politics and
Chairman, Board of Advisors, National Chair, Illinois Civic Mission Coalition Citizenship
Conference on Citizenship Kei Kawashima-Ginsberg Shirley Sagawa
Former Assistant to the President of the Director, Center for Information and CEO, Service Year Alliance
United States & Director, Domestic Policy Research on Civic Learning and Co-founder, Sagawa/Jospin, LLP.
Council & US Freedom Corps Engagement (CIRCLE) at the Jonathan M. Thomas Sander
Kristen Cambell Tisch College of Citizenship and Public Executive Director, the Saguaro Seminar,
Executive Director, PACE Service at Tufts University Harvard University
Jeff Coates Peter Levine David B. Smith
Research and Evaluation Director, Director, Center for Information and Former Managing Director of Presidio
National Conference on Citizenship Research on Civic Learning and Institute; Former Executive Director of NCoC
Engagement (CIRCLE) at the Jonathan M.
Lattie Coor
Tisch College of Citizenship and Public Sterling K. Sperin
Chairman & CEO, Center for the Future of
Service at Tufts University Chief Executive Officer, National Conference
Arizona
Mark Hugo Lopez on Citizenship
Nathan Dietz
Director of Hispanic Research, Pew Drew Steijles
Senior Research Associate, The Urban
Research Center Assistant Vice President for Student
Institute
Lisa Matthews Engagement and Leadership and Director
Doug Dobson Office of Community Engagement, College
Program Director, National Conference on
Executive Director, Florida Joint Center for of William & Mary
Citizenship
Citizenship
Ted McConnell Michael Stout
Jennifer Domagal-Goldman Associate Professor of Sociology,
Executive Director, Campaign for the Civic
National Manager, American Democracy Missouri State University
Mission of Schools
Project
Martha McCoy Kristi Tate
Diane Douglas Senior Advisor, Civic & Community
Executive Director, Everyday Democracy
Executive Director, Seattle CityClub Engagement Initiatives enter for Future of
Kenneth Prewitt Arizona
Paula Ellis
Former Director of the United States
Former Vice President, Strategic Initiatives, Michael Weiser
Census Bureau
John S. and James L. Knight Foundation Chairman, National Conference on
Carnegie Professor of Public Affairs and
William Galston the Vice-President for Global Centers at Citizenship
Senior Fellow, Brookings Institution Columbia University Ilir Zherka
Former Deputy Assistant to the President Former Executive Director, National
Robert Putnam
of the United States for Domestic Policy Conference on Citizenship
Peter and Isabel Malkin Professor of Public
Hon. Bob Graham Policy, Kennedy School of Government at
Former Senator of Florida Harvard University
Former Governor of Florida Founder, Saguaro Seminar
Robert Grimm, Jr. Author of Bowling Alone: The Collapse and
Director of the Center for Philanthropy Revival of American Community
and Nonprofit Leadership,
University of Maryland
15Data Made Possible By: Connecting People. Strengthening Our Country.
You can also read