Manaiakalani Community of Learning - Future Focused Learning in Connected Communities 2016-2018 - Ministry Of Education
←
→
Page content transcription
If your browser does not render page correctly, please read the page content below
1

    Manaiakalani Community of Learning

     Future Focused Learning in Connected Communities
                        2016-2018
2

Our Community
The Manaiakalani Community of Learning serves the community of Tāmaki consisting of the Auckland suburbs of Glen Innes,
Panmure and Point England. The name Manaiakalani was chosen for the work of enfranchisement and citizenship by our group of
schools and whanau, reflecting the inspirational and courageous behaviour of Maui Tikitiki-a-Taranga as he used the Star Line
Manaiakalani (the Hook of Heaven) to guide his Waka Hourua to a bright future in Aotearoa. In so doing, Maui harnessed ancient
wisdom and combined it with innovative technology to bring about an expansive and empowered future for his people. This fusion of
ancient wisdom, creative courage and innovation are a powerful inspiration for Maori and Pasifika learners today as we emulate the
actions and lives of the navigators.

Historically, Tāmaki was a central trading route between the Manukau and Waitemata harbours as well as the Hauraki Gulf and
Hauraki Plains. The flat area along the Tāmaki River was a popular resting and trading place of many northern, southern and eastern
iwi and the fertile soil combined with rich marine life and an endless supply of raupo and harakeke caused this to be the most highly
populated area of Aotearoa.

This long standing sense of community is strongly evident in present-day Tāmaki through initiatives such as the Manaiakalani
Education Trust. Urban renewal and accompanying community and economic development in the area are priorities. The Tāmaki
Regeneration Company aims to provide a more cohesive service to local whanau through co-operation between government
agencies like the Ministries of Social Development, Education, Health, and Justice. It is also overseeing major housing
redevelopment, accompanied by increased density that will lead to significant population growth over the next ten years.

Tāmaki is a supportive and welcoming multicultural community of Māori, Pasifika, Pakeha, Asian people with approximately 30
percent of the population under the age of 15. The Community of Learning has the potential to reflect the natural advantage and
cultural richness of the area and to be a strong influence on the educational outcomes and lives of our young people.
3
4

Our schools
The Manaiakalani Community of Learning comprises 12 member schools in the Auckland suburbs of Glen Innes, Panmure and Pt
England :

Te Kura Kaupapa Maori o Puau Te Moananui a Kiwa serves students through to year 13. While a member of the Manaiakalani
cluster for some years, the kura is not a formal signatory to the Community of Learning, due to its intention to align with a kura
kaupapa Community of Learning.
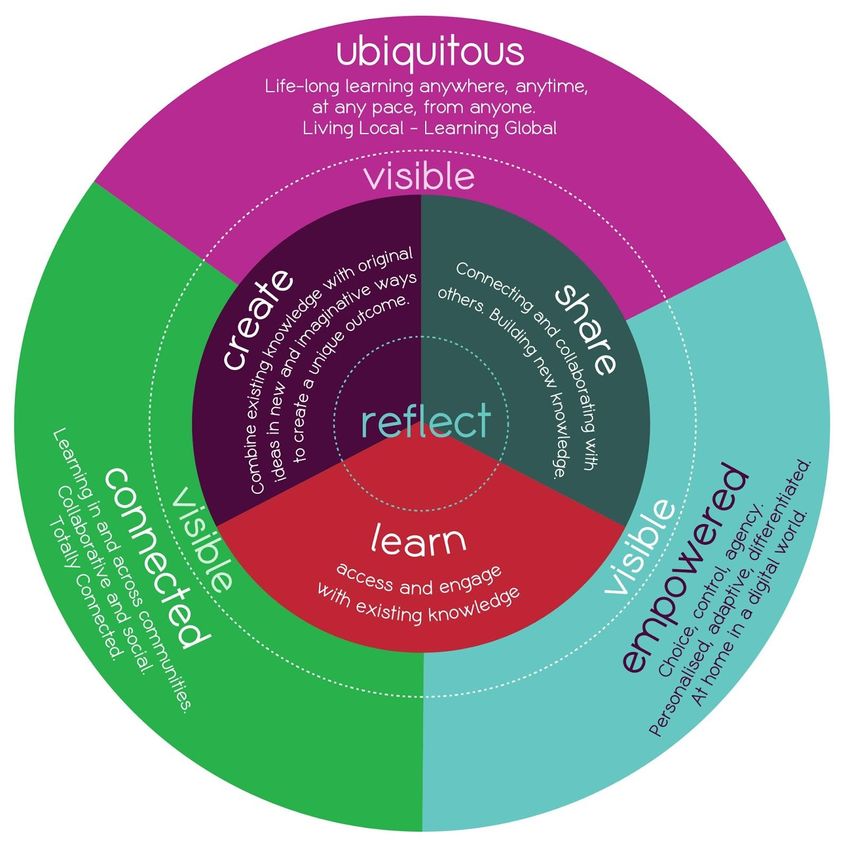
5

The combined schools roll is 3122. (Note that this includes 93 students at Sommerville Special School’s satellite classes in non-
Manaiakalani schools). There are 438 (14%) ESOL funded students. In terms of ethnicity, 24% of students identify as Maori, 51.4%
Pasifika, 9.5% Asian, 11.7% European/Pakeha and 3% other.

Our Vision and Goals
The Manaiakalani vision is to create learners who are confident and connected anytime, anywhere, any pace, ready for
employment in tomorrow’s market and who will contribute positively to their community.

This shared vision has consistent articulation across the Manaiakalani Community of Learning and fosters an internal coherence
characterised by ‘implementation fidelity, integrated self-improvement processes and the ability to take research evidence and act
on it’. Dr Rebecca Jesson, Woolf Fisher Research Centre

Our overall goal is to change learning and teaching practice in order to empower learners and their whanau and accelerate student
achievement outcomes. To achieve accelerated student achievement, the Manaiakalani Community of Learning builds community
and leadership engagement whilst supplying the digital learning infrastructure and the Professional Learning and Development (PLD)
of ‘Learn Create Share’ that is required for success (see diagram below). At every stage, the intent is to increase the capacity and
capability to be able to sustain the accelerated student achievement. (See Appendix One : Student achievement 2012 -15)
6
7
Our Achievement Challenges
Specifically, we aim to :
1. Raise Māori student achievement through the development of cultural visibility and responsive practices across the
pathway as measured against National Standards and agreed targets for reading Years 1-10 and NCEA years 11-13
2. Lift the achievement for boys’ writing Years 1-10
3. Lift the achievement in reading for all students, with a particular focus on boys and Māori students (both genders) years 1-
13
4. Increase the achievement of Years 7-10 learners in reading, writing and maths, as measured against National Standards
and agreed targets
5. Improve the achievement of students with additional needs in the learning areas of English/key competency using language
symbols and texts
We believe that the key factors behind successful learning in our Community are :
operationalising Te Tiriti o Waitangi so that we work in partnership with our community, that the learning community is
protected and safe and that there is full participation with nobody left out
whanau investment in the learning and education of their tamariki
the Learn, Create, Share pedagogy which has been co-constructed in our community
visible learning with peers, whanau and others as learning partners
high behavioural engagement
high cognitive engagement
Our research and evidence shows that these items when appropriately cohered bring accelerated achievement.
Background
The Manaiakalani Community of Learning had its genesis in the Tāmaki Achievement Pathway that was formed in 2001, the direction
from which has provided a clear focus on raising student achievement and a pathway approach to schooling since that time. Our
learning community became known as Manaiakalani in 2007 when the group was approved as an EHSAS Cluster. Manaiakalani
became a Public Good Partnership in 2011 with the foundation of Manaiakalani Education Trust (MET). MET has been the vehicle
that has enabled the group to afford on-going education research with Woolf Fisher Research Center, a division of the University of
Auckland. This means that the activities resourced by our Public Good Partnership are evidence based, clearly linked to8
Achievement Challenges, and subject to external scrutiny at all times. MET also enables the micro financing of over 2000 learner-
owned devices across Manaiakalani schools. The Manaiakalani Partnership includes the Ministry of Education, Foundation North,
Spark Foundation, NEXT Foundation, Hapara Ltd, Fusion Networks Ltd, Cyclone Ltd, Auckland Council, CORE Education, the
University of Auckland, the families of the Tāmaki Community, Tāmaki Regeneration Company, and many individual volunteers and
philanthropists.
Manaiakalani schools have followed set testing and assessment protocols over many years now, and have gathered summative data
from all member schools in March and November of each year. We have analysed this data and used it to supply:
year to year acceleration information to provide whole of pathway knowledge
within year acceleration information to be used within schools and with teachers
knowledge of overall trends to address in the pathway and within schools
evidence for the Ministry of Education and other funding partners
This information has been gathered, analysed and reported on by our education research partner, Woolf Fisher Research Centre, a
division of the University of Auckland. These reports have been used across our Community of Learning with Boards, staff, whanau
and agencies, in a robust and transparent conversation to identify our across-school and in-school Achievement Challenges and to
develop programmes of Professional Learning to focus on learning acceleration.
These data have been collected using the SEA, the 6 Year Survey, STAR, e-asTTle and more latterly PAT up to Year 10 and then
NCEA levels 1 -3 to Year 13. Hence we have a connected sequence of data going back some years, over the whole CoL pathway
from Y1 - Y13.
Our targets and attendant PLD Plans are a reflection of the analysis of these data over time, including external critique, followed by a
community wide engagement to harness partnership around our goals, targets and plans.
Our targets
Overall target
Tracking of student progress over time indicates that overall, students who attend Manaiakalani schools approach national norms
over time. Evidence suggests that younger cohorts of children are on average well below national means in writing, reading and
mathematics, and therefore within each year, students need to make greater than expected progress in order to approach national
mean levels. (See Appendix one, Figures 1-3) This means that within each year, acceleration for all students is required. One way to
ensure that this year to year acceleration occurs and takes learners reliably toward the standard or the mean, is to work to a high9 level target that all learners will achieve 1.5 academic years progress in each academic year. When we achieve this, not only does the learner ‘catch up’ but if achieved 3 years consecutively the ‘practice for success’ is embedded in the life of the learner. Priority Issues & Cohorts Y7 - Y10 Learners : Manaiakalani data shows a significant slump in performance away from the National Standard or Standardised Norm from Y7 - Y10. This creates a substantial challenge for Tāmaki College in lifting learners to meet the national goals for NCEA levels 1 - 2. Our goal is to turn this slump around and achieve the 1.5 years in a year acceleration that is our target for all learners. We particularly need to achieve this year on year for learners who are below the National Standard in Y7. In order to achieve the national goal of 85 percent of learners achieving NCEA level 1, we need to significantly affect the learning trajectory of almost all learners in these year levels Boys Writing: Over time students across Manaiakalani improve in writing. However, despite this improvement, there exists a difference between the achievement of boys and the achievement of girls in writing at any given time. Figure 4 (Appendix one) suggests that boys achieve on average 50 asttle writing points (over a year’s progress) below girls in writing tests. This is a new phenomenon in our experience and it appears some of the difference may have to do with the rate of uptake of aspects of the 1:1 pedagogy we have implemented. Many teachers hypothesise that it may also have to do with the quality of on/off task learning behaviours. Our goal is to match the acceleration of boys to that of girls. This means adding 50 e-asTTle Writing points to the performance of boys in Writing, through all the levels from Y1-Y10. Māori students engagement and achievement: Reading achievement data over 2014 suggest some indications of a difference in learning pathways for Māori students when compared with other ethnicities (see Appendix One Figure 5). Whereas reading progress is accelerated for each of the ethnic groups, this is not the case for Māori students. Thus the achievement in reading of Māori students needs to be prioritised. The achievement of Māori manifests as an issue as learners travel up the levels in the pathway. In the junior school it is barely visible. It becomes more evident in Y7-Y10 and is clearly visible from Y11-13. The issue, as we understand it from evidence across our CoL and from our conversations with community and whanau, appears to be largely one of engagement - in class, in school and with whanau. Associated with this, retention rates for Māori students are below those of other ethnicities at College level (see Appendix Two Table 1). This suggests a need to address both the engagement and achievement of Māori students in Manaiakalani schools. Our evidence of pedagogical and practice change is that the identified successful learning and teaching practices associated with Manaiakalani Learn, Create, Share work equally well with Māori and Pasifika. The differential in performance as the learners age, appears to be more closely associated with whole of school and class - whanau engagement and retention of Māori and their whanau as enthusiastic learners and participants in the school community. Our goal is to make the acceleration of Māori
10
commensurate with other ethnic groups and to see them retained in the CoL pathway to successful graduation into the tertiary or
employment experience of their choice.
Transitions: While students in Manaiakalani make accelerated gains within years, data shows a substantial drop in learner
performance between the end of one year and the beginning of the next. Internationally this is known as the “Summer Slump”. Our
evidence shows that this symptom is displayed by almost everyone. Our goal is for learners to achieve ‘normal progress’ between
one year and the next. Whilst we are committed to achieving 1.5 x normal progress while the learners are under our care, we think it
reasonable to work with whanau in such a way that while the learners are in the care of their whanau they do not regress.
Dips in achievement between school years, and in particular at the beginning of year 9 during transition to high school, operate as a
barrier to long term improvement. Therefore a priority achievement challenge is transition between years generally, and between
primary and secondary school in particular.
Strategic Actions in response to our Achievement Challenges
Manaiakalani achievement challenges are based on clear data analysis over many years. The Plan reflects a corresponding
educational pathway, together with strong engagement with whānau. Our strategic actions in response to these challenges are to:
use our shared vision, shared data and analysis along with shared decision making for change to drive excellence in
achievement
use the strengthened student engagement in learning that results from digital learning environments to build cognitive
engagement
use efficiencies gained as a result of digital learning environments to make the most of teacher time
use the classrooms and teachers identified in the research programme as producing the desired acceleration as models of
practice change which we expect to emerge in every classroom.
develop pedagogical practices in a digital learning environment that promote high levels of learner engagement, student
agency and collaboration using the ‘Learn, Create, Share’ philosophy
ensure a focus within learning environments on the following:
Teaching activity types
Nature of tasks
Feedback
Task management
Student collaborative decision making
Student agency and autonomy
Open-ended tasks and cognitively engaging teaching11 The tables below describe the Manaiakalani Community of Learning’s shared achievement challenges, targets and the actions we resource in order to meet our targets. These are challenges across all of the education pathway and measure performance year on year so that we examine the success of the whole pathway from Y1 with the SEA to Y12 with NCEA Level 2 and Y13 with University Entrance. It should be noted that a significant number of our learners, including those attending Sommerville Special School, are students with additional needs who struggle with focused and on task work performance for new learning.
12

1. Reading

Targets                                              Focus

In 2015, 61.6% (1487/2413) of our Y1 – Y8
learners were At or Above the National Standard      Within our overall goal of shifting 443 additional students there are 2
in Reading.                                          subgoals. These reflect our focus on lifting the achievement of male
                                                     students and Māori students.
We will lift this to 80% (1930/2413), an 18.4%       Māori: We aim to lift the achievement of all our Māori students in
shift by the end of 2018 . This will mean moving     English/Reading from 59.4% (364/613) to 80% (491/613) by the end of
443 additional students.                             2018. This is a shift of 127 more Māori students.
                                                     We have an overall focus to raising student achievement and cultural
In 2015, 49.8% (102/205) of our Y9 – Y10             visibility for Māori students in years 9-13.
learners were At or Above expected Curriculum
                                                     Boys: We aim to lift the achievement of Male students in English/Reading
Level (level 5) in Reading.
                                                     from 55% (683/1231) to 80% (985/1231) by the end of 2018. This is a shift
                                                     of 302 more Male students.
We will lift this to 80% (164/205), a 30 shift by
2018. This will mean moving 62 additional
students.

In 2015, 76% (81/107) of our Year 11 learners
achieved NCEA Level one literacy at the
appropriate level

We will lift this to 86% (92/107), a 10% shift, by
2018. This will mean moving an additional 11
students.
13
Reading
All students
Current Target Performance 2016 Target Performance 2017 Target Performance 2018
Performance
at Expected
Level
No % No % No % No %
Student
# Shift
Shift %
Student
# Shift
Shift %
Student
# Shift
Shift %
1487/2413 62 1731/2413 72% 244 10% 1831/2413 76% 100 4% 1930/2413 80% 99 4%
Māori
Current Target Performance 2016 Target Performance 2017 Target Performance 2018
Performance
at Expected
Level
No % No % No % No %
Student
# Shift
Shift %
Student
# Shift
Shift %
Student
# Shift
Shift %
364/613 59.4 459/613 75% 95 15% 479/613 78% 20 3% 491/613 80% 12 2%14
Boys
Current Target Performance 2016 Target Performance 2017 Target Performance 2018
Performance
at Expected
Level
No % No % Shift No % Shift No % Shift
Student
# Shift
Student
# Shift
Student
# Shift
% % %
683/1231 56 832/1231 68% 149 12% 932/1231 76% 100 8% 985/1231 80% 53 4%15
Targeted students for Reading Years 1-10
Each school has considered its cohort of Māori and Male students and has identified those whom each will target for shift. (See
Table below) Our targets reflect our aim to shift 50 percent of these students currently below National Standards to at or above
National Standards, in each year. We consider this a realistic goal that takes into consideration that up to 45 percent of these
students may be new to their school in any one year.
Name of School Māori No. Boys excl Māori Total
St Patrick’s School 1 8 9
Panmure Bridge School 13 5 18
Tamaki Primary 12 11 23
Ruapotaka School 6 11 17
Pt England School 9 16 25
Glenbrae School 6 8 14
Glen Innes Primary 2 8 10
St Pius X School 0 4 4
Stonefields School 3 8 11
Glen Taylor School 16 15 31
Tamaki College (Yr 9-10) 27 55 82
Total 95 149 24416
Actions for Reading and Writing
Actions: all students
take identified teaching practices from across our CoL which produce this acceleration and mandate them in a level
appropriate way in every Manaiakalani classroom. These include engagement, increasing the power of interactions with
students, offering greater in-task support whilst students write, enhancing the complexity of learning and increasing the
connections between home and school.
engage whanau in the visible learning pathways we are co-constructing
foster teacher inquiry into practice through MDTA, MIT, ClassOnair and inquiry within and across schools to innovate,
find and identify practices that produce acceleration
Continue to develop resources and tools to support teacher change so that change priorities filter end to end from PLCs
to classroom programmes to benefit all students.
Develop rubrics or matrices for teacher practice to enable teachers to identify their current practice strengths and areas
to develop.
Continue with external research, evaluation and analysis to identify and spread practices that produce acceleration
Department meetings at College will regularly include data analysis, reflections and report on data termly, as
documented by the Data and Assessment Team (DAT) on the Data Garden website, the Curriculum Committee and
individual departments
refine the use of SOLO taxonomy in teaching and learning, as per planned staff PLD.
Actions: Boys writing
Programme in focused discussion in PLGs including data from research observations to clarify causality
Deliver focused PLD to upskill teachers, leading to changed teacher practice to match successful strategies
Actions : Māori learners
Implement Kia Eke Panuku, the Tāmaki College Māori Achievement action plan, as documented on the Kia Eke Panuku
website
All students to complete a Whanau Education Action Plan (WEAP), as evidenced by the Tutor Conversation process
Utilise the Culturally Responsive and Relational Pedagogy Observation Tool, as per planned Staff PLD and documented
on the Kia Eke Panuku website and the Teaching Staff Appraisal website.17
2. Writing
Targets Focus
In 2015, 53.4% (1289/2413) of our Y1 – Y8 Within our overall goal of shifting 521 Y1-8 additional students by
learners were At or Above the National Standard 2018, there is one subgoal of particular focus:
in Writing.
Boys: We aim to lift the achievement of Male students in Writing from
We will lift this to 75% (1810/2413), a 21.6% shift 44.4%(546/1231) to 75% (923/1231) by the end of 2018. This is a shift of
by 2018. This will mean moving 521 additional 377 more Male students.
students.
Y 11
In 2015, 46% (94/205) of our Y9 – Y10 learners We aim to lift the NCEA Level 1 Literacy achievement (Writing) of male
were At or Above expected Curriculum Level in students in Year 11 from 82% (41/50) to 96% (48/50). This is a shift of 7
Writing. more male students.
We will lift this to 70% (143/205), a 24% shift by
2018. This will mean moving 49 additional
students
In 2015, 76% (81/107) of our Year 11 learners
achieved NCEA Level 1 Literacy at the
appropriate level.
We will lift this to 91% (97/107), a 15% shift by
2018. This will mean moving additional 16
students.18
All students
Y1-8
Current Target Performance Target Performance 2017 Target Performance 2018
Performance at 2016
Expected Level
No % No % No % No %
Student
# Shift
Shift %
Student
# Shift
Shift %
Student
# Shift
Shift %
1289/2413 53.4% 1410/2413 58% 121 5% 1568/2413 65% 158 7% 1810/2413 75% 242 10%
Y9-10
Current Target Performance Target Performance 2017 Target Performance 2018
Performance at 2016
Expected Level
No % No % No % No %
Student
# Shift
Shift %
Student
# Shift
Shift %
Student
# Shift
Shift %
94/205 46% 123/205 60% 29 14% 134/205 65% 11 5% 143/205 70% 9 5%19
Boys: Y1-8 (Boys breakdown provided below)
Current Target Performance Target Performance 2017 Target Performance 2018
Performance at 2016
Expected Level
No % No % No % No %
Student
# Shift
Shift %
Student
# Shift
Shift %
Student
# Shift
Shift %
546/1231 44.3% 704/1231 57% 158 13% 824/1231 67% 120 10% 923/1231 75% 99 8%
Boys : Yr 11 (Boys breakdown provided below)
Current Target Performance Target Performance 2017 Target Performance 2018
Performance at 2016
Expected Level
No % No % No % No %
Student
# Shift
Shift %
Student
# Shift
Shift %
Student
# Shift
Shift %
41/50 82% 43/50 86% 2 4% 45/50 90% 2 4% 48/50 96% 3 3%
Actions for writing are included above, under reading.20
Targeted students for Writing:
Each school has considered its cohort of male students and has identified those whom each will target for shift. (See Table below)
Our targets reflect our aim to shift 50 percent of these students currently below National Standards to at or above National
Standards, in each year. We consider this a realistic goal that reflects that up to 45 percent of these students may be new to their
school in any one year.
Name of School Boys Name of School Boys
Tamaki College
St Patrick’s School 6 Year 9 + 10 29
Panmure Bridge School 19 Year 11 2
Tamaki Primary 15
Ruapotaka School 18
Pt England School 15
Glenbrae School 14
Glen Innes Primary 17
St Pius X School 4
Stonefields School 31
Glen Taylor School 19
Total 158 Total 3121
3. Y7 - Y10 Maths
While our focus is on achievement across the curriculum, our targets reflect Maths, as the other areas are captured in the
Achievement Challenges outlined above.
Targets Focus
In 2015, 45.5% (245/540) of our Y7 – Y8 learners were Evidence from the Manaiakalani Pathway over time shows a
At or Above the National Standard in Maths. substantial drop in outcomes in Years 7 -10, which then has to be
regained to experience expected achievement from Y11 onwards.
In 2015, 41.6% (104/250) of our Y9 – Y10 learners were
At or Above the National Standard in Maths. As we have noted no discrepancy between student cohorts by
ethnicity, our focus is on the student cohort as a whole.
We will lift the achievement of all learners in Y7 - Y10
from 44% (349/790) to 70% (553/790), a 26% shift by
2018. This will mean moving 204 additional students.
Year 7 + 10
Current Target Performance Target Performance 2017 Target Performance 2018
Performance at 2016
Expected Level
No % No % No % No %
Student
# Shift
Shift %
Student
# Shift
Shift %
Student
# Shift
Shift %
349/790 44% 395/790 50% 46 6% 474/790 60% 79 10% 553/790 70% 79 10%22
Targeted students for Maths:
Name of School Māori Pasifika Other Students Total Y7 + 10
St Patrick’s School 1 4 2 7
Panmure Bridge 8 2 4 14
Tamaki Primary 7 4 0 11
Ruapotaka School 2 6 1 9
Pt England School 1 6 2 9
Glenbrae School 2 9 0 11
Glen Innes Primary 2 8 2 12
St Pius X School 0 7 0 7
Stonefields School 0 0 0 0
Glen Taylor School 2 15 3 20
Tamaki College yr 9-10 28 76 0 104
Total 53 137 14 20423
Actions
using external research, and across school trend information, ensure that we have identified the practices which
continue positive acceleration in years 7 - 10
socialise the understanding of successful practices and high cognitive engagement across all Y 7 - 10 classes
ensure that Y7 and Y8 teachers see and understand the challenges and practices needed in Y9 and Y10 in order to
extend understanding of the combined barriers to achievement as cohorts progress through Years 7-10 including
transitions within and across schools
ensure that Y9 and Y10 teachers see and understand the practices and pedagogy used in Y7 and Y8 to extend
understanding of the combined barriers to achievement as cohorts progress through Years 7-10 including transitions
within and across schools
build content and knowledge through PLGs as part of a focus on collective responsibility for these learners across the
community, and where successful strategies for how students’ literacy and numeracy skills are enhanced in teaching
practices are shared and understood across primary and secondary levels
provide professional development on how to implement teaching strategies that consistently improve students’ literacy
and numeracy competencies and mandate successful practices as part of a strategic approach to support learners in
years 7-10.
Increase expectations of what students can learn, the level of complexity with which they can engage effectively and the
need to plan for cognitive challenge.
Investigate strategies to capitalise on within-year acceleration.
Build the capability and confidence of students that receive specialist interventions for them to more effectively
participate in mainstream classes.
Support whanau engagement focused on useful family holiday time activities
Extend the provision of in-school summer camps through working with external partners and providers
Continue partner programmes with Public Libraries
Promote intentional use of Tamaki College eBook Library
Encourage early enrolments for Y9 at Tamaki College during the Y8 year, to build readiness and student relationships
with College24
4. NCEA Level 2
NCEA Level 2 Focus
In 2015, 69%(64/93) of our NCEA Level 2 learners achieved Level 2. Maori and Pasifika Subgoals
Of which 12/64 (18.7%) were Maori, 51/64 (79.6%) were Pasifika and That 10 students from the Year 12 cohort will achieve a
1/64 were Other (1.5%). Merit Endorsement in NCEA Level 2
We will lift this to 85% (79/93), a 16%shift by 2018. That 5 students from the Year 12 cohort will achieve an
Excellence Endorsement in NCEA level 2
This will mean moving 15 additional students, of whom 5 would be
Maori, 9 would be Pasifika and 1 would be Other.
Current Target Performance Target Performance 2017 Target Performance 2018
Performance at 2016
Expected Level
No % No % No % No %
Student
# Shift
Shift %
Student
# Shift
Shift %
Student
# Shift
Shift %
64/93 69% 70/93 75% 6 6% 75/93 81% 5 6% 79/93 85% 4 4%
Targeted students for NCEA L2:25
Name of School Māori Pasifika Other Students Total
Tamaki College 12 51 1 64
Foci also include:
That 80% (72/90) of the Year 12 cohort will have passed their Learner's Licence.
That 50% (23/46) of the Year 12 Trades Academy cohort will achieve an additional National Certificate.
That 75% (35/46) of the Year 12 Trades Academy cohort will receive a Vocational Pathway Award.
That 90% (22/24) of Year 12 Maori students complete the year and return to Year 13.
Actions
all students to complete a WEAP (Whanau Education Action Plan), as evidenced by the Tutor Conversation process
utilise the Culturally Responsive and Relational Pedagogy Observation Tool, as per planned Staff PLD and documented
on the Kia Eke Panuku website and the Teaching Staff Appraisal website
Refine the use of SOLO taxonomy in teaching and learning, as per planned staff PLD
Work with a Student Achievement Function practitioner in an inquiry based change process to accelerate progress and
achievement for students
Work with the Secondary/Tertiary Lead from Youth Guarantee (MoE) to strengthen pathways in student progression26
5. Sommerville Special School
Achievement Challenge 5: Students with
Additional Needs
Evidence from the Manaiakalani Pathway over time shows a need
Currently 60% (150/250) of our learners are achieving their to clearly identify achievement goals for learners with additional
progress goals within the Learning Area of English or the Key needs and measure progress and achievement against those
Competency of Using Language Symbols and Texts in their goals
IEP. We will lift this to 80% (200/250) by 2018. This will mean
moving an additional 50 students. The progress increments appropriate for these learners will differ
from learner to learner. However all learners will make fine
grained progress towards level one of the NS as measured
against individual assessment processes within their personalised
learning plans.
We expect to demonstrate:
Robust performance and progress measurement
Clear and explicit statements of progress
Appropriately applied measures27
Current Target Performance 2016 Target Performance 2017 Target Performance 2018
Performance
at Expected
Level
No % No % No % No %
Student
# Shift
Shift %
Student
# Shift
Shift %
Student
# Shift
Shift %
150/250 60 165/250 66 15 6% 175/250 70 10 4% 200/250 80 25 10%
Targets for students with additional needs:
Name of School Māori Pasifika Other Students Total
Sommerville Special School 30 39 181 250
Actions
Our leadership and professional learning and development will focus on:
raising levels of engagement (behavioural, affective and cognitive) through improving the teacher student relationship quality
highlighting and raising the principles behind visible learning, connection, empowerment and ubiquity
utilising enabling technologies to engage students in higher order thinking skills
refining and embedding adaptive teacher practice through collaborative inquiry and programme planning
supporting learners’ ability to confidently articulate their learning progressions, determine their next learning challenge and
identify steps to progress and achieve across the learning areas
providing multiple opportunities and pathways for student to learn.
We will build capability in terms of guiding and supporting student learning through links with the school:
building parents own confidence to participate in the digital world through IT sessions held at school
forming a parents group and a parents network28
We will:
encourage and support teachers to inquire into their practice to promote effective and cognitively challenging learning
consistent with the learn, create, share pedagogy
continue with the digital toolkit PLD
embed the practice of teaching as inquiry for professional growth
embed the practices of formative assessment throughout the school
embed the practices of differentiation throughout the school
introduce the learning target theory of action29
Evaluation and Monitoring
The Manaiakalani CoL has a longstanding relationship with our education research partner, Woolf Fisher Research Centre, a division
of the University of Auckland. Evaluation and Monitoring activities encompass:
1.Student Achievement Data tracking
Student achievement data (PAT and E-AsTTle) for writing, reading and mathematics is collected across terms 1 and 4 for all
years’ 3-10 students. This has been collected and analysed now over 4 years from 2012. Longitudinal data is matched and
collated to show shifts.
Students’ NCEA achievement and roll data is obtained directly from the NZQA.
2. Classroom observations
Classroom observations are undertaken to gauge the nature of the instruction that has taken place. Students’ learning is
described qualitatively. In 2014 standardised categories were extended to focus on the various activities that learners were
engaged in. Observations carried out since 2014 have compared online tasks, sites, student agency and collaboration.
Case studies of the practices of teachers who are effective in the teaching of writing are also undertaken. Classroom
observations, teacher on line planning, student blog posts and teacher interviews were analysed qualitatively and
quantitatively.
3. Stakeholder voice
Questionnaires have been conducted to seek students’ engagement and teacher’s expectations of engagement. This has
formed part of the basis for the focus on increasing cognitive engagement for students.
The cluster is intending to undertake in-depth engagement with groups of families to gauge the nature of change in
engagement with whānau.
4. Areas of focus
We will track the achievement of learners in our cohorts of specific focus as identified in this Plan, and through Kia Eke
Panuku, the Tamaki College Māori Achievement action plan, the achievement of actions identified within each Whanau
Education Action Plan (WEAP), as evidenced by the Tutor Conversation process, and student retention levels30
Structures to support plan
Learn Create Share means that all Manaiakalani schools collaborate with the Manaiakalani PLD team to support teachers to embed
the wider goals of the Manaiakalani pedagogy, as part of a shared plan of action. This section sets out the plan for what the
Manaiakalani Community of Learning will do to achieve the achievement challenges and goals. Drawing on Woolf Fisher Research
Centre recommendations, actions are guided by the key themes of engagement, parental support, complex tasks, in-site support
and making connections.
Our ongoing challenge is to maintain and sustain acceleration, so that our learners become commensurate with national
achievement expectations. Our Plan responds to this challenge and is sustained by:
the ongoing analysis of data
ongoing processes for self improvement
shared goals
collective problem-solving
understanding variation
Key elements of the Support structure are as follows:
1. Manaiakalani Professional Learning Groups : for principals, school leaders, Manaiakalani Innovative Teachers,
Manaiakalani Digital Teacher Academy, Tutor teachers and Administrators
2. Manaiakalani Digital Immersion PLD : for teachers new to teaching in a digital learning environment
3. Toolkits : providing all staff an opportunity to up-skill, connect and network and share learning across the cluster.
4. Annual Manaiakalani Hui : a full day programme that shares learnings and achievements to date, and and consolidates
areas for future focus
5. Principals Study Tour : enabling school leaders to learn from innovative and best practice education examples elsewhere
6. School Level delivery : school level planning
7. Whanau engagement to support parents and families to participate in their children’s learning31
1. Manaiakalani Professional Learning Groups
The PLD team facilitate a number of professional learning groups at regular intervals to strengthen leadership in our schools and
develop communities of practice.
School Leadership This series of Professional Learning Groups is planned for the Manaiakalani leaders in each school to come
Team together and share strategies and direction. This is not the traditional lead teacher person. This is the person
who drives the implementation, direction and embedding of Manaiakalani in each school. This person may be
a curriculum leader, ahead of department or a member of the SMT. Some schools may have more than one
attend.
School Leader (Yrs This Professional Learning Group is offered to the Leaders of the Year 1-3 area in our Primary schools.
1-3) The Team or Syndicate leader attends this forum, and in small schools this might be the AP.
Tutor Teachers This programme provides targeted development and support to teachers in the role of mentoring beginning
and Mentors PLG teachers.
Principals Principals come together at least twice each term for a half or full day leadership PLD. This includes focus on
sharing results, implementation of recommendations arising from the research and evaluation programme
(Woolf Fisher Research Centre), leadership activities and sharing continuous improvement approaches.
Manaiakalani The Manaiakalani Innovative Teacher programme recognises teachers who have been contributing to the
Innovative development of the Manaiakalani pedagogy and are continuing to look for innovative ways to achieve the
Teachers goals of the programme. The programme runs for one academic year and the opportunity to be part of this
network of teachers is open to all Manaiakalani teachers. Teachers apply to be part of the programme, which
requires them to develop and submit a research proposal for consideration by an appointment panel.
MDTA 14 - 15 New Zealand Schools require teachers to be at home in a digital world. In response, every two years the
Manaiakalani cluster offers ten new teachers (new primary and secondary graduates) the opportunity to build
MDTA 16-17 future pedagogies and the digital competencies required of teachers entering the profession.
Admin Staff Administration staff in all schools come together for one day’s PLD each year, where they learn more about
the manaiakalani pedagogy, develop their skills and share learning and information.32 2. Manaiakalani Digital Immersion PLD A tailored programme for teachers new to Manaiakalani and new to teaching in a digital learning environment (Chromebook and iPad). This involves two day Digital Immersion PLD in January each year, which is supplemented by after-school toolkits sessions and other PLD throughout the year, as part of school and cluster wide PLD. Digital immersion site and resources 3. Toolkits Toolkit sessions are an important component of the PLD programme for Manaiakalani teachers. They are provided to give all members of staff an opportunity to up-skill, connect and network and share learning across the cluster. Tool Kits sessions are held after school, two weeks per term, and are run by teachers for teachers - with a little bit of help from facilitators and others. These enable professional learning and development conversations for experienced teachers who may not be offered the opportunity to attend other PLGs above. They are entirely voluntary and cover a wide range of topics both technical/digital and pedagogical. Toolkits 4. Annual Hui: Held in August each year The purpose of the annual Manaiakalani hui is to bring Manaiakalani people (principals, teachers, Boards of trustees, Manaiakalani Education Trust and other supporters) together to share and consolidate work and achievements to date, hear from students and teachers about their learning, and reflect on the evidence for enhanced student outcomes and the focus for further improvement. Schools may opt to make this a teacher only day or just for leaders, depending on what is possible for each. 5. Principals Study Tour This tour offers Principals the opportunity to look at and learn from innovative and best practice education examples elsewhere in New Zealand and Australia. Principals Study Tour 2015
33
6. School level Professional Inquiry and Coaching Plan
Each school has its own inquiry and coaching plan designed to :
enable all staff to inquire into the possibilities enabled by the 1:1 Learn Create Share pedagogy to extend the hours and
opportunity for learning and to raise student achievement outcomes.
associate student achievement data with the learning and teaching practices that bring accelerated shift for students.
A sequential programme of activities each term provide the context and leadership within which the PLD programme occurs. These
activities include:
1. Setting out the vision and Schoolwide foci, through staff meetings, and staff identifying their needs/interests and areas for
inquiry
2. Assigning coaches and establishing Inquiry Groups that meet similar needs/interests. This is supported by :
o whole staff immersion and content in staff meetings
o goals and action plans set up with coaches
o regular meetings for Inquiry groups to look at data, readings and models, and provide specialised PLD from inside and
outside school
o coaching relationships, including class visits, modelling and support
3. Regular team meetings that include timeslots for sharing in break off inquiry groups
4. Time to discuss and reflect with groups who are focused on a similar inquiry and to plan setting up next steps for next cycle
5. Presentations of learning across staff as part of each end of term staff meeting
7. Whanau Learning and engagement
The Community of Learning invests in a programme of activities to support parents and whanau to become engaged in their
children’s learning and to develop skills to help them do this. The ways that schools and whanau work together to encourage
connection to children’s learning include:
Home School partnerships, with meetings at least once a term
The Whanau digital learning programme, which upskills parents so they can access and provide feedback on their children’s work
through the parent portal, and become more engaged in their children’s learning. The Manaiakalani whanau learning site is a space34 created for families to stay connected with all things Manaiakalani. Here whanau can find out more about our helpful parent training sessions, resources and latest news for our families. The Kawa of Care, which is an agreement setting out the protocols and requirements that ensure everyone gets the best out of their digital learning, and understands how to be Cybersmart The Manaiakalani Film Festival, where whanau celebrate their children’s work at this annual Film Festival, held every November.
35

Appendices
1. Student achievement evaluation

Source : Woolf Fisher Research Centre

                   4   5   6   7   8   9   10
                                                    Year Level

 Figure 1. Distribution of PAT Reading scale scores by year level at Term 1 in 2016.
36
4 5 6 7 8 9 10
Year Level
Figure 2. Distribution of PAT Reading scale scores by year level and gender at Term 1 in 2016.
Distribution of PAT Reading Scale Scores by Ethnicity at Term 1 in 201637
4 5 6 7 8 9 10
Year Level
Figure 3. Distribution of PAT Reading scale scores by year level and ethnicity at Term 1 in 2016.
Distribution of PAT Mathematics Scale Scores by Year Level at Term 1 in 201638
4 5 6 7 8 9 10
Year Level
Figure 4. Distribution of PAT Mathematics scale scores by year level at Term 1 in 2016.
Distribution of PAT Mathematics Scale Scores by Gender at Term 1 in 201639
4 5 6 7 8 9 10
Year Level
Figure 5. Distribution of PAT Mathematics scale scores by year level and gender at Term 1 in 2016.
Distribution of PAT Mathematics Scale Scores by Ethnicity at Term 1 in 201640
4 5 6 7 8 9 10
Year Level
Figure 6. Distribution of PAT Mathematics scale scores by year level and ethnicity at Term 1 in 2016.
Distribution of e-asTTle Writing Overall Scores by Year Level at Term 1 in 201641
4 5 6 7 8 9 10
Year Level
Figure 7. Distribution of e-asTTle Writing scale scores by year level at Term 1 in 2016.
Distribution of e-asTTle Writing Overall Scores by Gender at Term 1 in 201642
4 5 6 7 8 9 10
Year Level
Figure 8. Distribution of e-asTTle Writing overall scores by year level and gender at Term 1 in 2016.
Distribution of e-asTTle Writing Overall Scores by Ethnicity at Term 1 in 201643
4 5 6 7 8 9 10
Year Level
Figure 9. Distribution of e-asTTle Writing overall scores by year level and ethnicity at Term 1 in 2016.44
NCEA 2010-15
Tamaki College NCEA Levels 1-3 achievement 2010 - 201545 Appendix 2 : Student retention Table 1: Tamaki College retention by ethnicity and gender Ethnic group Gender 15 16 17 18 19+ Total Māori Female 4 6 5 5 1 21 Māori Male 3 2 2 12 0 19 Māori Total 7 8 7 17 1 40 Pasifika Female 4 7 19 18 3 51 Pasifika Male 2 7 17 23 3 52 Pasifika Total 6 14 36 41 6 103 Asian Female x x x x x 0 Asian Male x x x x x 1 Asian Total 0 0 0 0 0 1 Other Female x x x x x 0 Other Male x x x x x 1
46 Other Total 0 0 0 0 0 1 European/Pākehā Female x x x x x 3 European/Pākehā Male x x x x x 4 European/Pākehā Total 0 2 1 4 0 7 Total Female 6 12 23 21 4 66 Total Male 4 9 20 36 4 73 Total Total 10 21 43 57 8 139 (source: http://www.educationcounts.govt.nz/find-school/school/retention/age?school=57&district=7615®ion=2 Appendix 3 : Links 3.4 Manaiakalani website : http://www.manaiakalani.org/home 3.5 Manaiakalani Research and Evaluation http://www.manaiakalani.org/our-story/research-evaluation
You can also read