EDUCATION POLICY OUTLOOK: NEW ZEALAND - June 2013 - OECD.org
←
→
Page content transcription
If your browser does not render page correctly, please read the page content below
EDUCATION POLICY OUTLOOK: NEW ZEALAND

                         June 2013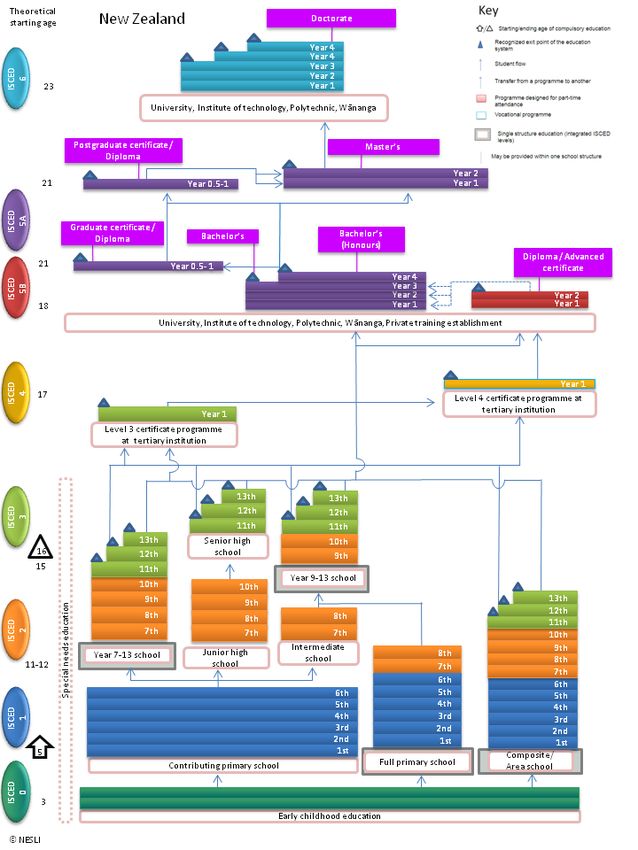
EDUCATION POLICY PROFILE
This policy profile on education in New Zealand is part of the new Education Policy Outlook series, which
will present comparative analysis of education policies and reforms across OECD countries. Building on the
substantial comparative and sectorial policy knowledge base available within the OECD, the series will result in a
biannual publication (first volume in 2014). It will develop a comparative outlook on education policy by providing:
a) analysis of individual countries’ educational context, challenges and policies (education policy profiles) and of
international trends and b) comparative insight on policies and reforms on selected topics.
Designed for policy makers, analysts and practitioners who seek information and analysis of education
policy taking into account the importance of national context, the country policy profiles will offer constructive
analysis of education policy in a comparative format. Each profile will review the current context and situation of
the country’s education system and examine its challenges and policy responses, according to six policy levers
that support improvement:
Students: How to raise outcomes for all in terms of 1) equity and quality and 2) preparing students for
the future
Institutions: How to raise quality through 3) school improvement and 4) evaluation and assessment
System: How the system is organised to deliver education policy in terms of 5) governance and
6) funding.
Some country policy profiles will contain spotlight boxes on selected policy issues. They are meant to draw
attention to specific policies that are promising or showing positive results and may be relevant for other
countries.
Special thanks to the New Zealand government for their active input during consultations and their
constructive feedback on this report and also to Deborah Roseveare, Head of the OECD Skills Beyond Schools
Division, for her review and comments.
Authors: This country policy profile was prepared by Beatriz Pont, Diana Toledo Figueroa, Juliana Zapata
(main drafter) and Sylvain Fraccola (statistics and design), from the Education Policy Outlook team, which is part
of the Policy Advice and Implementation Division, led by Richard Yelland. Editorial support was provided by
Lynda Hawe and Susan Copeland. This profile builds on the knowledge and expertise of many project teams
across the OECD’s Directorate for Education and Skills, to whom we are grateful.
Sources: This country profile draws on OECD indicators from the Programme for International Student
Assessment (PISA), the Teaching and Learning International Survey (TALIS) and the annual publication
Education at a Glance, and refers to country and thematic studies such as OECD work on early childhood
education and care, teachers, school leadership, evaluation and assessment for improving school outcomes,
equity and quality in education, governing complex education systems, vocational education and training, and
tertiary education.
Most of the figures quoted in the different sections refer to Annex B, which presents a table of the main
indicators for the different sources used throughout the country profile. Hyperlinks to the reference publications
are included throughout the text for ease of reading, and also in the References and further reading section,
which lists both OECD and non-OECD sources.
More information is available from the OECD Directorate for Education and Skills (www.oecd.org/edu) and
its web pages on Education Policy Outlook (www.oecd.org/edu/policyoutlook.htm).
EDUCATION POLICY OUTLOOK: NEW ZEALAND © OECD 2013 2TABLE OF CONTENTS Highlights ......................................................................................................................................................................... 4 Equity and quality Towards inclusive education in a context of increasing diversity ..................................................................................... 6 Preparing students for the future Strong labour market perspectives and high tertiary graduation rates ............................................................................. 8 School improvement School leaders and teachers have autonomy to steer students' learning ...................................................................... 10 Evaluation and assessment to improve student outcomes Trust plays a key role ..................................................................................................................................................... 12 Governance Stakeholder automony within a national framework ....................................................................................................... 15 Funding High public and private spending, strong student support for tertiary education ............................................................ 17 Annex A: Structure of New Zealand’s education system ................................................................................................ 19 Annex B. Statistics ......................................................................................................................................................... 20 References and further reading ..................................................................................................................................... 23 Figures Figure 1. Student performance in reading and impact of economic, social and cultural status .................................... 5 Figure 2. Upper secondary and tertiary attainment ...................................................................................................... 5 Figure 3. Reading performance and percentage of low and top performers ................................................................ 7 Figure 4. Students in education and not in education, by educational attainment and work status .............................. 9 Figure 5. School principals' and students' views on learning environment ................................................................. 11 Figure 6. Student assessment by purpose ................................................................................................................. 13 Figure 7. Decisions in public lower secondary schools, by level of government ........................................................ 16 Figure 8. Expenditure on educational institutions as a percentage of GDP ............................................................... 18 Spotlight Spotlight 1. Setting national standards for diverse learners ....................................................................................... 14 EDUCATION POLICY OUTLOOK: NEW ZEALAND © OECD 2013 3
HIGHLIGHTS

New Zealand’s educational context

      Students: New Zealand has been a top PISA performer since 2000, with students performing above the OECD
average in reading, science and mathematics. New Zealand has an inclusive early childhood education curriculum,
national standards, comprehensive schooling until the age of 16, low levels of grade repetition, and flexible options in
upper secondary education.

      Individuals in New Zealand have higher tertiary education attainment than the OECD average, and upper
secondary education attainment is around the OECD average. Many vocational education and training programmes
are offered in post-compulsory education. Labour market perspectives for students are positive, and during the
financial crisis (2008-11), the number of 15-29 year-olds not in education and not employed remained below the OECD
average.

     Institutions: A highly devolved self-managing school system like that in New Zealand gives school leaders and
teachers much autonomy, which requires capacity and professional development to meet responsibilities and use of
evaluation and assessment tools to improve student learning.

      Governance and funding: Schools and universities are among the most autonomous across OECD countries.
Schools are managed by school boards with a focus on student achievement. The government sets annual objectives
in a Statement of Intent for its central education agencies, and the Ministry of Education develops a national policy
framework. Funding aims to support free schooling, and, while tertiary study involves cost to the student, significant
financial support is available.

Key issues

      The average impact of socio-economic background on student’s performance is above the OECD average, and
large performance and completion gaps persist within the student population. Moreover, Māori and Pasifika students
represent more than one-third of the student population, and diversity of the student population is increasing, while
they face lower outcomes and may be less likely to complete their secondary education. System-level policies, schools
and post-secondary schools should focus on improving the educational success of students from diverse backgrounds
and delivering quality education across all schools.

Recent policy responses

      Recent policies have focused on developing specific plans to support Māori and Pasifika students’ performance,
including the Pasifika Education Strategy, a Māori Education Strategy and specific Māori-medium education. A recent
reform is looking to provide more choice for students through the development of new partnership schools, which will
need to be managed to ensure equity.

     A number of reforms in vocational education and training have focused on preventing early school leaving and
ensuring upper secondary completion and beyond, including trades academies and the Youth Guarantee.

      To clarify learning objectives, expectations and provide support to improve performance, New Zealand has also
defined National Standards (2010) and the National Curriculum (2010), and is developing a Student Achievement
Function to support schools (2011).

EDUCATION POLICY OUTLOOK: NEW ZEALAND © OECD 2013                                                                   4
New Zealand achieves higher-than-average scores in PISA 2009 (521 mean score compared to the OECD
average of 493) and the impact of socio-economic status on attainment (17%) was higher than the OECD
average of 14% (Figure 1).
Figure 1. Student performance in reading and relationship between student performance and the
economic, social and cultural status (ESCS), for 15-year-olds, PISA 2009
600 20
% of variation explained
550 15
by the ESCS
Score points
500 10
New Zealand
450 5
OECD average
400 0
Mean reading Overall strength of the
performance relationship between
student performance
and the ESCS
Source: OECD (2010), PISA 2009 Results: What Students Know and Can Do: Student Performance in Reading, Mathematics
and Science (Volume I), OECD Publishing, Paris, http://dx.doi.org/10.1787/9789264091450-en.
Secondary education attainment in New Zealand is lower than the OECD average while tertiary education is
higher (Figure 2). 80% of 25-34 year-olds have attained secondary education (compared to the OECD average of
82%), and 46% have attained tertiary education (compared to the OECD average of 39%).
Figure 2. Upper secondary and tertiary attainment for 25-34 year-olds, 2011
100
% of attainment (population)
80
60
New Zealand
40 OECD average
20
0
Upper secondary Tertiary education
Source: OECD (2013), Education at a Glance 2013: OECD Indicators, OECD Publishing, Paris,
http://dx.doi.org/10.1787/eag-2013-enError! Hyperlink reference not valid..
EDUCATION POLICY OUTLOOK: NEW ZEALAND © OECD 2013 5EQUITY AND QUALITY: TOWARDS INCLUSIVE EDUCATION
IN A CONTEXT OF INCREASING DIVERSITY
Equity indicators show that New Zealand is one of the highest PISA performers, but students’ background
and gender matter in results and there are large performance gaps between the top and the lowest performers.
Fewer than 14.3% of students performed below proficiency Level 2 in reading (compared to the OECD average of
18.1%) (see Figure 3). At the same time, students’ socio-economic background has more impact on their
performance in PISA than the average across OECD countries. Among high performing countries, New Zealand
had the widest range of scores between the bottom 5% and the top 5%.
Inclusive policies in early childhood education (ECE) aim for more equity in the education system. In
2010, most 3-year-olds (86%) were enrolled in ECE (ISCED 0), and this increases to 95% at age 4, one year
before primary school (ISCED 1). The ECE curriculum framework, Te Whāriki (1996), provides a bicultural
framework focused on the individual child, and family and community involvement as an integral part of the
curriculum, encouraging respect for diversity.
Schools are socially diverse and there is comprehensive schooling, but system level practices such as
school choice can hinder equity if not properly managed. New Zealand has comprehensive schooling until age 16,
and low grade repetition rates (5.1%), which can result in a more equitable system. According to PISA 2009, more
disadvantaged students attend schools of mixed socio-economic background in New Zealand than the OECD
average. Students can attend the school of their choice, space permitting, with funding following the student.
Open school choice, if not well managed with policies to mitigate its negative impact, can generate further
inequities. PISA data shows that grouping by ability for some subjects is common. According to OECD research,
this can have a negative impact on students with lower academic performance if extensively practiced.
Increasing diversity needs to go hand in hand with more education equity. In 2009, almost one-third of
students in New Zealand’s schools were Māori (22%) and Pasifika (10%). By 2015, over half of students will
identify with multiple, non-European ethnic heritages. Evidence shows that large performance gaps remain across
ethnic groups. Despite improvements, there are lower performance and lower attainment rates for Pasifika and
Māori students than for their peers.
The challenge: Promoting system-level policies that can improve the educational success of
students from diverse backgrounds, especially Māori and Pasifika students.
Recent policies and practices
The government has set a target to ensure that in 2016, 98% of children starting school will have
participated in quality ECE (Better Public Services). It is reviewing the funding system (2015) to ensure alignment
with priorities.
To support Māori students’ needs, New Zealand delivers Māori-medium education, with certain subjects
taught in Māori language (3% of the student population). Ka Hikitia - Managing for Success: the Māori Education
Strategy 2008-2012 set as one of its goals the "Young people engaged in learning" focus to engage 14-18 year-
old Māori students in education. Set for an initial period of five years with progress monitored annually, Tātaiako:
Cultural Competencies for Teachers of Māori Learners (2012) is a resource to improve teaching of Māori learners
by developing cultural competences for teachers in ECE, primary and secondary schools.
The Pasifika Education Plan 2013-2017 sets out the government’s strategic direction for Pasifika education.
It seeks to increase accountability for Pasifika students’ success and make improvements in practice, harnessed
in greater focus on the use of achievement information as part of more effective community engagement to
address underperformance. It is set for an initial five years, with progress monitored annually.
Reforms that can impact equity have been introduced through the Education Amendment Bill 2012. These
include the introduction of more school choice with a new type of school to ensure options for Māori learners
(Partnership Schools|Kura Hourua), third-party leasing arrangements for ECE centres and the assignment of a
National Student Number to children at a younger age than before to allow earlier interventions.
EDUCATION POLICY OUTLOOK: NEW ZEALAND © OECD 2013 6Figure 3. Mean score in reading performance and percentage of low and top performers, for 15-year-olds,
PISA 2009
600 20
Top performers and low-
performing students (%)
550 15
Mean reading performance
Score points
500 10 Low-performing students
(below Level 2)
Top performers
450 5 (level 5 or above)
400 0
New Zealand OECD average
Source: OECD (2010), PISA 2009 Results: What Students Know and Can Do: Student Performance in Reading, Mathematics
and Science (Volume I), OECD Publishing, Paris, http://dx.doi.org/10.1787/9789264091450-en.
EDUCATION POLICY OUTLOOK: NEW ZEALAND © OECD 2013 7PREPARING STUDENTS FOR THE FUTURE: STRONG LABOUR MARKET
PERSPECTIVES AND HIGH TERTIARY GRADUATION RATES
Labour market perspectives play an important role in the decision to stay in education. In New Zealand,
unemployment rates across education levels are below the OECD average. More youth combine school with work
than in the OECD average (see Figure 4). However, in 2011, the proportion of 15-29 year-olds not in education
and not employed (14.3%) is below the OECD average (15.8%), and evidence points to difficulties in finding a job
or returning to education. Improving youth outcomes requires policies to address skills and support transitions to
the labour market.
New Zealand is fostering policies to fight dropout in upper secondary education, as the completion rate is
18 percentage points below the OECD average. At age 16 (year 11), students have flexibility to choose subjects
of the National Certificate of Educational Achievement (NCEA) based on their interest and ability. Achieving
NCEA 3 level of qualifications provides access to post-secondary or tertiary education, as does passing exams, or
direct entry after age 21. Careers New Zealand provides career support and guidance services for individuals and
schools, and schools employ specialist career advisers. Still, a slightly smaller share of 25-34 year-olds in New
Zealand (80%) has attained upper secondary education compared to the OECD average of 82% (see Figure 2).
The government indicates lower and Pasifika students’ academic performance and completion rates in NCEA
level 3. Completing this level can help prepare youth for employment or further learning.
Vocational education and training (VET) offers various options in post-compulsory education. The New
Zealand Qualifications Framework (NZQF) allows students to earn credits towards vocational qualifications in
both schooling and tertiary contexts. Upper secondary students can explore vocational courses in an integrated
general academic programme. Students in tertiary education can study vocational programmes at 18 institutes of
technology and polytechnics, 3 Māori tertiary institutions (wananga), and private training establishments. Workers
can gain vocational qualifications related to their jobs through industry training, which is part of the tertiary
education system. Industry training covers apprenticeships, foundation education for low-skilled workers and
continuing VET.
Tertiary education in New Zealand includes all post-compulsory education and training programmes, such
as full-time academic study, work-related training and research, and foundation education. With one of the highest
attainment levels across OECD countries (see Figure 2), about 15.6% of all tertiary students are foreigners.
Individuals in New Zealand are more likely to graduate from an academic programme (type-A, 52%) than from a
vocational programme (type-B, 29%) although both graduation rates are well above the OECD average (39%
type-A and 11% type-B).
The challenge: Engaging students to complete studies in upper secondary, VET and beyond and
ensure effective transitions to the labour market.
Recent policies and practices
To ensure more vocational qualifications, the Trades Academies (2009) target upper secondary students
interested in careers in trades or technology by collaborating with schools, tertiary institutions, industry training
organisations and employers. The Service Academies (2009) is a similar initiative with military-style programmes
to encourage students to stay in education and training or enter the labour market. The Gateway initiative aims to
strengthen students’ pathways from school to workplace learning.
The Youth Guarantee (2010) aims to engage 16-17 year-olds in tuition-free education or training. About
7 500 places are funded in 150 tertiary education organisations. An initial evaluation found an increase in
participation.
Ongoing policies, such as the Secondary Tertiary Alignment Resource, (STAR, 1992) propose to engage at-
risk students in upper secondary education by giving them the opportunity to attend tuition-free courses. Funding
is given to schools to support trustees and school leaders in better meeting students' needs.
The Tertiary Education Strategy 2010-15 sets the government’s strategic direction and priorities to target
priority groups, improve system performance and support high quality research that helps to drive innovation.
EDUCATION POLICY OUTLOOK: NEW ZEALAND © OECD 2013 8Figure 4. Percentage of 15-29 year-olds in education and not in education, by educational attainment and
work status, 2011
In Education In Education and Work Employed NEET
100%
80%
% of 15-29 year-olds
60%
40%
20%
0%
New Zealand OECD average New Zealand OECD average New Zealand OECD average
Below upper secondary Upper secondary and non- Tertiary education
tertiary post-secondary
NEET: Neither Employed, nor in Education and Training
Source: OECD (2013), Education at a Glance 2013: OECD Indicators, OECD Publishing, Paris,
http://dx.doi.org/10.1787/eag-2013-en.
EDUCATION POLICY OUTLOOK: NEW ZEALAND © OECD 2013 9SCHOOL IMPROVEMENT: SCHOOL LEADERS AND TEACHERS
HAVE AUTONOMY TO STEER STUDENTS' LEARNING
The key to raising achievement in New Zealand’s 2 581 schools (more than 760 000 students) is to develop
the conditions for school leaders and teachers to succeed. Particular to New Zealand is the fact that around
17 000 of the students study in 155 schools in the Māori-medium education sector (curriculum is in Māori
language for at least 51% of the time). Overall, New Zealand’s learning environments are similar to those in
other OECD countries, with students reporting good relations with their teachers and motivation from their
teachers to read, but also slightly more negative classroom climates than the OECD average. Principals views on
student behaviour are similar to those of principals in other OECD countries (see Figure 5).
School leaders have wide ranging responsibilities, within a framework of considerable autonomy. New
Zealand school principals have three main functions: executive (implementing School Board policy), instructional
(leading school staff) and informational (reporting on school achievement). According to PISA 2009, about 68% of
students are in schools where school principals reported they observe instruction in classrooms (compared to the
OECD average of 50%), and 98% of students have school principals who use student results to develop the
school’s educational goals (compared to the OECD average of 75%). School principals are often responsible for
selecting, appraising and appointing teachers (a role delegated by the Board of Trustees) and, in small schools,
they may also teach. They are appointed by the Board of Trustees according to their criteria. While training is not
mandatory, there are programmes to assist with the development of school leadership skills; one for those who
aspire to become principals, and one for new or first-time principals. Given the high degree of school autonomy,
ensuring school leadership preparation and training can contribute to strengthening capacity across schools in
New Zealand.
Teachers have much professional autonomy, and strengthening their capacity can help improve students’
learning outcomes. New Zealand teachers have the fourth highest teaching time among OECD countries (in
2011, 935 hours per academic year in primary school, compared to the OECD average of 790 hours). The ratio of
teachers' salaries to the earnings of tertiary-educated workers is above the OECD average. Teachers are
expected to analyse students and their needs, and select teaching strategies and materials aligned with the
National Curriculum. Their participation in professional development activities varies across schools and depends
on the quality of school leaders and school boards. Given the strong link between teacher performance and
student outcomes, ensuring teachers' capability and capacity to respond to the needs of all learners, including
Māori and Pasifika, could help improve achievement.
The challenge: Strengthening the capacity of school leaders and teachers to deliver quality
education in all schools.
Recent policies and practices
The Student Achievement Function (2010) was created in the Ministry of Education to work with schools to
raise achievement with a focus on literacy and numeracy. The aim is to support schools in the implementation of
the New Zealand Curriculum and use of the National Standards. A central team will provide training and
professional development and Student Achievement Advisors will work with schools, based on regions.
The Registered Teacher Criteria (2010-13) set a minimum standard for teaching in New Zealand.
A National Standards policy has been introduced to establish national expectations for literacy and
numeracy. It will help schools identify students who are not progressing as expected so they can be supported to
accelerate learning with additional or different help (see Spotlight 1).
Positive Behaviour for Learning (2012) is an initiative to support education organisations that includes
programmes and initiatives for schools, teachers and parents.
EDUCATION POLICY OUTLOOK: NEW ZEALAND © OECD 2013 10Figure 5. The learning environment, PISA 2009
New Zealand Index: OECD average=0
0.5
0.4
0.3
0.2
0.1
0.0
-0.1
-0.2
-0.3
Teacher-student relations Classrooms conducive to School principals
(students' views) learning (students' views) involvement in school
matters (principals' views)
Source: OECD (2010), PISA 2009 Results: What Makes a School Successful? Resources, Policies and Practices (Volume IV),
OECD Publishing, Paris, http://dx.doi.org/10.1787/9789264091559-en.
EDUCATION POLICY OUTLOOK: NEW ZEALAND © OECD 2013 11EVALUATION AND ASSESSMENT TO IMPROVE STUDENT OUTCOMES:
TRUST PLAYS A KEY ROLE
Defining evaluation and assessment strategies is important for improving student outcomes and developing
a better and more equitable school system. New Zealand's evaluation and assessment framework has various
components that provide evidence for policy making (see Figure 6). The Ministry of Education (MoE) oversees the
education system and sets evaluation and assessment guidelines. The Education Review Office (ERO), the New
Zealand Qualifications Authority (NZQA), and the New Zealand Teachers Council (NZTC) evaluate and assess
different aspects of the education system.
System evaluations use international and national student assessments, data collected from primary and
secondary schools, and ERO's thematic reviews. The MoE has created the Education Indicators Framework,
which monitors trends in student outcomes and tracks achievement of sub-groups. Accountability data collected
by the MoE, such as school annual reports, can be further exploited to support school improvement.
Schools and school leaders are trusted to conduct self-reviews, and the ERO does external school
evaluations. The Boards of Trustees ensure that schools implement self-reviews and deliver annual plans and
reports. External school assessments by the ERO are in accordance with school's developmental needs. The
community and the MoE receive internal and external school evaluations.
Teacher appraisals are mandatory and guided by two well-established standards: the Registered Teacher
Criteria and the professional standards of the Guidelines on Performance Management Systems. Alignment is
important for clear understanding of what teachers should know and be able to do throughout their career. The
Education Review Office evaluates school systems and practices as part of their review process, which can
include planning and decisions about professional development that result from teacher appraisal.
Student assessment is developed internally by schools. Assessment in relation to national expectations
(National Standards and Māori medium standards [see Spotlight 1]) is underpinned by assessment for learning
principles and practice. It relies on the professional judgments of teachers across a range of information, including
day-to-day teaching and learning, and the use of nationally validated assessment tools. In the Māori medium, this
process is called Mātaiako, which refers to observation and evaluation of learning taking place, capturing the
activities and helping learners to move along that pathway. Students' qualifications in upper secondary education
are assessed internally and externally by the NZQA, based on the New Zealand Qualifications Framework.
The challenge: Consolidating the components of evaluation and assessment in a clearly mapped
framework and ensuring the capacity of all players to evaluate.
Recent policies and practices
Comprised of the New Zealand Curriculum (2007, implemented from 2010) and Te Marautanga o Aotearoa
(2008, implemented from 2011), the National Curriculum outlines outcomes, values, principles, key competencies,
learning areas and achievement objectives to guide and direct teaching and learning in English and Māori
medium. Schools adapt this national framework to their needs.
National standards for primary schools have been recently introduced to support and enhance the national
curriculum by providing clarity around progress and achievement expected (see Spotlight 1).
A review of the National Certificate of Educational Achievement (NCEA) was conducted by the MoE and the
NZQA to align NCEA achievement standards with the national curriculum.
The New Zealand Qualifications Framework (2010) has been followed with a targeted review of
qualifications which aims to reduce duplication and proliferation of certificate and diploma qualifications, and to
ensure that the system is easy to understand for students and employers.
The National Monitoring Study of Student Achievement (2012) aims to survey, assess and understand
student achievement of 9-13 year-olds using the New Zealand Curriculum.
Public Achievement Information aims for greater public transparency and more effective use of information
at all levels of the system to support improved learning. The MoE publishes student achievement data and other
information.
EDUCATION POLICY OUTLOOK: NEW ZEALAND © OECD 2013 12Figure 6. Percentage of students in schools where the principal reported assessments of students in
national modal grade for 15-year-olds, PISA 2009
New Zealand OECD average
100
80
% of students
60
40
20
0
To make decisions To monitor the school’s To make judgements To identify aspects of
about students’ progress from year to about teachers’ instruction or the
retention or promotion year effectiveness curriculum that could
be improved
Source: OECD (2010), PISA 2009 Results: What Makes a School Successful? Resources, Policies and Practices (Volume IV),
OECD Publishing, Paris http://dx.doi.org/10.1787/9789264091559-en.
EDUCATION POLICY OUTLOOK: NEW ZEALAND © OECD 2013 13Spotlight 1. Setting national standards for diverse learners
In a context of decentralisation and school autonomy, there is a greater need to provide clarity of
expectations for students across OECD countries. Different efforts have focused on evaluation and assessment
and more directly on setting educational goals and student learning objectives more clearly. Setting standards has
been part of this trend. In New Zealand, standards have been set to clarify national expectations and identify and
support students who are not on track for success. More concretely, New Zealand's standards describe what
students should know and be able to do at each level of their schooling in order to access and meet the demands
of all learning areas of the curriculum:
The National Standards (2010) were introduced for primary school years 1-8 (approximately 5-13 year-olds)
to support schools and students using the New Zealand Curriculum. They establish national expectations in
mathematics, reading and writing.
National Standards for Māori-medium education (Ngā Whenaketanga Rumaki Māori) (2010) were introduced
for years 1-10 to support schools and students using the national curriculum for Māori-medium education
(Te Marautanga o Aotearoa). They establish national expectations for oral language (korero), reading
(pāanui), writing (tuhituhi) and mathematics (pāngarau).
To implement these standards, assessment tools have been developed, aligned to standards and
professional development opportunities for teachers, school leaders and trustees. Assessments in relation to
national expectations are made at least twice a year. The first assessment is termed a "progress towards"
assessment and the second, a final assessment. Teachers are expected to make professional judgments on
achievement, drawing on both formal and informal information, in light of descriptions provided in concrete
examples of what achievement looks like at different levels. Assessment information is gathered as an integral
part of day-to-day teaching and learning and used to report individual student progress to parents twice a year.
The primary purpose of the National Standards policy in New Zealand is to guide teaching and learning in
the classroom. While the expectation is that teachers are responsive to the unique learning and learner contexts
of every student, the standards are intended as signposts at yearly intervals to enable early identification of
students who are not progressing as well as might be expected and ensure a timely response in the form of
different or additional support.
National Administration Guidelines set out the requirements for self-review and reporting against the
National Standards. Student achievement information contributes to school review, enabling schools to take their
students’ progress in relation to national expectations into account when planning school programmes and
deciding school goals and targets. School planning is reflected in each school’s annual charter, and achievement
outcomes, including achievement data by year level, gender and ethnicity (Māori and Pasifika), are included in
each school’s annual report. At system level, student achievement data is used to inform decision-making in
relation to goals and targets, policy development and the allocation of resources across the system to support
student learning.
EDUCATION POLICY OUTLOOK: NEW ZEALAND © OECD 2013 14GOVERNANCE: STAKEHOLDER AUTOMONY
WITHIN A NATIONAL FRAMEWORK
The government sets education policy and the Ministry of Education develops it. The Ministry oversees the
education system, develops curriculum and assessment standards for students and teachers, intervenes in
instances of school failure, provides funding and leads cross-government initiatives. Every year, the Ministry sets
objectives in a Statement of Intent, a planning and accountability document with a five-year horizon. Other bodies
help shape national education policy:
The Education Review Office evaluates and reports on quality of education.
The New Zealand Qualifications Authority develops the Qualifications Framework, oversees the
National Certificate of Educational Achievement, and ensures quality of qualifications and of tertiary
education organisations outside the university sector.
The New Zealand Teachers Council is responsible for maintaining professional standards of the
teaching profession.
Careers New Zealand provides advice on career planning, jobs and training.
The Tertiary Education Commission manages tertiary education funding and provides support to
tertiary education institutions and organisations.
Other stakeholders include the School Trustees Association, the Council for Educational Research,
principals’ associations, principals’ and teachers' unions, and specific types of school associations and
groups from business and cultural sectors.
Schools in New Zealand are among the most autonomous schools across OECD countries. Since 1988,
there has been a devolution of management responsibilities to schools along with increased power for the
Ministry to intervene in failing schools since 2001. In 2007, 24% of decisions at lower secondary level were taken
centrally, with schools taking the remaining 76% of decisions (see Figure 7 for 2010 OECD average). From
available data, only English and Dutch schools had higher decision-making capacity.
Different levels of education have different governance arrangements. Elected governing boards run
individual early childhood education providers, and are responsible for staffing, financial management,
compliance, reporting, and setting and measuring performance targets. Boards of Trustees govern each school.
Elected every three years, they are accountable to the central government and the community. They are
responsible for maintaining the school charter and short-term and long-term plans, ensuring compliance with the
National Education Guidelines, setting the school’s education policies, managing finances and employing staff,
and holding principal and staff accountable for performance. Tertiary education institutions are accountable to the
Tertiary Education Commission for delivery on their investment plans. They are governed by councils whose
functions and duties include governing their institution and appointing its vice-chancellor or chief executive.
The challenge: Guiding the system and ensuring the capacity of Boards of Trustees to formulate and
implement education policy consistently across educational institutions.
Recent policies and practices
The government’s Better Public Services programme (2011) presented ten public sector commitments to
achieve within three to five years, including three related to education:
by 2016, 98% of children starting school will have participated in quality early childhood education
by 2017, 85% of 18-year-olds will have NCEA level 2 or an equivalent qualification
by 2017, 55% of 25-34 year olds will have a qualification at level 4 or above.
The Ministry Statement of Intent (2012-17) set two priority areas: 1) improve education outcomes for Māori
and Pasifika, disadvantaged and special needs learners; 2) maximise education’s contribution to the economy.
The Education Amendment Bill (2012) defines a focus on students’ education as the key function of school
boards, setting clear expectations for boards and ensuring that student achievement is at the heart of their role.
The Ministry has developed the Education Counts website, which includes all education information as a
one-stop online space with access to statistics, quantitative information and research, and detailed information on
all schools in the country.
EDUCATION POLICY OUTLOOK: NEW ZEALAND © OECD 2013 15Figure 7. Percentage of decisions taken in public lower secondary schools at each level of government,
2010
100
% of decisions taken 80 School
Local
60
Regional or Sub-regional
40 Central or State
20
0
OECD average
Source: OECD (2012), Education at a Glance 2012: OECD Indicators, OECD Publishing, Paris, http://dx.doi.org/10.1787/eag-
2012-en.
EDUCATION POLICY OUTLOOK: NEW ZEALAND © OECD 2013 16FUNDING: HIGH PUBLIC AND PRIVATE SPENDING,
STRONG STUDENT SUPPORT FOR TERTIARY EDUCATION
New Zealand invests more on educational institutions than the OECD average. Expenditure on
educational institutions at all levels is 7.3% of GDP, above the OECD average of 6.3% (see Figure 8). Between
2005 and 2010, New Zealand has increased its spending by 0.8 percentage points, above the OECD average of
0.4 percentage points. As in most OECD countries, a large portion of expenditure on educational institutions
comes from public sources (82.6%, compared to the OECD average of 83.6%). Private expenditure on
educational institutions is 17.4%, above the OECD average of 16.4%.
New Zealand spends comparatively more per full-time student than other OECD countries in early childhood
education and post-secondary non-tertiary education, but comparatively less per student at other levels of
education. Annual per-student expenditure over all levels (from primary to tertiary education) was USD 8 192 in
2010. This is below the OECD average of USD 9 313 per student, because the proportion of school-age children
in New Zealand's population is higher than the OECD average. From 2005 to 2010, expenditure per student
increased by 19% in primary, secondary and post-secondary non-tertiary education, while enrolment stayed
constant (compared to the OECD average decrease of 3%). In the case of tertiary education, expenditure per
student decreased by 4% while enrolment increased by 33% compared to the OECD averages of 8% and 13%
respectively).
Funding is provided by the Ministry of Education (at ECE and school level) and via the Tertiary Education
Commission (TEC), which is responsible for post-school education. The Ministry provides funding for public
schools based on the number of students and their grade levels, the socio-economic status of the community,
and the school’s location. The Board of Trustees manages funding for its school and is audited by the government
and the Education Review Office. Rural schools and schools catering to students from lower socio-economic
backgrounds can receive adjustments. The government can also provide in-kind resourcing such as for ICT
support and broadband access. Schools are also able to raise funds locally.
In tertiary education, the TEC funds eligible organisations, and there is considerable private funding.
Tertiary education organisations and industry tertiary organisations develop and submit investment plans to the
TEC for funding approval. The TEC then monitors delivery on these plans. Students receive financial support
through allowances and the Student Loan Scheme. In New Zealand, 46.6% of public expenditure in tertiary
education in 2010 was directed as financial aid to students, more than double the OECD average of 21.7%.
In 2012, budget changes and new initiatives took place at all levels of education. In early childhood
education, more funding was allocated to meet increased participation targets for students from disadvantaged
backgrounds (low socio-economic status, special needs, Māori and Pasifika). In primary and secondary
education, funding prioritised aligning achievement standards for the different curricula, addressing student
needs, extra staffing in large schools and improving technological and physical infrastructure. At the tertiary level,
funding increases aimed to maintain or improve the provision of education and research (especially in science
and engineering) and to maintain financial support for students who need it most. Also at this level, the
government promoted the need to save and optimise funds by focusing eligibility for student loans and allowances
on students who most need support and eliminating low priority programmes.
The challenge: Ensuring that resources effectively meet the demands of students at different
education levels.
Recent policies and practices
The Aspire Scholarship (2009) is additional funding from the government to increase access for low-income
families to attend private secondary schools.
The Student Achievement Component is an investment approach used by the government to fund tertiary
education, in part linked to educational performance of the institution. It is based on four indicators: progression,
retention, course completions and qualification completions. Industry training organisations will also have
performance-linked funding.
EDUCATION POLICY OUTLOOK: NEW ZEALAND © OECD 2013 17Figure 8. Expenditure on educational institutions as a percentage of GDP, by level of education, 2010
8
7 Tertiary
Expenditure as % of GDP
6
Upper secondary and post-
5 secondary non-tertiary
4 Primary and lower secondary
3
2 Pre-primary
1
Education combined (incl.
0 undistributed programmes)
New Zealand OECD average
Source: OECD (2013), Education at a Glance 2013: OECD Indicators, OECD Publishing, Paris,
http://dx.doi.org/10.1787/eag-2013-enError! Hyperlink reference not valid..
EDUCATION POLICY OUTLOOK: NEW ZEALAND © OECD 2013 18ANNEX A: STRUCTURE OF NEW ZEALAND’S EDUCATION SYSTEM EDUCATION POLICY OUTLOOK: NEW ZEALAND © OECD 2013 19
ANNEX B. STATISTICS

                                                                   New         Average
  #                      List of key Indicators                                            Min      Max
                                                                  Zealand      or total
                                             Background information
 Political context
     Public expenditure on education as a percentage
 1                                                                     7.2 %    5.8 %     3.8 %    8.8 %
     of GDP, 2010 (EAG 2013)
 Economy
     GDP per capita, 2010, in equivalent USD converted using
 2                                                                    29 629              15 195 84 672
     PPPs (EAG2013)
 3 GDP growth 2011 (OECD National Accounts)                            0.5 %    1.8 %     -7.1 %   8.5 %
 Society
 4 Population density, Inhab/km2, 2010 (OECD Statistics)               16.7     138        2.9      492
 5 Young people, aged less than 15, 2010 (OECD Statistics)            20.5 %   17.3 %     13 %     28.1 %
 6 Foreign-born population, 2009 (OECD Statistics)                    22.7 %   14.1 %     0.8 %    36.9 %
                                              Education outcomes
 7 Mean reading performance (PISA 2009)                                 521      493       425      539
 8 Change in Mean reading performance, 2000-09 (PISA 2009)               -8       1        -31      40
     Change in Mean mathematics performance, 2003-09 (PISA
 9                                                                       -4       0        -24      33
     2009)
 10 Change in Mean science performance, 2006-09 (PISA 2009)               2       3        -12      30
     Enrolment rates in early childhood education and primary
 11                                                                    90 %    74.4 %     11.6 %   98 %
     education, ages 3 and 4, 2011 (EAG 2013)
     Population that has attained below upper secondary
 12                                                                    26 %     25 %       7%      68 %
     education, 25-64 year-olds, 2011 (EAG 2013)
     Population that has attained at least upper secondary
 13                                                                    80 %     82 %      43 %     98 %
     education, 25-34 year-olds, 2011 (EAG 2013)
     Population that has attained tertiary education, 25-34 year-olds
 14                                                                    46 %     39 %      19 %     64 %
     (EAG 2013)
     Population whose highest level of education is vocational
 15 upper secondary or post-secondary non-tertiary, 2011 (EAG          25 %    33.5 %     8.4 %    73.9 %
     2013)
     Unemployment rates, 25-64 year-olds, 2011 (EAG 2013)
     Below upper secondary                                             6.5 %   12.6 %     2.7 %    39.3 %
 16
     Upper secondary and post-secondary non-tertiary                   4.4 %   7.3 %      2.2 %    19.2 %
     Tertiary education                                                3.6 %   4.8 %      1.5 %    12.8 %
                                           Students: Raising outcomes
 Policy lever 1: Equity and quality
 17 First age of selection in the education system (PISA 2009)          16       14        10       16
     Proficiency levels on the reading scale (PISA 2009)
 18 Students below Level 2                                            14.3 %   18.8 %     5.8 %    40.1 %
     Students at level 5 or above                                     15.7 %   7.6 %      0.4 %    15.7 %
     Between- and within-school variance in reading performance (PISA 2009)
 19 Between schools                                                    2 622    3 616      665     6 695
     Within schools                                                    8 228    5 591     2 795    8 290
     Students reporting that they have repeated at least a grade in
 20 primary, lower secondary or upper secondary schools (PISA          5.1 %    13 %       0%      36.9 %
     2009)

EDUCATION POLICY OUTLOOK: NEW ZEALAND © OECD 2013                                                           20
New average
# List of key Indicators Min Max
Zealand or total
Variance in student performance explained by student socio-
21 17 % 14 % 6% 26 %
economic status (PISA 2009)
Difference in reading performance between native students
22 and students with an immigrant background, after accounting 14.0 27 -17.0 85.0
for socio-economic status (PISA 2009)
Gender differences in student performance on the reading
23 -46 -39 -55 -22
scale (PISA 2009)
Policy lever 2: Preparing students for the future
Upper secondary graduation rates, 2011 (EAG 2013)
24 General programmes m 50 % 18 % 82 %
Pre-vocational/ vocational programmes m 47 % 4% 99 %
Change in upper secondary graduation rates (average annual
25 m 0.6 % -1 % 3.6 %
growth rate 1995-2011), (EAG 2013)
Graduation rates, first-time graduates, 2011 (EAG 2013)
Tertiary-type 5A 52 % 40 % 21 % 60 %
26 Tertiary-type 5B 29 % 11 % 0% 29 %
Tertiary-type 5A (average annual growth rate 1995-2011) 2.7 % 4% -1 % 11 %
Tertiary-type 5B (average annual growth rate 1995-2011) 5.5 % 0% -20 % 14 %
Youth population not in education, employment or training 15-
27 14.3 % 15.8 % 6.9 % 34.6 %
29 year olds, 2011 (EAG 2013)
Institutions: Improving schools
Policy lever 3: School improvement
Index of teacher-student relations based on students’ reports
28 0.19 0 -0.42 0.44
(PISA 2009)
Index of disciplinary climate based on students' reports (PISA
29 -0.12 0 -0.40 0.75
2009)
Teachers younger than 40 years-old, 2011 (EAG 2013)
Primary education 35.6 % 41 % 15 % 60 %
30
Lower secondary education 34.9 % 39 % 11 % 56 %
Upper secondary education 32.8 % 34 % 7% 47 %
Number of teaching hours per year in public institutions, 2011 (EAG 2013)
Primary education 935 790 589 1 120
31
Lower secondary education 848 % 709 415 1 120
Upper secondary education 760 664 369 1 120
Ratio of teachers’ salaries to earnings for full-time, full-year adult workers with tertiary education,
2011 (EAG 2013)
32 Primary education 1.03 % 0.82 0.44 1.34
Lower secondary education 1.05 % 0.85 0.44 1.34
Upper secondary education 1.08 % 0.89 0.44 1.40
Change in teachers’ salaries between 2000 and 2011 in lower
33 2.72 % 16 % -9 % 103 %
secondary education (2000 = 100), (EAG 2013)
Impact of teacher appraisal and feedback upon teaching, 2007- Not
34 33.9 % 10.9 % 69.1 %
08 (TALIS 2008) participating
Teachers who wanted to participate in more development than Not
35 55 % 31 % 85 %
they did in the previous 18 months, 2007-08 (TALIS 2008) participating
School principals’ views of their involvement in school matters,
36 0.20 -0.02 -1.29 1.03
Mean Index, (PISA 2009)
EDUCATION POLICY OUTLOOK: NEW ZEALAND © OECD 2013 21New average
# List of key Indicators Min Max
Zealand or total
Policy lever 4: Evaluation and assessment to improve student outcomes
Assessment purposes (PISA 2009)
To make decisions about students’ retention or promotion 77.2 % 78 % 1% 100 %
To monitor the school’s progress from year to year 97.2 % 77 % 35 % 98 %
37
To make judgements about teachers’ effectiveness 60.8 % 47 % 8% 85 %
To identify aspects of instruction or the curriculum that could
98.3 % 77 % 47 % 98 %
be improved
Frequency and source of teacher appraisal and feedback, 2007-08 (TALIS 2008)
Not
Once every two years or less 35.8 % 13.8 % 65.6 %
participating
38 Not
At least once per year 52.2 % 27.6 % 68.6 %
participating
Not
Monthly or more than once per month 12 % 3.3 % 29.8 %
participating
Systems: Organising the system
Policy lever 5: Governance
Decisions taken at each level of government in public lower secondary education, 2011 (EAG 2012)
Central or state government 0% 36 % 0% 87 %
39 Regional or sub-regional government m 6% 0% 36 %
Local government m 17 % 4% 100 %
School government m 41 % 5% 86 %
Policy lever 6: Funding
Annual expenditure per student by educational Institutions, for all services, in equivalent USD
converted using PPPs for GDP, 2010 (EAG 2013)
40 Pre-primary education 11 495 6 762 2 280 20 958
Primary education 6 842 7 974 1 860 21 240
Secondary education 8 170 9 014 2 470 17 633
Tertiary education 10 418 13 528 6 501 25 576
Relative proportions of public and private expenditure on educational institutions, 2010 (EAG 2013)
Public sources 82.6 % 83.6 % 57.9 % 97.6 %
All private sources 17.4 % 16.4 % 2.4 % 42.1 %
41 Public sources, index of change in expenditure on educational
138 136 101 195
institutions (2000-2010)
All private sources, index of change in expenditure on
m 211 104 790
educational institutions (2000-2010)
Note: The average, minimums and maximums refer to OECD countries except in TALIS where they refer to
participating countries. "m" refers to data not available.
PISA values that are statistically significant are indicated in bold.
EDUCATION POLICY OUTLOOK: NEW ZEALAND © OECD 2013 22REFERENCES AND FURTHER READING Education Information and Analysis Group/Group Maori (2010), "Nga Haeata Matauranga – The Annual Report on Maori Education, 2008/09", Ministry of Education, Wellington, http://www.educationcounts.govt.nz/publications/series/5851/75954/foundation-years. Eurydice (2012), "Education in the News", National Foundation for Educational Research, http://www.nfer.ac.uk/nfer/index.cfm?03E5E02C-C29E-AD4D-0F9B-1586BD18095D. Ministry of Education: http://www.minedu.govt.nz. Ministry of Education, Budget 2012, http://www.minedu.govt.nz/theMinistry/Budget/Budget2012.aspx. Ministry of Education, Youth Guarantee, http://youthguarantee.net.nz. Ministry of Education (2007), "Improving School Leadership: Country Background Report for New Zealand", http://www.oecd.org/education/preschoolandschool/38740175.pdf. Ministry of Education (2008), "The New Zealand Education System: An overview", http://www.minedu.govt.nz/~/media/MinEdu/Files/EducationSectors/InternationalEducation/ForInternationalStudentsAn dParents/NZEdSysOverview.pdf. Ministry of Education (n.d.), "Te Whāriki", Ministry of Education's early childhood curriculum policy statement, http://www.educate.ece.govt.nz/learning/curriculumAndLearning/TeWhariki.aspx. Ministry of Education (2010), "OECD Review on Evaluation and Assessment Frameworks for Improving School Outcomes: New Zealand Country Background Report", Ministry of Education, Wellington, http://www.oecd.org/education/preschoolandschool/47797042.pdf. Ministry of Education (n.d.), "Ka Hikitia – Managing for Success: The Maori Education Strategy 2008-2012", http://www.minedu.govt.nz/theMinistry/PolicyAndStrategy/KaHikitia.aspx. Nusche, D. et al. (2012), OECD Reviews of Evaluation and Assessment in Education: New Zealand, OECD Publishing, Paris, http://www.oecd.org/education/preschoolandschool/49681441.pdf. New Zealand Council for Educational Research (1999), "Impact of education reforms", Cathy Wylie, http://www.nzcer.org.nz/research/impact-education-reforms. OECD (2008), Education at a Glance 2008: OECD Education Indicators, OECD Publishing, Paris, www.oecd.org/edu/eag2008. OECD (2009), Creating Effective Teaching and Learning Environments: First Results from TALIS, OECD Publishing, Paris, http://www.oecd.org/dataoecd/17/51/43023606.pdf. OECD (2010), PISA 2009 Results: What Students Know and Can Do – Student Performance in Reading, Mathematics and Science (Volume I), OECD Publishing, Paris, http://dx.doi.org/10.1787/9789264091450-en. OECD (2010), PISA 2009 Results: Overcoming Social Background – Equity in Learning Opportunities and Outcomes (Volume II), OECD Publishing, http://dx.doi.org/10.1787/9789264091504-en. OECD (2010), PISA 2009 results: What makes a school successful? Resources, Policies and Practices (Volume IV), OECD, Paris, http://dx.doi.org/10.1787/9789264091559-en. EDUCATION POLICY OUTLOOK: NEW ZEALAND © OECD 2013 23
OECD (2010), OECD Economic Surveys - Country Index,
http://www.oecd.org/eco/surveys/listofeconomicsurveysofnewzealand.htm

OECD (2010), Learning for Jobs, OECD Publishing, Paris, http://www.oecd.org/ireland/44592419.pdf.

OECD (2011), "PISA In Focus 6: When students repeat grades or are transferred out of school: What does it mean for
education systems?", http://www.oecd.org/pisa/pisainfocus/48363440.pdf.

OECD (2011), Economic Policy Reforms: Going for Growth 2011: Country Notes,
http://www.oecd.org/document/31/0,3746,en_2649_37443_47449183_1_1_1_37443,00.html (accessed 4 July 2012).

OECD (2012), Equity and Quality in Education: Supporting Disadvantaged Students and Schools, OECD Publishing,
Paris, http://dx.doi.org/10.1787/9789264130852-en.

OECD (2012), Starting Strong III: A Quality Toolbox for Early Childhood Education and Care, OECD Publishing, Paris,
http://dx.doi.org/10.1787/9789264123564-en and
http://www.oecd.org/edu/school/startingstrongiiiaqualitytoolboxforecec.htm

OECD (2012), Education at a Glance 2012: OECD Education Indicators, OECD Publishing, Paris,
http://dx.doi.org/10.1787/eag-2012-en.

OECD (2013), Education at a Glance 2013: OECD Indicators, OECD Publishing, Paris, http://dx.doi.org/10.1787/eag-
2013-en

Tertiary Education Commission – Te Amorangi Mātauranga Matua (TEC): http://www.tec.govt.nz.

EDUCATION POLICY OUTLOOK: NEW ZEALAND © OECD 2013                                                               24
You can also read