2018 STATE OF COLLEGE ADMISSION - National Association for College ...
←
→
Page content transcription
If your browser does not render page correctly, please read the page content below

2018                       STATE OF
                           COLLEGE ADMISSION
MELISSA CLINEDINST AND POOJA PATEL
ACKNOWLEDGMENTS

    ACKNOWLEDGMENTS
    The National Association for              The association also appreciates    officer; John McGrath, deputy
    College Admission Counseling            the US Department of Education        executive director; Shanda Ivory,
    (NACAC) wishes to acknowledge           and the Higher Education Research     director of communications,
    the following key individuals and       Institute for sharing the education   publications and technology;
    groups for their contributions to       data they collect for inclusion in    Kristen Garman, associate director
    this report.                            the report.                           of communications, publications
       Most importantly, NACAC would          The authors of the report wish      and technology; Mary Stegmeir,
    like to thank the secondary school      to thank the following members        assistant director for content
    counselors, admission officers, and     of the NACAC staff for assistance     and marketing; and Sarah Cox,
    institutional research staff who gave   with survey development               associate director of editorial and
    their valuable time to participate in   and administration, and with          creative services.
    the annual Admission Trends Survey      reviewing, editing, designing, and       Special thanks to Anna-Maria
    and Counseling Trends Survey.           promoting the final report: David     Koranteng, former NACAC research
    The report would not be possible        Hawkins, executive director of        associate, for her contributions
    without the data collected from         educational content and policy;       to survey administration and
    these surveys.                          Joyce Smith, chief executive          data analysis.

2   NATIONAL ASSOCIATION FOR COLLEGE ADMISSION COUNSELING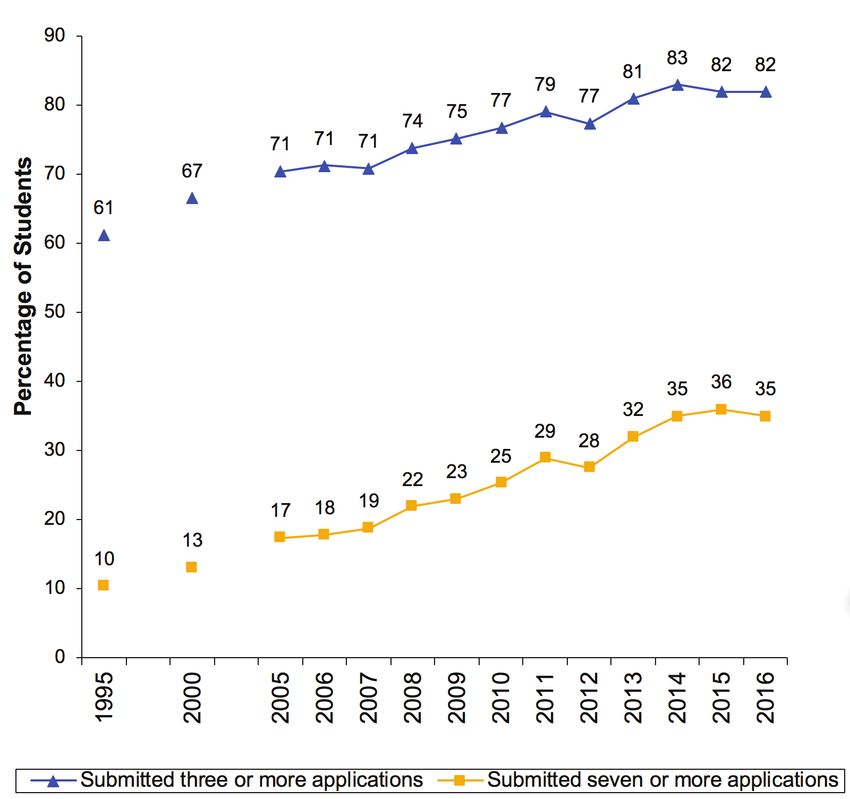
EXECUTIVE SUMMARY

EXECUTIVE SUMMARY
Highlights from the 2018 State of                          65.4 percent for Fall 2016.1 The    Recruitment and Yield
College Admission report include                           national average acceptance rate    Strategies
findings related to the transition                         is down slightly after increasing   College admission offices use a
from high school to postsecondary                          steadily from a low of 63.9         variety of strategies to recruit
education in the United States,                            percent in Fall 2012 to 66.1        prospective students, particularly
gathered primarily through                                 percent in Fall 2015.               those who would be likely to
NACAC’s annual Admission                                                                       attend if admitted. Colleges are
                                                         • Decline in Average Yield Rate       broadening their recruitment
Trends Survey and Counseling
                                                           for First-Time Freshmen             efforts to bring in more transfer
Trends Survey. The 2018 report
                                                           Continues: The average yield        and international students.
also includes information about
                                                           rate for Fall 2016 (33.6 percent)
the recruitment and admission                                                                  • Top Recruitment Strategies:
                                                           is down from 35.1 percent in
process for transfer and                                                                         Email and institutional websites
                                                           Fall 2015 and 36.2 percent in
international students.                                                                          are the primary means by
                                                           Fall 2014.
                                                                                                 which colleges recruit first-time
College Applications                                     • Transfer Acceptance Rate              freshmen, transfer students, and
The increase in the number of                              Slightly Lower than Freshmen          international students. However,
colleges to which each student                             Rate; Yield Much Higher:              colleges employ a broader range
applies continues a near perfectly                         Among institutions that enroll        of strategies when recruiting
upward trend, which is reflected                           transfer students, average            domestic high school students.
in college reports of increased                            selectivity for Fall 2017 was         Four other factors were each
application volume.                                        62 percent, compared to 65            rated as considerably important
• Growth in Application                                    percent for first-time freshmen.      by at least 50 percent of
  Volume Continues: Between                                However, more than half (54           colleges—hosting campus visits,
  the Fall 2016 and Fall 2017                              percent) of transfer applicants       outreach to parents and high
  admission cycles, the number                             who were admitted ultimately          school counselors, high school
  of applications from first-time                          enrolled, compared to only 28         visits, and college fairs.
  freshmen increased 4 percent;                            percent of freshman admits.
                                                                                               • Early Decision (ED) and Early
  applications from prospective                          • International Student                 Action(EA) Activity Increases:
  transfer students increased by                           Acceptance Rate is Low;               Between Fall 2016 and Fall
  3 percent; and international                             Yield Slightly Higher than            2017, colleges reported an
  student applications increased by                        First-Time Freshmen: At               average increase of 4 percent in
  8 percent, on average.                                   institutions that enroll first-       the number of Early Decision
• Colleges Accept Nearly                                   time international students, the      applicants and 5 percent in ED
  Two-Thirds of First-Time                                 Fall 2017 admit rate for this         admits. The number of Early
  Freshmen, on Average: The                                population (52 percent) was           Action applications increased
  percentage of applicants offered                         lower than both transfer and          by 9 percent and the number of
  admission at four-year colleges                          first-time freshmen students.         students accepted through EA
  and universities in the United                           The average yield rate for            increased by 10 percent.
  States—referred to as the                                international students was
  average selectivity rate—was                             30 percent.

______________________________________________________

1
    Based on US Department of Education data. Fall 2016 is the most recent available.

                                                                                                    2018 STATE OF COLLEGE ADMISSION   3
EXECUTIVE SUMMARY
• Wait List Activity Increases; • Top Factor for International • College Counseling Staff:
Likelihood of Wait List Students is English Proficiency For the 2017–18 academic
Acceptance Remains Low: For Exam Scores: After English year, 33 percent of public
the Fall 2017 admission cycle, 40 proficiency, the factors for schools reported employing
percent of institutions reported admission decisions with at least one counselor (full- or
using a wait list. Institutions international applicants are part-time) whose exclusive
accepted an average of 25 percent remarkably similar to those for responsibility was to provide
of all students who chose to domestic students, with one college counseling, compared to
remain on wait lists. From Fall notable exception. A greater 68 percent of private schools.
2016 to Fall 2017, the number proportion of colleges rated
• Time Available for College
of students offered a place on an the essay/writing sample as
Counseling: Some differences
admission wait list increased by considerably important for
exist between the duties and
12 percent, on average. international applicants, likely
activities of counselors employed
because of the additional
at public schools versus those
Factors in Admission confirmation of English skills
who work at private schools.
Decisions that the essay provides.
On average, public school
The factors that admission officers • For Transfer Admission counselors spent 21 percent of
use to evaluate applications from Decisions, Grades Matter their time on postsecondary
first-time freshmen have remained Most: The only transfer counseling in 2017–18 , while
largely consistent over the past admission decision factors their private school counterparts
20 years. Students’ academic rated considerably important spent 47 percent of their time on
achievements—which include by a substantial proportion of college counseling.
grades, strength of curriculum, and colleges were overall GPA at the
admission test scores—constitute student’s prior postsecondary
the most important factors in the institution and average grades in
admission decision. Admission transferrable courses.
decision factors for first-time
international students are similar to College Counseling in
those for domestic students, but the Secondary Schools
transfer admission decision process Access to college information and
differs in significant ways. counseling in school is a significant
benefit to students in the college
• Admission Offices Identify
application process. For many
Grades, High School
students, particularly those in
Curriculum, and Test Scores
public schools, college counseling is
as Top Factors for First-Time
limited at best. Counselors are few
Freshmen: The top factors in
in number, often have large student
the admission decision were:
caseloads, and have additional
overall high school GPA, grades
constraints on the amount of
in college preparatory courses,
time they can dedicate to college
admission test scores, and strength
counseling.
of curriculum. Among the next
most important factors were the • Student-to-Counselor Ratio:
essay, a student’s demonstrated According to US Department
interest, counselor and teacher of Education data, in 2015-16
recommendations, class rank, and each public school counselor
extracurricular activities. (including elementary and
secondary) was responsible for
470 students, on average.
4 NATIONAL ASSOCIATION FOR COLLEGE ADMISSION COUNSELINGINTRODUCTION
INTRODUCTION
many benefits that college graduates In recognition of the important
NACAC’s Mission enjoy, including: role that community colleges have
Supporting students in the transition in achieving national postsecondary
from high school to college has been • higher incomes and increased
attainment goals, NACAC has more
at the core of NACAC’s mission lifetime earnings
recently expanded the association’s
since the association was founded • lower levels of unemployment and resources, advocacy, and research
in 1937. Given changes in both poverty efforts to serve community college
the national and global economy professionals. An increasing number
in recent decades, as well as rapidly • decreased reliance on public
of students are achieving their
shifting student demographics, assistance programs
educational goals at two-year colleges
the role of professionals who assist • increased job satisfaction and exploring transfer pathways to
students in this process has never a bachelor’s degree. Transferring also
been more important. Expert • greater likelihood of receiving
provides an opportunity for students
projections indicate that 65 percent employer-sponsored pensions and
to find success when the first college
of US jobs will require some type of health insurance
enrollment experience proves to not
postsecondary education by 2020; • healthier lifestyles serve the student well. According
however, the US will lag by 5 million to US Department of Education
workers with those credentials if • higher levels of civic engagement.3
data, approximately one-third (36
postsecondary attainment rates do Unfortunately, as of 2017 only 34 percent) of all first-time degree-
not increase substantially.1 Nearly percent of all adults age 25 and older seeking students attended a two-year
all of the jobs (99 percent) created had obtained at least a bachelor’s institution in Fall 2016.5 Thirty-
during the most recent recession degree.4 Even more significant, eight percent of students who began
recovery (since 2008) have gone to underserved minority groups and postsecondary education in Fall
workers with at least some college students from low-SES backgrounds 2011 transferred at least once in the
education.2 To the detriment of fall behind in every step of the following six years.7 And, contrary
individuals and communities, those attainment process: high school to popular belief, many students
whose highest degree is a high graduation, college enrollment, and “reverse transfer,” meaning they
school diploma are denied the postsecondary credential completion. move from a four-year college to a
______________________________________________________
1
Carnevale, A.P., Smith, N., and Strohl, J. (2013). Recovery: Job Growth and Education Requirements Through 2020. Georgetown
University Center on Education and the Workforce.
2
Carnevale, A.P., Jayasundera, T., and Gulish, A. (2016). America’s Divided Recovery: College Haves and Have-Nots. Georgetown
University Center on Education and the Workforce.
3
Ma, J., Pender, M., Welch, M. (2016). Education Pays 2016: The Benefits of Higher Education for Individuals and Society. College Board:
Washington, DC.
4
US Census Bureau. (2017). Educational Attainment in the United States: 2017. Washington, DC: Government Printing Office.
5
US Department of Education. (2017). Digest of Education Statistics. Table 305.10. Washington, DC: NCES.
6
Shapiro, D., Dundar, A., Huie, F., Wakhungu, P.K., Bhimdiwali, A., Nathan, A., & Youngsik, H. (2018, July). Transfer and Mobility:
A National View of Student Movement in Postsecondary Institutions, Fall 2011 Cohort (Signature Report No. 15). Herndon, VA:
National Student Clearinghouse Research Center.
7
Shapiro, D., Dundar, A., Huie, F., Wakhungu, P.K., Bhimdiwali, A., Nathan, A., & Youngsik, H. (2018, July). Transfer and Mobility:
A National View of Student Movement in Postsecondary Institutions, Fall 2011 Cohort (Signature Report No. 15). Herndon, VA:
National Student Clearinghouse Research Center.
2018 STATE OF COLLEGE ADMISSION 5INTRODUCTION
two-year college. Among that same international students attending US secondary schools, given the
Fall 2011 cohort, more than half (59 postsecondary institutions in the integral role school counselors play
percent) of those who transferred United States. The report covers in putting students on the path to
from four-year institutions moved to the recruitment strategies that postsecondary success.
a community college.8 colleges use to attract each group of The report is divided into four
NACAC has also expanded prospective students and the process chapters: College Applications;
its focus to include support for by which candidates are evaluated. Recruitment and Yield Strategies;
professionals who work with The report also includes a chapter Factors in Admission Decisions; and
students from outside the US and dedicated to school counseling in Secondary School Counseling.
those who advise US students
interested in pursuing postsecondary
degrees abroad. The growth of
international student enrollment Methodology in Brief
at American high schools, colleges,
and universities, along with The information presented in the report primarily includes data
increased interest among American gathered through NACAC’s annual Counseling Trends Survey and
students in study abroad options, Admission Trends Survey.
is adding a global dynamic to the NACAC’s annual Counseling Trends Survey (CTS) collects
work of college counseling and information from secondary school counselors and counseling
admission professionals. In 2016, departments about their priorities and work responsibilities—
approximately 5 million students particularly as they relate to helping students transition to college,
enrolled in tertiary education outside and their practices in communicating with students, parents, and
their country of citizenship. In the colleges. The 2017–18 academic year CTS was distributed in May
2015-16 academic year, 325,339 US 2018 to 16,252 secondary school counseling offices. NACAC
students received academic credit for received 2,251 responses.
study abroad, a 4 percent increase NACAC administers its annual Admission Trends Survey (ATS)
over the previous year.9 to US four-year colleges that are NACAC members. NACAC
collects data related to application volume; application practices;
the use of various enrollment management strategies, including wait
State of College Admission lists, Early Decision, and Early Action; the importance of various
Report factors in the admission decision; and admission staffing. Since
The 2018 State of College Admission 2014, NACAC has expanded ATS to incorporate questions related
report provides up-to-date to the admission process for prospective transfer and international
information on a number of issues students. NACAC received 493 responses to the 2017–18 ATS.
that impact students’ transition (See Appendix A: Methodology for more detailed information about
from high school to postsecondary survey administration and data analysis.)
education, as well as the admission
process for transfer students and
______________________________________________________
8
Organization for Economic Co-Operation and Development (2018). Education at a Glance, 2018. Washington, DC: OECD.
9
Institute of International Education (IIE). (2017). Open Doors 2017.
6 NATIONAL ASSOCIATION FOR COLLEGE ADMISSION COUNSELING01
CHAPTER 1
COLLEGE APPLICATIONS
Each year, US colleges and at private institutions than publics According to the Higher
universities receive hundreds of for both first-time freshmen and Education Research Institute’s The
thousands of applications from transfer students.1 American Freshmen report series,
first-time domestic students, Although applications from 35 percent of first-time freshmen
transfer students, and international international students represented applied to seven or more colleges
students. Results of recent NACAC the smallest proportion of all during the Fall 2016 admission
Admission Trends Surveys indicate applications received, they increased cycle, after reaching a peak of 36
that the number of applications has by 8 percent from Fall 2016 to Fall percent in Fall 2015. Since Fall
continued to increase across four- 2017.2 Applications for each group 2013, more than 80 percent of
year colleges. of prospective students also had first-time freshmen have applied to
increased from Fall 2015 to Fall at least three colleges each year (see
Application Volume 2016, by 7 percent, 1 percent, and Figure 1).
Results of the 2017–18 10 percent, respectively.
Admission Trends Survey indicate
that the average number of
applications increased for each
group of prospective students
PERCENT CHANGE IN THE NUMBER OF APPLICATIONS
between the Fall 2016 and Fall BETWEEN FALL 2016 AND FALL 2017
2017 admission cycles.
Applications from first-time
freshmen increased by 4 percent,
on average, and applications from
prospective transfer students
increased by 3 percent. The percent Transfer First-time freshmen International
increase in applications was greater
3% 4% 8%
______________________________________________________
1
Independent t-tests indicated there were significant differences in percent change in applicants and control for both freshman (t (454) =
.466, p < .01); and transfer students (t (321) = 1.1, p < .01).
2
International percent change responses trimmed 5 percent due to extreme outliers.
2018 STATE OF COLLEGE ADMISSION 7CHAPTER 1
Application volume increases increases with both applicant institutions range from acceptance
have created a growing burden selectivity rates and enrollment size rates of fewer than 10 percent to
on admission office staff who (see Table 1). more than 90 percent of applicants.
evaluate prospective students for Acceptance and Yield Rates An institution’s yield rate is defined
admission. According to Admission The acceptance rate for a college as the percentage of admitted
Trends Survey results, the average or university is defined as the students who ultimately enroll at
number of applications for each percentage of applicants who are the institution, after considering
admission office staff member offered admission. Institutions other admission offers. Although
(excluding administrative staff) for with lower acceptance rates are yield rates may have little relevance
the Fall 2017 admission cycle was considered more highly selective, to prospective students, accurately
791 for public institutions and meaning a smaller number of predicting yield is critical to
426 for privates. The number of applicants are admitted. The colleges looking to avoid either
applications per admission officer selectivity of US postsecondary over- or under-enrollment.
First-Time Freshmen
FIGURE 1. INCREASES IN FIRST-TIME FRESHMEN According to the most recent data
collected by the US Department
APPLICATION SUBMISSION: 1995 TO 2016
of Education, the national average
acceptance rate for first-time
freshmen across all four-year
institutions in the US was 65.4
percent, after increasing steadily
from a low of 63.9 percent in
Fall 2012 to 66.1 percent in
Fall 2015. For Fall 2016, the
average acceptance rate at private
institutions was about 6 percentage
points lower than the average rate
at public institutions (63.5 percent
versus 69.1 percent).
The most selective four-year
colleges—defined as those accepting
less than half of all applicants—
received 36 percent of all Fall 2016
applications but enrolled only 21
percent of first-time undergraduate
students. Nearly two-thirds of
first-time, full-time freshmen
(68 percent) were enrolled in
institutions with selectivity rates
between 50 percent and 85 percent
(see Table 2).
For the Fall 2016 freshman
SOURCE: Eagan, K., Stolzenberg, E.B., Zimmerman, H.B., Aragon, M.C., Sayson, H.W., &
class, the average yield rate among
Rios-Aguilar, Rios. (2017). The American Freshman: National Norms Fall 2016. Los Angeles: four-year colleges and universities
Higher Education Research Institute at UCLA. was 33.6 percent, down from 35.1
Eagan, M. K., Stolzenberg, E.B., Ramirez, J.J., Aragon, M.C., Suchard, M.R., and Rios- percent in Fall 2015 and 36.2
Aguilar. (2016) The American freshman: Fifty-Year trend, 1996-2015. Los Angeles: Higher percent in Fall 2014.
Education Research Institute, UCLA.
8 NATIONAL ASSOCIATION FOR COLLEGE ADMISSION COUNSELINGCHAPTER 1
population (62 percent compared
TABLE 1. APPLICATIONS PER ADMISSION OFFICER, to 65 percent). However, the yield
FALL 2017 for accepted transfer students was
N Mean much higher (54 percent compared
to 28 percent).
Control
A similar analysis of institutions
Public 53 791 that accept international students
Private 100 426 showed that first-time international
Enrollment students are accepted at a lower
rate (52 percent) than both transfer
Fewer than 3,000 students 77 296 students and first-time freshmen.
3,000 to 9,999 43 670 The yield rate for international
10,000 or more 30 1,016 students was 30 percent, indicating
they were only slightly more likely
Selectivity
to enroll than accepted first-time
Accept fewer than 50 percent of applicants 25 915 freshmen applicants (see Table 3).
50 to 70 percent 64 534
71 to 85 percent 51 429 Application Fees
More than 85 percent 12 435 Results of the Admission Trends
Survey indicate that 74 percent of
NOTE: Admission counselors and mid/senior level admission officials were included in the analyses. four-year, not-for-profit colleges
NOTE: Independent t-tests and one-way ANOVAs indicated there were significant differences in had an application fee for the
the application to admission officer ratio by: control (t (151) = 4.9, p < .001); enrollment (F (2, Fall 2017 admission cycle, which
147) = 51.6, p < .001), and acceptance rate (F (3, 148) = 7.3, p < .001). averaged $49. Public colleges
Pearson correlation applications per admission officer and: enrollment .588, p < .01; acceptance were more likely to report having
rate -.313, p < .01. What about control t-test?
an application fee than privates
SOURCE: NACAC Admission Trends Survey, 2017–18. (94 percent versus 62 percent),
but no difference was found in
Transfer and International accept transfer students, the the average fee amount.3 Larger
Students average acceptance rate for transfer enrollment sizes and lower
Among 2017–18 Admission applicants was slightly lower selectivity rates were associated
Trends Survey respondents that than for the first-time freshmen with higher average fees.4
THE AVERAGE ACCEPTANCE RATE FOR FIRST-TIME FRESHMEN
Fall 2013 Fall 2014 Fall 2015 Fall 2016
64.7% 65.8% 66.1% 65.4%
______________________________________________________
3
Chi-squared test control and application fee (X2 (1) = 47.6 p < .001; phi = .351 p < .001.
4
Pearson correlations for application fee amount and: enrollment (.218), acceptance rate (-.433), p < .01.
2018 STATE OF COLLEGE ADMISSION 9CHAPTER 1
TABLE 2. APPLICATIONS AND ENROLLMENT, BY SELECTIVITY: FALL 2016
Average National share of
National number of National full-time, first-time
share of applications share of degree seeking
Selectivity institutions per institution applications undergraduates
Accept fewer than 50 percent of applicants 19.5% 11,969 36.0% 20.9%
50 to 70 percent 36.6 5,936 33.4 35.6
71 to 85 percent 27.7 5,648 24.1 32.0
More than 85 percent 16.2 2,635 6.6 11.5
N = 1,596
SOURCE: US Department of Education, National Center for Education Statistics. (2016–17). Integrated Postsecondary Education Data System
(IPEDS) Data Center. Washington, DC: NCES. [Includes Title-IV participating, four-year public and private not-for-profit, degree-granting
(primarily baccalaureate) institutions in the US that enroll first-time freshman and are not open admission.]
10 NATIONAL ASSOCIATION FOR COLLEGE ADMISSION COUNSELINGCHAPTER 1
TABLE 3. KEY STATISTICS FOR TRANSFER AND INTERNATIONAL STUDENT ADMISSION:
FALL 2017
Transfer N Mean
Transfer Selectivity Rate 364 61.7%
Overall Freshman Selectivity Rate for Institutions with Transfer Students 353 64.7%
Transfer Yield Rate 363 53.5%
Overall Yield Rate for Institutions with Transfer Students 331 27.7%
International N Mean
International Selectivity Rate 263 51.7%
Overall Freshman Selectivity Rate for Institutions with International Students 341 64.5%
International Yield Rate 263 30.4%
Overall Yield Rate for Institutions with International Students 321 27.8%
SOURCE: NACAC Admission Trends Survey, 2017–18.
2018 STATE OF COLLEGE ADMISSION 1102
CHAPTER 2
RECRUITMENT AND YIELD
STRATEGIES
Recruitment Strategies by half of colleges (57 percent) also (A complete breakdown of how
Prospective Student Group rated campus visits as considerably colleges rated various recruitment
Results of NACAC’s 2017–18 important in recruiting transfer strategies by population can be found
Admission Trends Survey indicate students (see Table 4). A variety in Appendix Tables B.1 to B.3.)
that many of the recruitment of other strategies were used with
methods used for traditional both transfer and international Early Decision
domestic high school students are recruitment, but only email and Twenty-one percent of respondents
also useful with other populations. website were rated very highly as to NACAC’s 2017–18 Admission
For example, contacting students recruitment tools. Trends Survey offered Early
through email and engaging with Survey respondents reported Decision (ED). Private colleges
them through the institution’s that they actively recruited in were more likely than public
website were the most important nine countries, on average. For institutions to offer Early Decision
recruitment strategies that colleges the purpose of the survey, “active policies (30 percent compared to 6
and universities use for first-time recruitment” was defined as percent), as were selective colleges.2
freshmen, transfer students, and engaging in recruitment activities More than half (52 percent) of
international students. For high that involve either maintaining an the most selective colleges (those
school students, an additional in-country office/staff presence or accepting fewer than 50 percent of
four factors were each rated as periodic staff travel to students’ applicants) had an Early Decision
considerably important by at home countries (e.g., attending application option. (See Appendix
least 50 percent of colleges. They education fairs, making high school C for a detailed description of Early
were: hosting campus visits, visits, or conducting site visits with Decision and Early Action policies.)
outreach to parents and high international student recruitment Early Decision applicants represent
school counselors, high school agents). The number of countries also only a small portion of the total
visits, and college fairs. More than increased with selectivity.1 applicant pool at colleges that have
______________________________________________________
1
Correlation (Pearson’s R) acceptance rate and number of countries (.317), p < .01.
2
Chi-squared test for Early Decision policy and: institution type (X2 (1) = 41.5, Phi = .293), p < .001; Correlation (Spearman’s Rho) for
Early Decision policy and acceptance rate (-.321), p < .001.
12 NATIONAL ASSOCIATION FOR COLLEGE ADMISSION COUNSELINGCHAPTER 2
TABLE 4. PERCENTAGE OF COLLEGES ATTRIBUTING “CONSIDERABLE IMPORTANCE” TO
VARIOUS RECRUITMENT STRATEGIES, BY PROSPECTIVE STUDENT POPULATION: 2017–18
First-Time International
Factor Transfer
Freshmen (First-Time Freshmen)
Email 87.5 79.4 84.1
Website 85.0 82.8 85.6
Hosted Campus Visit 81.3 56.8 29.5
Parents 64.4 25.7 42.0
High School Counselor 63.8 15.2 31.8
High School Visit (in the US) 58.8 12.8 8.6
College Fairs 49.7 24.0 18.2
Direct Mail 48.1 24.4 7.2
Social Media 44.4 30.6 33.6
Text Messaging 37.8 31.8 19.7
Online Advertising 29.1 23.5 16.2
Community Based Organizations 20.1 8.7 7.9
Test-Optional Policy 18.2 5.0 9.4
Alumni 14.5 10.3 11.2
High School Visit (Outside the US) 9.8 2.9 26.7
Community College Outreach/Partnerships 9.7 55.4 10.2
Conditional/Provisional Admission Program 7.9 6.2 8.5
Articulation Agreements with Community Colleges 7.6 50.6 8.1
International Student Recruitment Agents — — 15.1
Partnerships with International Colleges/Universities — — 19.5
State or Regional Recruitment Consortium — — 5.7
Federal Government Support — — 6.3
Foreign Government Support — — 12.1
Pathways Programs — — 12.1
—Question was only asked for international students.
SOURCE: NACAC Admission Trends Survey, 2017–18.
2018 STATE OF COLLEGE ADMISSION 13CHAPTER 2
52% 46%
OF SELECTIVE COLLEGES OF COLLEGES WITH LOW
OFFERED EARLY DECISION YIELD RATES OFFERED
EARLY ACTION
ED policies. Only 5 percent of than the average yield rate for all Fall 2015 and Fall 2016 (6 percent
applications for Fall 2017 admission students admitted to ED colleges and 6 percent, respectively).
to ED colleges were received through (26 percent) (see Table 5). Colleges
Early Decision. The proportion with lower total yield rates tended Early Action
of applications received through to admit a greater percentage of Thirty-six percent of four-year
ED increased with the admission their ED applicants compared to colleges offered Early Action
selectivity rate and yield rate.3 those with higher yield rates.4 More (EA)plans, according to results of
As expected, colleges with selective colleges tended to have the 2017–18 Admission Trends
Early Decision policies reported higher ED yield rates.5 Survey. Private colleges were
a higher acceptance rate for their Between Fall 2016 and Fall 2017, more likely than publics to have
ED applicants as compared to all colleges reported an average increase Early Action application options
applicants (62 percent versus 51 of 4 percent in the number of Early (40 percent compared to 28
percent). Given the binding nature of Decision applicants and 5 percent in percent, respectively). Colleges
Early Decision policies, the average ED admits. In a prior survey, colleges with lower yield rates also were
yield rate for Early Decision admits also had reported increases in ED more likely to offer Early Action.6
was 88 percent, substantially higher applications and ED admits between Forty-six percent of colleges with
TABLE 5. KEY STATISTICS FOR EARLY DECISION COLLEGES: FALL 2017
N Mean Percent
Applications Received through Early Decision 88 4.7
Early Decision Selectivity Rate 89 62.3
Overall Selectivity Rate for Institutions with Early Decision Policies 99 50.7
Early Decision Yield Rate 75 87.9
Overall Yield Rate for Institutions with Early Decision Policies 85 25.8
SOURCE: NACAC Admission Trends Survey, 2017–18.
______________________________________________________
3
Correlation (Pearson’s R) for percent of apps received through ED and: acceptance rate (.690); yield rate (.502), p < .01.
4
Correlation (Pearson’s R) for institutional yield rate and ED acceptance rate (-.447), p < .01.
5
Correlation (Pearson’s R) for institutional selectivity rate and ED yield (.392), p < .01.
6
Chi-squared test for Early Action policy and: institution type (X2 (1) = 6.8, Phi = .119), p < .01; Correlation (Spearman’s Rho) for
Early Action policy and institutional yield rate (.272), p < .001.
14 NATIONAL ASSOCIATION FOR COLLEGE ADMISSION COUNSELINGCHAPTER 2
yield rates lower than 30 percent and EA admits between Fall 2015
used Early Action. and Fall 2016 (15 percent and 16
For Fall 2017, 44 percent of percent, respectively).
applications to colleges that had
Early Action admission plans were Wait Lists
received through EA. Similar to the For the Fall 2017 admission THE MOST SELECTIVE
pattern with Early Decision, colleges cycle, 40 percent of institutions COLLEGES ADMITTED
with Early Action accepted a greater reported using a wait list. Private ONLY 14 PERCENT OF
proportion of EA applicants when institutions were more likely than
compared to the overall applicant WAITLISTED STUDENTS
public colleges and universities to
pool (74 percent versus 64 percent). maintain a wait list (43 percent
Unlike Early Decision, Early Action compared to 33 percent), as were Institutions admitted an average
did not provide a significant benefit those with lower acceptance rates.7 of 25 percent of all students who
to institutions in terms of yield rates. Seventy-five percent of the most chose to remain on wait lists.
The average yield rate for EA admits selective institutions (accepting Selective colleges were least likely
was nearly identical to that of the fewer than half of all applicants) to admit students from a wait list.9
overall applicant pool (22 percent maintained a wait list. Only 14 percent of students who
and 23 percent, respectively) (see Institutions reported placing an accepted a wait list spot at the most
Table 6). average of 10 percent of all applicants selective colleges (those accepting
From Fall 2016 to Fall 2017, the on the wait list for the Fall 2017 fewer than half of all applicants)
number of Early Action applications admission cycle, and an average of 50 were ultimately admitted. The
increased by 9 percent and the percent of waitlisted students opted average number of students offered
number of students accepted through to remain on the wait list. Colleges a position on a wait list increased
EA increased by 10 percent, on with lower acceptance rates placed by 12 percent between Fall 2016
average. Colleges also had reported a greater proportion of students on and Fall 2017 and by 16 percent
average increases in EA applications wait lists, on average.8 between Fall 2015 and Fall 2016.
TABLE 6. KEY STATISTICS FOR EARLY ACTION COLLEGES: FALL 2017
N Mean Percent
Applications Received through Early Action 91 43.2
Early Action Selectivity Rate 88 73.6
Overall Selectivity Rate for Institutions with Early Action Policies 161 64.1
Early Action Yield Rate 92 22.1
Overall Yield Rate for Institutions with Early Action Policies 155 23.2
SOURCE: NACAC Admission Trends Survey, 2017–18.
______________________________________________________
7
Chi-squared test for wait list policy and: institution type (X2 (1) = 5.1, Phi = .102), p < .05; Correlation (Spearman’s Rho) for wait
policy and institutional acceptance rate (-.344), p < .001.
8
Correlation (Pearson’s R) for institutional acceptance rate and percentage of applicants waitlisted (-.471), p < .01.
9
Correlation (Pearson’s R) for institutional acceptance rate and percentage admitted from wait list (.424), p < .01.
2018 STATE OF COLLEGE ADMISSION 1503
CHAPTER 3
FACTORS IN ADMISSION
DECISIONS
There is no definite plan or specific as enrollment size and acceptance They include essays or writing
combination of factors that will rate, also impact the importance of samples; teacher and counselor
guarantee a student admission admission factors. recommendations; student’s
to their preferred institution. demonstrated interest; class rank;
Colleges and universities review Factors in the Admission and extracurricular activities.
many aspects of prospective student Decision: First-Time
applications in order to determine Freshmen, 2017 (see Table 7) • A final group of admission
which students will be admitted. In • Grades in high school have been decision factors were given, on
addition to considering the merits among the top decision factors average, moderate or considerable
of each applicant, most universities for first-time freshmen for importance by a small percentage
also consider the composition decades. Eighty-one percent of of institutions, likely because
of the entering freshmen and colleges rated grades in all courses they are relevant only to a small
transfer classes as a whole, in as considerably important, and subset of colleges. These factors
order to ensure that a diverse 71 percent rated grades in college included subject test scores (AP,
group of students with a variety prep courses as considerably IB), portfolios, SAT II scores,
of academic and extracurricular important. Admission test scores interviews, state graduation exam
interests will enrich the campus and strength of curriculum were scores, and work experience.
experience. The importance of also rated considerably important
various factors in the admission Factors in the Admission
by more than half of colleges (52
decision also differ depending Decision: International
and 51 percent, respectively).
on a student’s designation as a Students, 2017 (see Table 8)
first-time freshman, transfer, or • A second set of factors were most • The top factors in admission
international student. While first- often considered to be moderately decisions for first-time
time freshmen and international important. These factors tend international students applying
students had similarities in to provide insight regarding to four-year US colleges were
regard to top admission factors, personal qualities and interest of similar to those of first-time
top factors for transfer students students, as well as more details domestic students, with the
were considerably different. regarding academic performance. important exception of English
Institutional characteristics, such proficiency exam scores.
16 NATIONAL ASSOCIATION FOR COLLEGE ADMISSION COUNSELINGCHAPTER 3
TABLE 7. PERCENTAGE OF COLLEGES ATTRIBUTING DIFFERENT LEVELS OF IMPORTANCE
TO FACTORS IN ADMISSION DECISIONS: FIRST-TIME FRESHMEN, FALL 2017
Considerable Moderate Limited No
Factor N Importance Importance Importance Importance
Grades in All Courses 173 80.9 10.4 5.8 2.9
Grades in College Prep Courses 171 70.8 17.5 8.8 2.9
Admission Test Scores (SAT, ACT) 172 52.3 30.8 14.5 2.3
Strength of Curriculum 170 51.2 29.4 12.9 6.5
Essay or Writing Sample 168 16.7 36.9 20.8 25.6
Counselor Recommendation 167 10.8 46.1 28.7 14.4
Student’s Demonstrated Interest 168 15.5 21.4 34.5 28.6
Teacher Recommendation 168 7.1 46.4 29.2 17.3
Class Rank 172 9.3 27.9 36.0 26.7
Extracurricular Activities 169 3.6 34.9 40.8 20.7
Subject Test Scores (AP, IB) 166 4.2 28.9 28.3 38.6
Portfolio 167 5.4 7.2 27.5 59.9
Interview 168 3.6 14.3 29.2 53.0
Work 169 1.8 17.8 41.4 39.1
SAT II Scores 166 6.6 3.0 19.9 70.5
State Graduation Exam Scores 168 1.8 8.3 17.9 72.0
SOURCE: NACAC Admission Trends Survey, 2017–18.
Eighty percent of colleges Factors in the Admission ability to succeed in college-level
rated these proficiency scores Decision: Transfer Students, academic coursework.
as considerably important, 2017 (see Table 9)
followed by grades in all courses • For transfer students, many
(76 percent), grades in college • The factors considered in transfer factors related to high school
prep courses (67 percent), admission decisions are notably performance fall to the level of
and strength of curriculum different than those for first- moderate to limited importance,
(48 percent). time domestic and international including grades, strength of
students. The only two factors the high school curriculum, and
• A national school leaving or that are rated as considerably recommendations from teachers
graduation certificate was also an important by a majority of and counselors.
important factor for international colleges were overall GPA at prior
students, rated as considerably postsecondary institutions (83 • In contrast to first-time
important by 35 percent of percent) and average grades in prospective students, 74 percent
institutions and as moderately transferable courses (72 percent). of colleges rated admission test
important by an additional Unlike other prospective student scores (SAT, ACT) as having
28 percent. populations, these factors serve limited or no importance in
as direct evidence of a student’s transfer admission decisions.
2018 STATE OF COLLEGE ADMISSION 17CHAPTER 3
TABLE 8. PERCENTAGE OF COLLEGES ATTRIBUTING DIFFERENT LEVELS OF IMPORTANCE
TO FACTORS IN ADMISSION DECISIONS: INTERNATIONAL STUDENTS (FIRST-TIME
FRESHMEN), FALL 2017
Considerable Moderate Limited No
Factor N Importance Importance Importance Importance
English proficiency exam scores 162 80.2 14.8 1.9 3.1
Grades in All Courses 166 75.9 13.9 7.2 3.0
Grades in College Prep Courses 165 67.3 18.2 9.7 4.8
Strength of Curriculum 164 48.2 28.7 13.4 9.8
Admission Test Scores (SAT, ACT) 165 39.4 31.5 21.8 7.3
National school-leaving certificate (non 151 35.1 27.8 14.6 22.5
U.S.)
Essay or Writing Sample 162 20.4 39.5 17.3 22.8
Counselor Recommendation 161 12.4 41.0 28.0 18.6
Student’s Demonstrated Interest 161 16.8 23.0 31.7 28.6
Teacher Recommendation 162 10.5 43.8 25.3 20.4
Class Rank 165 9.7 17.6 32.1 40.6
Extracurricular Activities 163 1.8 31.3 42.3 24.5
Subject Test Scores (AP, IB) 159 7.5 22.6 28.9 40.9
Portfolio 161 5.0 6.8 31.1 57.1
Interview 161 2.5 18.0 31.1 48.4
Work 162 1.2 13.6 38.3 46.9
SAT II Scores 160 6.3 2.5 20.6 70.6
State Graduation Exam Scores 159 4.4 6.9 12.6 76.1
SOURCE: NACAC Admission Trends Survey, 2017–18.
Factors in Admission rank, interviews, and the essay/ courses as considerably important
Decisions for First-Time writing sample (see Table 10). has increased from 60 percent to
Freshmen: Change Over Time While academic performance 81 percent. During the same time
Because NACAC only recently has remained the most important frame, grades in college prep courses
began to collect annual data from consideration for colleges, in decreased from 77 percent to 71
transfer and international students, recent years, specific changes percent, and strength of curriculum
change in admission factor in the top factors have become from 60 percent to 51 percent.
importance over time is limited to evident. For many years, grades This recent change in the relative
first-time freshmen. The relative in college prep courses had been order of overall GPA, grades in
importance of many admission rated as the top factor in admission college prep courses, and strength of
decision factors have remained decisions, followed by strength curriculum could be due to increases
remarkably stable over the long of curriculum and grades in all in the proportion of students who
term. Notable exceptions include courses (overall GPA). However, take college prep courses, such as AP
the declining importance of class from 2014 to 2017, the percentage
of colleges rating grades in all
18 NATIONAL ASSOCIATION FOR COLLEGE ADMISSION COUNSELINGCHAPTER 3
TABLE 9. PERCENTAGE OF COLLEGES ATTRIBUTING DIFFERENT LEVELS OF IMPORTANCE
TO FACTORS IN ADMISSION DECISIONS: TRANSFER STUDENTS, FALL 2017
Considerable Moderate Limited No
Factor N Importance Importance Importance Importance
Overall GPA at prior institution 166 82.5 13.3 3.0 1.2
Average of grades in transferable courses 164 72.0 17.7 4.9 5.5
Grades in All Courses 167 16.2 29.3 38.9 15.6
Grades in College Prep Courses 168 11.9 29.2 41.7 17.3
Admission Test Scores (SAT, ACT) 167 9.6 16.8 44.9 28.7
Strength of Curriculum 166 12.0 23.5 40.4 24.1
Essay or Writing Sample 164 10.4 31.1 24.4 34.1
Counselor Recommendation 163 5.5 22.1 35.0 37.4
Student’s Demonstrated Interest 165 13.3 23.0 32.1 31.5
Teacher Recommendation 164 4.9 30.5 31.7 32.9
Class Rank 167 3.0 9.6 29.3 58.1
Extracurricular Activities 165 1.2 24.8 40.0 33.9
Subject Test Scores (AP, IB) 162 — 13.6 34.0 52.5
Portfolio 163 4.9 6.1 25.2 63.8
Interview 164 2.4 11.6 31.1 54.9
Work 165 1.8 15.8 39.4 43.0
SAT II Scores 162 1.9 2.5 15.4 80.2
State Graduation Exam Scores 163 — 3.1 16.0 81.0
Articulation with prior postsecondary 163 20.9 32.5 19.6 27.0
institutions
Quality of prior postsecondary institution 164 13.4 28.7 31.7 26.2
English proficiency exam scores 150 6.0 16.7 12.7 64.7
National school-leaving certificate (non US) 143 4.2 6.3 8.4 81.1
SOURCE: NACAC Admission Trends Survey, 2017–18.
and dual enrollment. In analyzing Factors in Admission by results presented below are limited
this data, however, it is important Institutional Characteristics to admission factors for prospective
to focus on the long-term trends for for First-Time Freshmen, first-time freshmen. Lack of variation
each factor rather than any year- Transfer, and International for transfer and international
to-year changes, as such differences Students, 2017 admission factor ratings prohibited
may be due to variations in the This section highlights differences analysis for these groups.
annual survey samples. Additional in the level of importance attributed The top four admission decision
years of data will be needed to to admission factors based on factors for first-time freshmen
determine if this change becomes a institutional characteristics. The are consistent across all types of
longer-term trend. institutions. However, institutional
2018 STATE OF COLLEGE ADMISSION 19CHAPTER 3
TABLE 10. PERCENTAGE OF COLLEGES ATTRIBUTING “CONSIDERABLE IMPORTANCE” TO
FACTORS IN ADMISSION DECISIONS: FIRST-TIME FRESHMEN, FALL 2007 TO FALL 2017
2007 2008 2009 2010 2011 2012 2013 2014 2015 2016 2017
Grades in College 80% 75% 87% 83% 84% 82% 82% 79% — 77% 71%
Prep Courses
Grades in All 52 52 46 46 52 50 52 60 — 77 81
Courses
Strength of 64 62 71 66 68 65 64 60 — 52 51
Curriculum
Admission Test 59 54 58 59 59 56 58 56 — 54 52
Scores
Essay or Writing 26 27 26 27 25 20 22 22 — 19 17
Sample
Class Rank 23 19 16 22 19 13 15 14 — 9 9
Counselor 21 20 17 19 19 16 16 17 — 15 11
Recommendation
Demonstrated 22 21 21 23 21 18 20 17 — 14 16
Interest
Teacher 21 21 17 19 17 15 14 15 — 11 7
Recommendation
Interview 11 11 7 9 6 7 8 4 — 5 4
Extracurricular 7 7 9 7 5 7 10 6 — 8 4
Activities
Work 2 2 2 2 2 1 3 1 — 3 2
Subject Test Scores 7 8 7 10 7 5 8 7 — 7 4
(AP, IB)
State Graduation 4 4 3 4 4 2 3 4 — 2 2
Exams
SAT II Scores 6 7 5 5 5 4 6 5 — 2 7
Portfolio — 7 8 6 7 5 6 7 — 6 5
—Data are not available.
SOURCE: NACAC Admission Trends Surveys, 2007-08 through 2017–18.
characteristics determined the on the essay/writing sample, the scores more highly than private
relative level of importance assigned interview, counselor and teacher/ institutions.
to some admission factors. professor recommendations,
deomonstrated interest, and • For transfer applicants, public
Institutional Control extracurricular activities. colleges attributed more
• For each prospective student importance to the quality of prior
population, private colleges • For first-time freshmen, public postsecondary institution(s).
placed relatively more importance colleges valued admission test
20 NATIONAL ASSOCIATION FOR COLLEGE ADMISSION COUNSELINGCHAPTER 3
TABLE 11. PERCENTAGE OF COLLEGES ATTRIBUTING DIFFERENT LEVELS OF INFLUENCE
TO STUDENT CHARACTERISTICS IN ADMISSION DECISIONS: FALL 2017
Considerable Moderate Limited No
N
Influence Influence Influence Influence
FIRST-TIME FRESHMEN
High School Attended 166 3.6 18.1 36.7 41.6
Race/Ethnicity 169 2.4 13.0 20.7 63.9
State or County of Residence 165 1.2 7.9 23.6 67.3
First-generation Status 167 4.2 12.6 32.3 50.9
Ability to Pay 168 1.2 4.2 13.7 81.0
Gender 168 1.8 3.0 17.9 77.4
Alumni Relations 168 1.2 11.3 38.1 49.4
TRANSFER STUDENTS
High School Attended 162 2.5 6.8 27.8 63.0
Race/Ethnicity 164 1.2 11.0 20.7 67.1
State or County of Residence 161 1.9 5.6 20.5 72.0
First-generation Status 162 3.1 10.5 30.2 56.2
Ability to Pay 164 1.8 4.9 12.8 80.5
Gender 164 1.8 2.4 14.6 81.1
Alumni Relations 164 1.2 11.6 36.0 51.2
INTERNATIONAL STUDENTS (FIRST-TIME FRESHMEN)
High School Attended 161 4.3 17.4 31.7 46.6
Race/Ethnicity 163 1.2 8.0 17.2 73.6
State or County of Residence 161 1.9 11.2 24.8 62.1
First-generation Status 161 3.1 9.3 28.0 59.6
Ability to Pay 163 20.2 16.6 9.8 53.4
Gender 163 1.8 2.5 16.0 79.8
Alumni Relations 163 1.8 12.3 36.8 49.1
SOURCE: NACAC Admission Trends Survey, 2017–18.
2018 STATE OF COLLEGE ADMISSION 21CHAPTER 3
Enrollment Student Characteristics Institutional Control
as Contextual Factors
• Smaller colleges rated the in Admission Decisions • Private institutions gave more
interview, teacher/professor for First-Time Freshmen, weight to race/ethnicity, gender,
recommendations, and Transfer, and International high school attended, and alumni
demonstrated interest more Students, 2017 relations when evaluating the
highly for each applicant group. Colleges were asked to rate the applications of each student group.
influence of certain student
• For both domestic and characteristics—race/ethnicity, • Private colleges gave greater
international first-time freshmen first-generation status, high school consideration to ability to pay
applicants, smaller colleges gave attended, state or county of when evaluating first-time
more weight to total high school residence, gender, alumni relations, freshmen and transfer students.
GPA and work in comparison to and ability to pay—in terms of how Enrollment
their larger counterparts. they affect evaluation of the main
admission factors. Although, for • For all three prospective student
• Grades in college prep courses the most part, college admission groups, alumni relations was
and counselor recommendations officers give very little importance to rated as having more influence
were rated more highly by smaller these characteristics, there are some in admission decisions for
colleges only for domestic first- findings worth noting (see Table 11). smaller colleges. For both first-
time freshmen applicants. For example, 22 percent of colleges time freshmen and transfer
rated the high school attended as at students, ability to pay was more
Selectivity
least moderately important in first- influencial at smaller colleges.
• When evaluating applications time freshmen admission decisions.
from each student group, Alumni relations was attributed some • Larger colleges gave more
institutions that were more (at least limited) level of influence by weight to state, county, or
selective placed more emphasis 51 percent of colleges in admission country of residence for all
on the essay, interview, and decisions for both domestic and three applicant groups.
extracurricular activities. international first-time freshmen, and Selectivity
by 49 percent of colleges for transfer
• For both domestic and admission decisions. For international • When evaluating applications
international first-time freshmen students, ability to pay was rated as a from each student group,
applicants, more selective colleges considerable influence at 20 percent of institutions that were more
rated strength of curriculum and colleges, compared to only 1 percent selective placed more emphasis
recommendations from counselors for domestic freshmen and 2 percent on race/ethnicity, gender, first-
and teachers more highly. for transfer students. generation status, state/county/
Interesting differences also were country of residence, and high
• Grades in college prep courses found in the relative importance school attended.
and counselor recommendations given to these factors based on
were given more weight by institution type. Data provided • For transfer students, ability to
selective colleges for domestic on the NACAC 2017–18 pay was given more consideration
first-time freshmen only. Admission Trends Survey allowed by institutions with a more
for comparison by institutional selective admission process.
(See Appendix Table B.4. – B.6. for
a correlation matrix of statistically characteristics for each prospective (See Appendix Tables B.7. – B.9.
significant associations.) student group—first-time for complete correlation matrices of
freshmen, transfer students, and statistically significant associations.)
international students.
22 NATIONAL ASSOCIATION FOR COLLEGE ADMISSION COUNSELING04
CHAPTER 4
SCHOOL COUNSELORS:
ACADEMIC AND
COLLEGE COUNSELING
School counselors play a key role states—New Hampshire and
Introduction in assisting students through Vermont—had ratios below
Using data from NACAC’s 2017– the transition to postsecondary the 250-to-1 maximum ratio
18 Counseling Trends Survey, education. By collaborating with recommended by the American
this chapter explores student- school administrators, teachers, School Counselor Association.3
to-counselor ratios and college community representatives, The states with the highest number
counseling activities. government officials, and parents, of students per counselor included
NACAC’s Statement on Precollege school counselors can be significant Arizona (902), Michigan (744),
Guidance and Counseling and assets throughout the college California (708), Minnesota (694),
the Role of the School Counselor application and admission process. and Illinois (676).
defines precollege counseling (A list of average public school
as generally including activities Student-to-Counselor Ratios student-to-counselor ratios for
that help students: 1) pursue the According to the US Department all 50 states plus the District
most challenging curriculum of Education, in 2015-16 each of Columbia can be found in
that results in enhanced public school counselor (including Appendix Table B.10.)
postsecondary educational options; pre-kindergarten, elementary, Results of NACAC’s 2017–18
2) identify and satisfy attendant and secondary counselors) Counseling Trends Survey indicated
requirements for college access; was responsible for overseeing the average student-to-counselor
and 3) navigate the maze of 470 students, on average.2 US ratio for public secondary schools
financial aid, college choice, and Department of Education data (ending in grade 12), taking into
other processes related to college show that student-to-counselor account part-time staff, was
application and admission.1 ratios vary widely. Only two 268-to-1.
______________________________________________________
1
National Association for College Admission Counseling. (1990). Statement on Precollege Guidance and the Role of the School
Counselor. Available at: https://www.nacacnet.org/globalassets/documents/advocacy-and-ethics/statement-of-principles-of-good-
practice/roleofschlcounsnew.pdf.
2
US Department of Education. (2016). Common Core of Data State Nonfiscal Survey Public Elementary/Secondary Education: School Year,
2015–16 Version 1a. Washington, DC: NCES.
3
American School Counselor Association. (2016). The role of the school counselor. Alexandria, VA: ASCA.
2018 STATE OF COLLEGE ADMISSION 23CHAPTER 4
Data regarding the extent to
which college advising is part of STATES WITH HIGHEST AND LOWEST RATIOS
counselors’ job responsibilities
showed the average student-to- Vermont
college counselor ratio was
297-to-1.4
Illinois 195
Public institutions assigned 676
substantially more students to
each counselor. There also were
significant differences in the
student-to-counselor and student-
to-college counselor ratios by New
enrollment size (see Table 12). Hampshire
Notably, 75 percent of private,
non-parochial schools reported
217
California
that they employed at least one
counselor (full- or part-time)
whose sole responsibility was to
708
Arizona
provide college counseling for Minnesota Michigan
students, compared to 58 percent
of private, parochial schools, and
902 694 744
only 33 percent of public schools.
Schools with higher proportions
of students eligible for free- and
reduced-price lunch and those
with higher student-to-counselor
ratios also were less likely to have a
dedicated college counselor.5
• Personal needs counseling characteristics. For example, the
Staff Time for College (22 percent) counseling staff at private, non-
Counseling parochial schools spent an average of
• Academic testing (12 percent)
Postsecondary admission counseling 54 percent of their time on college
is one of many functions of school • Occupational counseling and job counseling, compared to 39 percent
counselors. On average, the time placement (6 percent) at private, parochial schools, and
that counselors in secondary schools only 21 percent at public schools.
• Teaching (6 percent)
spend on various tasks breaks down Counselors at schools with more
in the following way: • Other non-guidance activities students eligible for free- and
(5 percent) reduced-price lunch spent less
• Postsecondary admission
time on postsecondary admission
counseling (30 percent)
However, the division of counseling, as did those with larger
• Choice and scheduling of high time among these tasks differs enrollments and higher student-to-
school courses (20 percent) significantly based on school counselor ratios (see Table 13).
______________________________________________________
4
The student-to-college counselor ratio is based on both the total number of counselors who exclusively provide college counseling for
students and the total number who provide college counseling among other services for students. As such, it overestimates the focus on
college counseling. Both full-time and part-time counselors were included in this calculation.
5
T\Chi-squared test for exclusive college counselor and: institution type (X2 (2) = 223.5, V = .343), p < .001; Correlation (Spearman’s
Rho) for exclusive college counselor and: percent eligible for FRPL (.174), students per counselor (.398), p < .01.
24 NATIONAL ASSOCIATION FOR COLLEGE ADMISSION COUNSELINGYou can also read