Performance of Micro-Scale Transmission & Reception Diversity Schemes in High Throughput Satellite Communication Networks
←
→
Page content transcription
If your browser does not render page correctly, please read the page content below
electronics
Article
Performance of Micro-Scale Transmission & Reception Diversity
Schemes in High Throughput Satellite Communication Networks
Apostolos Z. Papafragkakis                 , Charilaos I. Kouroriorgas          and Athanasios D. Panagopoulos *

                                          Radio and Satellite Communications Group, Division of Information Transmission Systems and Materials
                                          Technology, School of Electrical and Computer Engineering, National Technical University of Athens, Iroon
                                          Polytechniou 9, GR-157 80 Athens, Greece; apapafrag@mail.ntua.gr (A.Z.P.); harkour@mail.ntua.gr (C.I.K.)
                                          * Correspondence: thpanag@ece.ntua.gr; Tel.: +30-2107723842

                                          Abstract: The use of Ka and Q/V bands could be a promising solution in order to accommodate
                                          higher data rate, interactive services; however, at these frequency bands signal attenuation due to the
                                          various atmospheric phenomena and more particularly due to rain could constitute a serious limiting
                                          factor in system performance and availability. To alleviate this possible barrier, short- and large-scale
                                          diversity schemes have been proposed and examined in the past; in this paper a micro-scale site
                                          diversity system is evaluated in terms of capacity gain using rain attenuation time series generated
                                          using the Synthetic Storm Technique (SST). Input to the SST was 4 years of experimental rainfall
                                          data from two stations with a separation distance of 386 m at the National Technical University of
                                          Athens (NTUA) campus in Athens, Greece. Additionally, a novel multi-dimensional synthesizer
                                          based on Gaussian Copulas parameterized for the case of multiple-site micro-scale diversity systems
                                is presented and evaluated. In all examined scenarios a significant capacity gain can be observed,

                                          thus proving that micro-scale site diversity systems could be a viable choice for enterprise users to
Citation: Papafragkakis, A.Z.;            increase the achievable data rates and improve the availability of their links.
Kouroriorgas, C.I.; Panagopoulos,
A.D. Performance of Micro-Scale           Keywords: micro-scale site diversity; MIMO; SIMO; MISO; satellite; rain rate; attenuation; Synthetic
Transmission & Reception Diversity        Storm Technique; Gaussian copulas; outage capacity
Schemes in High Throughput
Satellite Communication Networks.
Electronics 2021, 10, 2073. https://
doi.org/10.3390/electronics10172073
                                          1. Introduction
Academic Editor: Mauro Tropea                   The use of high data rate satellite services has recently become a necessity given the
                                          vast number of new or planned applications which will be in high demand in the upcoming
Received: 30 July 2021                    5G era [1,2]. Satellite communication will play an important role in the 5G vision [3,4] by
Accepted: 23 August 2021                  either providing back-hauling services or offering internet services in under-served areas;
Published: 27 August 2021                 satellite back-haul not only allows for connectivity extension at remote locations but also
                                          serves as the prime solution for use cases such as emergency response, network backup
Publisher’s Note: MDPI stays neutral      and Internet of Things (IoT) applications.
with regard to jurisdictional claims in         In order to increase the provided data rates in an efficient, cost-effective manner and
published maps and institutional affil-   taking into consideration the spectrum scarcity problem [5,6], next generation satellite
iations.                                  communication systems are migrating to the Ka and Q/V bands and are expected to make
                                          extensive use of link adaptation strategies combined with multi-beam satellites and/or
                                          other relevant techniques [7–14]. Signal propagation at Ka-band frequencies and above
                                          is, nevertheless, highly affected by the various atmospheric phenomena causing degrada-
Copyright: © 2021 by the authors.         tion of the overall system performance. In particular, precipitation, clouds, atmospheric
Licensee MDPI, Basel, Switzerland.        gases and turbulence can introduce significant losses into the system, with rain being the
This article is an open access article    dominant fading mechanism [15,16]. In order to compensate for rain attenuation, Fading
distributed under the terms and           Mitigation Techniques are required (FMTs) [17]. FMTs include link adaptation techniques
conditions of the Creative Commons        such as uplink power control and Adaptive Coding and Modulation (ACM) schemes.
Attribution (CC BY) license (https://     However, the most effective FMT is the use of spatial diversity, e.g., site diversity, since
creativecommons.org/licenses/by/          such a technique exploits the spatial variability of the precipitation medium.
4.0/).

Electronics 2021, 10, 2073. https://doi.org/10.3390/electronics10172073                                   https://www.mdpi.com/journal/electronics
Electronics 2021, 10, 2073 2 of 16
In site diversity scenarios, one or more ground stations communicate with the same
satellite and therefore, the probability that all of the links simultaneously experience
severe attenuation is smaller than having a single station. In general, the gain of a site
diversity system increases with increasing the distance between the stations. Nonetheless,
a considerable gain can be observed even when the distance between the stations is
appreciably small, such as in [18–21]. Such systems can be employed in enterprise scenarios
such as (but not limited to) company headquarters, sports events, concerts or media events.
In such cases, the stations can be deployed around the company buildings, a stadium, or a
concert hall forming a micro-scale site diversity scheme. In cases where multiple stations
are used, Multiple Input Multiple Output (MIMO) techniques could also be employed to
improve the system’s performance even further. Regarding the use of MIMO techniques
in satellite communications, selection diversity is mostly preferred and implemented,
however, by exploiting the knowledge of the channel conditions, the system performance
can be further enhanced [22].
In the context of satellite communications, due to the use of massive, very costly
Gateways (GWs) used for data forwarding, it is more likely to have multiple stations
at the user premises than at the GW sites [23–25]; therefore, at frequency bands such as
Ka-band and above, the use of Multiple Input Single Output (MISO) and Single Input
Multiple Output (SIMO) techniques with multiple antenna configurations used at the
user terminals seem a potential solution to mitigate the various non-desirable propagation
effects. In a MISO system the uplink can be enhanced, while in a SIMO system the downlink,
respectively. Multi-path effects at such high frequencies are insignificant and thus, in order
to exploit the MIMO principle the benefits arising from the spatial inhomogeneity of the
rainfall are more relevant. According to [22], system capacity can be increased for both
SIMO and MISO cases provided that perfect knowledge of the channel state is available at
the receiver and transmitter, respectively. The Channel State Information (CSI) from the
user terminals can be extracted either through beacon signals and/or radiometers [26,27],
or by exploiting the pilot symbols used in the transmitted frames [28,29].
Prior to designing a communication system with built-in FMTs, multi-dimensional rain
attenuation time series synthesizers are essential in order to capture the spatio-temporal
characteristics of the propagation effects due to rain. In [30], a multi-dimensional time series
synthesizer based on stochastic differential equations has been presented, while in [31]
a filter-based method. Both models are based on the main assumptions of the Masseng-
Bakken model [32], i.e., that rain attenuation follows the log-normal distribution and the
Gaussian underlined process has an exponentially decreasing auto-correlation function;
both models use the Pearson’s correlation coefficient to model the spatial correlation. In [33],
another model is presented in which the Numerical Weather Prediction (NWP) analysis
products are used; starting from rain rate, rain attenuation time series are generated in
maps and therefore correlation is induced. Nevertheless, in the latter methodology data
resolution is small rendering it inappropriate for use in micro-scale systems. In [34], a new
approach for modeling joint statistics of rain attenuation in site-diversity systems based on
Gaussian copula functions [35] has been presented, while in [36], the same copula functions
are used to model the joint temporal statistics of rain attenuation through the generation
of rain attenuation time series for single links. The advantages of using copula functions
are: (a) there is no need to model the single-link rain attenuation statistics with a particular
distribution and (b) rain attenuation between multiple links is not assumed to be linearly
correlated in order to model their spatial dependence.
In this paper, the use of a micro-scale site diversity scheme for increasing the system
capacity is investigated. Taking advantage of four years of available rainfall measurements
for two locations within the National Technical University of Athens (NTUA) campus, rain
attenuation time series are obtained using the Synthetic Storm Technique (SST) [37] and the
outage capacity is then evaluated for a micro-scale dual-site diversity system. The SST is
used due its highly accurate method of capturing the cumulative statistics of rain attenua-
tion [38]. Moreover, a multi-dimensional time series synthesizer based on Gaussian copulasElectronics 2021, 10, 2073 3 of 16
is proposed for generating rain attenuation time series at multiple spatially separated links.
The synthesizer is based on the assumption that in the spatial and the temporal domain
the joint distribution of rain attenuation can be modeled through Gaussian copulas. The
spatial parameter of the copula is calculated from the rain attenuation time series derived
using SST in order for the synthesizer to allow the evaluation of multi-site micro-scale
diversity systems (e.g., triple and quadruple). Experimental campaigns for micro-scale site
diversity scenarios have to be conducted in order to validate the presented results.
The contributions of the paper are the following: (a) a micro-scale site diversity system
is evaluated using rain rate time series and the achieved gain is observed, (b) a novel
multi-dimensional rain attenuation time series synthesizer for multiple slant paths based
on copula functions is proposed (c) a new spatial correlation coefficient for the rainfall
medium across small distances is given (d) the performance of multi-site micro-scale
transmission and reception schemes operating at Ka and Q band as MISO and SIMO
schemes are investigated for the first time in the literature.
The remainder of the paper is organized as follows: in Section 2, the system model
and the expressions for the calculation of capacity for MISO and SIMO systems are given.
In Section 3, the 4-year rainfall data-bank of NTUA is used for the evaluation of a dual-site
micro-scale diversity system. In Section 4, a multi-dimensional copulas synthesizer is
presented and used for the evaluation of micro-scale site diversity systems with multiple
stations. In Section 5, the paper concludes summarizing the used methodology and
commenting on the obtained results.
2. System Model
In this section, the system model used for the evaluation of micro-scale site diversity
systems is presented. Both dual- and multi-site micro-scale diversity systems are examined.
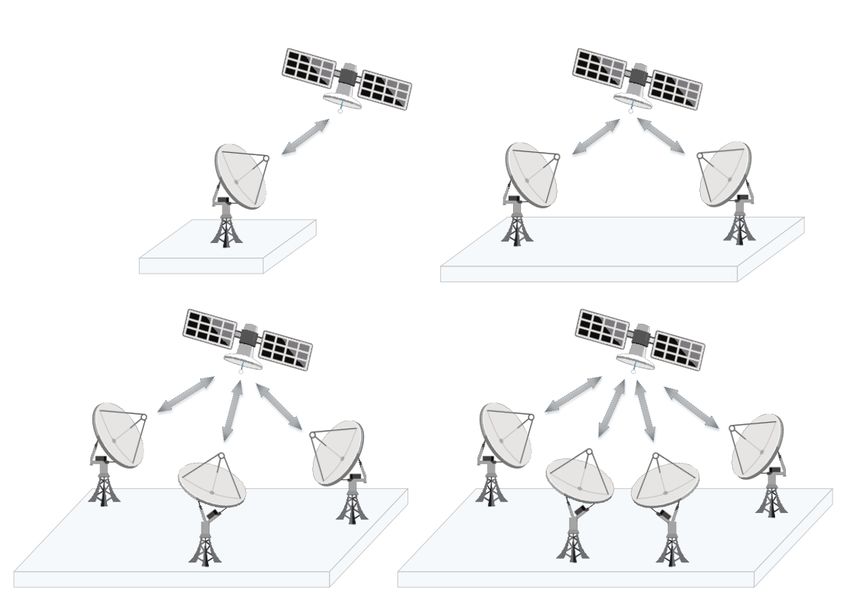
Figure 1 presents the system geometries consisting of a conventional single station scheme
(Figure 1a) as well as three micro-scale site diversity systems for two, three and four
ground stations, respectively, in Figure 1b–d. The system is assumed to operate at Ka-band
and above with highly directive antennas; the multiple links do not interfere with each
other, there is always Line-of-Sight (LOS) and any attenuation is caused due to the signal
propagating through the atmosphere with rain being the dominant fading mechanism.
(a)
(b)
(c) (d)
Figure 1. System configurations for (a) single-link systems, (b) dual-site micro-scale diversity systems,
(c) triple-site micro-scale diversity systems and (d) quad-site micro-scale diversity systems.
In the system examined herein, perfect knowledge of the channel conditions at both
the transmitting and the receiving end of the stations is assumed (i.e., the induced rain
attenuation at the slant paths); the stations are considered to be identical and intercon-
nected with one another. As already mentioned in the introduction, in order to acquire
the channel state the ground stations are either equipped with beacon receivers at theElectronics 2021, 10, 2073 4 of 16
operating frequency (or close enough) or estimate the channel using the pilot symbols
of the frame. Considering that the links operate at Ka-band frequencies and above, the
channel conditions shall remain constant within the Round-Trip Time (RTT) delay, i.e.,
approximately 500 ms for a GEO link. A highly appreciated metric used in the design of
satellite communication systems is the outage capacity, i.e., the percentage of time during
which the system capacity falls below a certain threshold, P(C ≤ Cth ). In this study, the
Shannon–Hartley formula is used for the calculation:
C = B log2 (1 + SNR) (1)
where B is the system bandwidth and SNR represents the Signal to Noise Ratio in linear
terms; Equation (1) refers to single links.
In the case of multiple stations in SIMO configuration and taking into account that
the receiver has perfect knowledge of the channel, the Maximal Ratio Combining (MRC)
scheme can be employed yielding the following capacity [39]:
CSIMO = B log2 (1 + hh H ) (2)
where h = [h1 , . . . , h MR ] is the MR × 1 vector of the SIMO channel for the MR receiving
antennas. The superscript H refers to the transpose conjugate of the channel vector. The
squared measure of the elements in vector h is given by:
|hi |2 = SNRCS,i 10− Ai /10 (3)
where SNRCS,i is the SNR in clear-sky conditions for the link between the satellite and the
i receiver’s antenna and Ai is the rain attenuation induced in the same link. Therefore,
(2) becomes:
MR
CSIMO = B log2 (1 + ∑ SNRCS,i 10− Ai /10 ) (4)
i =1
Regarding the MISO scheme, it is well-known that capacity cannot be enhanced unless
the transmitter has knowledge of the channel conditions [17]; when the channel conditions
are known or can be acquired, the signal can be preprocessed before being transmitted.
The precoding vector to be used shall then be equal to [39,40]:
p hH
w= MT q (5)
M
∑i=T1 |hi |2
where h = [ h1 , . . . , h MT ] is the channel vector for the MT transmitting antennas and the
squared measure of every element vector, i.e., |hi |2 is given by:
SNRCS,i − Ai /10
| h i |2 = 10 (6)
MT
where the clear-sky SNR is divided by MT in order to keep the total transmitted power at
the same level as in the SISO case. The signal is multiplied with the vector w before being
transmitted and according to (5) the highest power ratio shall occur at the link experiencing
the least attenuation. The capacity is given by [39,40]:
CMISO = B log2 (1 + hw)
MT
= B log2 (1 + ∑ SNRCS,i 10− Ai /10 ) (7)
i =1Electronics 2021, 10, 2073 5 of 16
3. Dual-Site Micro-Scale Diversity Scheme
3.1. Experimental Data-Bank
Two identical EML ARG 100 rain gauges [41] have been deployed at the NTUA
Campus in Athens, Greece (37.97◦ N, 23.78◦ E) measuring rainfall at a separation distance
of about 386 m; one of them is placed at the old buildings belonging to the School of
Electrical and Engineering while the other one at the new ones. The rain gauges used are of
tipping bucket type and are pre-calibrated with a measurement resolution of 0.2 mm of rain
per tip; the sampling frequency is set at 1 Hz. Using the recorded rainfall data, rain rate
time series in mm/h with 1-min integration time window have been calculated using the
methodology presented in [38]. The rain rate data availability for both rain gauges has been
100.00% for the whole 4-year time period examined in this paper (June 2012–June 2016).
In Figure 2, the obtained rain rate time series with 1-min integration time are presented
for both locations for the whole 4-year period. In Figure 3, the Complementary Cumulative
Distribution Function (CCDF) of rain rate for each of the locations as well as the joint-
minimum CCDF for both sites at NTUA Campus are presented.
200 Old Buildings
New Buildings
(1-min integration time)
150
Rain Rate [mm/h]
100
50
0
-11 3-0
5 -11 -05 -11 -05 -11 -05
12 1 13 14 14 15 15 16
20 20 20 20 20 20 20 20
Time
Figure 2. Calculated rain rate time series for the examined period and both locations within the
NTUA campus.
102
Old Buildings
New Buildings
101 Joint Minimum
Exceedance Probability [%]
100
10−1
10−2
10−3
0 20 40 60 80 100 120 140
Rain Rate [mm/h]
Figure 3. Cumulative distribution of rain rate for the two locations at NTUA campus and the
joint-minimum CCDF (solid line).
3.2. Emulated Joint Rain Attenuation Statistics
Although the deployment of actual satellite stations to perform measurements has
always been preferred over any simulation methods, it is highly unlikely that one would
attempt it without having a reliable set of simulated results to perform a first assessment;
this is where the benefit of merely using rain gauges, easier to procure and install than
satellite stations becomes apparent. Rain attenuation time series can then be generatedElectronics 2021, 10, 2073 6 of 16
using the Synthetic Storm Technique (SST) with a two-layer model having as input the
rain rate time series obtained via the rain gauges [34]. The SST is a physical–mathematical
propagation modeling tool based on the Taylor hypothesis in order to translate the rain rate
time series into the spatial domain and then calculate the rain attenuation time series on the
slant path. Should rainfall rate data be available, the SST must be the preferred choice over
any other statistical methodology/theory in order to evaluate the system performance-the
application of any of the latter methodologies could yield very questionable results in
real applications, especially for low probabilities. To apply the SST, the average storm
speed is required along the slant path; for Athens, a value of 10.6 m/s is assumed based on
meteorological records. In any case, long-term statistics seem to be insensitive to its precise
value [40].
The two-layer model is defined in the vertical path and is used to capture the melting
layer effects. For the conversion of rain rate R in mm/h to the specific rain attenuation
A0 (dB/km), the classic power-law relationship A0 = kRb is used. The parameters k, b
are calculated from the ITU-R. P. 838 [42] for Layer A (raindrops at 20 ◦ C), while the ones
in [37,40] are used for Layer B (melting hydrometeors at 0 ◦ C).
In Figure 4, the 4-year rain attenuation time series emulated using SST are presented
for the two station locations operating at a frequency of 19.701 GHz, i.e., a Ka-band
downlink. The elevation angle of the links is 45.98◦ , chosen based on the actual elevation
angle (median value) for the geostationary, inclined-orbit satellite Alphasat at 25.0◦ E [43]
as observed from the particular sites. In Figure 5, the CCDF of rain attenuation is given
at Ka-band for the two stations, while the CCDF of the joint-minimum rain attenuation
is also presented referring to an idealized site diversity scenario; the joint-minimum rain
attenuation across N links is
Ajoint (t) = min { A1 (t), . . . , A N (t)} (8)
A gain of almost 2 dB can be achieved for up to 0.01% of the time in this idealized
micro-scale site diversity case. In Figures 6 and 7 the rain attenuation time series and
CCDFs are shown for a Q-band downlink (39.402 GHz), respectively. A gain of 3 dB for up
to 0.1% of the time can be achieved while a gain of 5 dB for up to 0.01% of the time also
seems feasible as indicated by the joint-minimum CCDF in Figure 7.
70 Old Buildings
New Buildings
60
50
Attenuation [dB]
40
30
20
10
0
-11 -05 -11 -05 -11 -05 -11 -05
12 13 13 14 14 15 15 16
20 20 20 20 20 20 20 20
Time
Figure 4. Emulated rain attenuation time series obtained by applying the SST for the two locations at
19.701 GHz, Ka-band downlink.Electronics 2021, 10, 2073 7 of 16
102
Old Buildings
New Buildings
101 Joint Minimum
Exceedance Probability [%]
100
10−1
10−2
10−3
0 5 10 15 20 25 30 35 40
Attenuation [dB]
Figure 5. CCDF of rain attenuation for the two locations along with the CCDF of the joint-minimum
rain attenuation at 19.701 GHz, Ka-band downlink.
Old Buildings
120 New Buildings
100
Attenuation [dB]
80
60
40
20
0
-11 -05 -11 -05 -11 -05 -11 -05
12 13 13 14 14 15 15 16
20 20 20 20 20 20 20 20
Time
Figure 6. Emulated rain attenuation time series obtained by applying the SST for the two locations at
39.402 GHz, Q-band downlink.
102
Old Buildings
New Buildings
101 Joint Minimum
Exceedance Probability [%]
100
10−1
10−2
10−3
0 10 20 30 40 50 60 70 80
Attenuation [dB]
Figure 7. CCDF of rain attenuation for the two locations along with the CCDF of the joint-minimum
rain attenuation at 39.402 GHz, Q-band downlink.
3.3. Capacity Evaluation
In this section, the capacity of a dual MISO-SIMO system is evaluated for a dual-site
micro-scale diversity scenario. Using the rain attenuation time series generated using the
SST, the capacity time series were obtained using (4) for the SIMO systems and (7) for the
MISO ones.
For the SIMO scenario, results are obtained for 19.701 GHz (Ka-band downlink) as
well as 39.402 GHz (Q-band downlink). The clear-sky SNR is considered equal to 30 dB.Electronics 2021, 10, 2073 8 of 16
In Figure 8, the resulting outage capacity is shown for the SISO and the SIMO system
for both Ka-band and Q-band links. It is observed that in clear-sky conditions the micro-
scale system can effectively deliver 11 b/s/Hz, while the SISO one 10 b/s/Hz. This gain
arises from the use of multiple antennas at the receiver, thus proportionally increasing
the SNR (also referred to as array gain). As the attenuation increases (lower exceedance
probabilities) the micro-scale scheme still offers a gain, e.g., at 0.1% of the time the capacity
for the SISO link is 9 b/s/Hz while for the SIMO one is 10 b/s/Hz regarding the Ka-band
downlink case.
101
Exceedance Probability [%]
100
10−1
10−2
Ka-band, SISO Ka-band, SIMO
Q-band, SISO Q-band, SIMO
10−3
0 2 4 6 8 10 12 14 16
Capacity [bits/s/Hz]
Figure 8. Downlink outage capacity statistics for SISO and SIMO systems operating at Ka- (blue
lines) and Q-band (red lines), respectively, for a clear-sky SNR value of 30 dB.
For the uplink, i.e., the MISO case, the outage capacity is shown in Figure 9 for
various values of SNRCS . The operating frequency is assumed at 29.881 GHz, i.e., Ka-band
uplink. The gain, also evident in this case, increases with increasing attenuation, i.e., in
low probabilities; this is attributed to the precoding vector used in the MISO system. As a
matter of fact, in clear-sky conditions all the signals are transmitted with the same power
and equal to the power of a SISO link divided by the number of transmitting antennas; it is
therefore apparent why there is no gain in clear sky conditions. On the other hand, when
attenuation increases, from (5), the highest power ratio will occur at the link experiencing
the least attenuation. Therefore, a gain of up to 50% could be achieved for low probabilities
as observed in Figure 9.
101
Exceedance Probability [%]
100
10−1
10−2 SNR = 10.0 dB, SISO SNR = 10.0 dB, MISO
SNR = 20.0 dB, SISO SNR = 20.0 dB, MISO
SNR = 30.0 dB, SISO SNR = 30.0 dB, MISO
10−3
0 2 4 6 8 10 12
Capacity [bits/s/Hz]
Figure 9. Uplink outage capacity statistics for SISO and MISO systems operating at Ka-band for
clear-sky SNR values equal to 10, 20 and 30 dB.
4. Multi-Site Micro-Scale Diversity Scheme
In this section, a methodology to generate rain attenuation time series spatially corre-
lated for multiple sites based on Copulas functions is presented. It is generally uncommon
for micro-scale satellite communication systems to simultaneously perform in situ beacon
measurements. Therefore, the use of a synthesizer to generate rain attenuation time seriesElectronics 2021, 10, 2073 9 of 16
and then calculate the capacity time series for multiple spatially separated links could be
of significant importance.
In the proposed model, the synthesizer is based on the assumption that joint rain
attenuation statistics in the temporal and the spatial domain are modeled using Gaussian
copulas [34,36]. The advantages of using Gaussian copulas to model the joint statistics in
the spatial domain are that they are simple to apply and can easily be extended for multiple
spatially separated links. Moreover, the synthesizer based on copula functions does not
require the proof of any assumption regarding the distribution of the rain attenuation
induced on a particular single link [36].
4.1. Multi-Dimensional Copulas Based Synthesizer
In this subsection a new multi-dimensional rain attenuation synthesizer is presented,
extending the methodology presented in [18], accounting for multiple links used in diver-
sity and multi-hop scenarios. The copula functions are used to couple the single cumulative
distributions and to ultimately calculate the joint cumulative distribution. Given that the
Cumulative Distribution Functions (CDFs) of dependent random variables are denoted as
ui , i = 1, . . . , n, the joint statistics can be calculated through copula functions. The Gaussian
copula is given by [35]:
P(u) = ΦnR (Φ−1 (u1 ), . . . , Φ−1 (un )) (9)
where P(u) is the joint CDF of the dependent random variables, ΦnR is the CDF of a multi-
variate normal distribution with zero mean and correlation matrix given by R and Φ−1 is
the inverse CDF of a normal distribution with zero mean and unity variance. In (9), the
variables ui , i = 1, . . . , n, refer to the univariate CDFs of rain attenuation for the multiple
links in the case of spatially-joint statistics or to the univariate CDFs of rain attenuation
for different time delays in the case of joint statistics in the temporal domain. In order to
introduce different notations for the spatial and temporal dependence the Copula function,
the correlation matrix of the Gaussian copula and the CDFs of rain attenuation for spatial
joint statistics are denoted as: PSP , RSP and ul , l = 1, . . . , n for n different links, respectively.
For the temporal joint statistics, the Copula function is denoted as PTD , the correlation
matrix as RTD and the CDF of rain attenuation on different time delays as u j , j = 1, . . . , K,
with j being the different time delays. Therefore, the CDF of rain attenuation at link l
and at time instance j is denoted as ulj . Equation (9) can therefore be used to describe the
joint statistics of rain attenuation in the spatial and the temporal domain using different
correlation matrices. In [36], an expression for the calculation of the elements of the
correlation matrix RTD in order to generate time series is given; in [34] an expression for
the calculation of the elements of the correlation matrix RSP is given for multiple spatially
separated links. It should be noted, however, that the expression derived in [34] is based
on measurements with a separation distance of 1.7 km and higher.
In Figure 10, the joint CCDF calculated from the emulated time series as explained in
Section III is shown versus the one obtained using the Gaussian copulas; the copula param-
eter used was equal to 0.971. The fitted Gaussian copula exhibits very good performance
in modeling the joint statistics for this small separation distance. The copula parameter
as proposed in [34] for the same distance, i.e., 386 m, gives a value of 0.9928, however, as
already mentioned, the proposed parameter in [34] is derived using data from site diversity
experiments with separation distance higher than 1.7 km. Therefore, in our case the copula
parameter is extended using a linear relationship between the copula parameter and the
distance as shown below for distances between 386 m and 1.7 km:
ρSP = − 0.214d + 1.054 (10)
where 0.386 ≤ d ≤ 1.7 and d is in km. Moreover, the proposed expression in (10) has been
used to reproduce the experimental data in short scale site diversity in [19]. Therefore it is
reasonable that a global relationship for the correlation coefficient for small distances mayElectronics 2021, 10, 2073 10 of 16
be derived based on Equation (10) with small refinements obtained through experimen-
tal data.
10 2
From SST
Fitted Gaussian Copula
10 1
Exceedance Probability [%]
10 0
10 -1
10 -2
10 -3
0 5 10 15 20 25 30 35
Attenuation [dB]
Figure 10. Joint CCDF of rain attenuation calculated from the minimum of the time series using SST
vs. the fitted Gaussian copula for 19.701 GHz, i.e., Ka-band downlink.
In order to generate rain attenuation time series zero mean and unity variance Gaus-
sian random samples for each of the links are first generated, correlated in the time domain
using the correlation matrix RTD . These samples actually correspond to samples of Φ−1 (ulj )
which refer to time series with only the temporal correlation having been taken into ac-
count. Up to this point, the spatial correlation has not been considered, as these time
series are produced independently for each link. Then for every time instance j the vector
F j = [Φ−1 (u1j ), . . . , Φ−1 (ulj ), . . . , Φ−1 (unj )] T is multiplied on the right side by the Cholesky
decomposition of RSP . It should be noted that the multiplication of F by the Cholesky
decomposition of RSP will again result into Gaussian random variables. Therefore, on
every given time instance j the random variables Φ−1 (ulj ) are now correlated also in the
spatial domain. In order to generate time series of rain attenuation the CDF of Φ−1 (ulj )
has to be calculated first, considering normal zero mean and unity variance distribution in
order to obtain ulj ; then the inverse CDF of rain attenuation distribution is calculated on
the values of ulj . The step-by-step algorithm for generating rain attenuation time series of
duration T with sampling time ts for n links is as follows:
1. Calculate the number of samples K for the time series corresponding to each link,
K = T/ts ;
2. Generate K samples of Gaussian random variables with zero mean and covariance
matrix RTD ;
3. Repeat step 2 n times, equal to the number of links;
4. From the samples created in steps 2 and 3, create the samples of vectors F j considering
the samples from the different links referring to the same time instance j;
5. Multiply on the right side every sample of the vector F j with the Cholesky decompo-
sition of RSP ;
6. Create the matrix U = [F1 , . . . , FK ] T ;
7. Calculate on every element the normal CDF;
8. On every element of each line i calculate the inverse CDF of rain attenuation induced
on link i;
9. Every line of the matrix created in step 8 should now correspond to the rain attenua-
tion time series on each link.
An example of the time series generated is shown in Figure 11, where three stations are
considered to form an equilateral triangle with sides equal to 386 m. The joint-minimum
of the rain attenuation time series is also shown in the same figure. To validate the aboveElectronics 2021, 10, 2073 11 of 16
methodology before applying it to the multi-dimensional case, the joint CCDF of rain
attenuation as obtained from the emulated data (i.e., using the SST) vs. simulated data
using the copula synthesizer for two links is presented in Figure 12; from the results
obtained it can be concluded that the synthesized data are in excellent accordance with the
emulated ones. The second order statistics (fade durations, fade slopes, cross correlation
etc.) are not investigated since they are beyond the scope of this contribution.
5
Link 1
4.5 Link 2
Link 3
Joint Links
4
3.5
3
Attenuation [dB]
2.5
2
1.5
1
0.5
0
0 200 400 600 800
Time [min]
Figure 11. Simulated rain attenuation time series using the proposed copula synthesizer for three
ground stations in Athens at 19.701 GHz, i.e., Ka-band downlink.
10 2
From SST - Ka-band
Fitted Gaussian Copula - Ka-band
From SST - Q-band
Fitted Gaussian Copula - Q-band
10 1
Exceedance Probability (%)
10 0
10 -1
10 -2
10 -3
0 10 20 30 40 50 60 70 80
Rain Attenuation (dB)
Figure 12. Joint CCDF of rain attenuation from the multi-dimensional synthesizer vs. the emulated
time series for systems operating at Ka- and Q-band.
4.2. Numerical Results
Using the multi-dimensional synthesizer proposed in the previous subsection, capacity
time series can be generated for SIMO and MISO satellite communication systems. In
Figure 13 time series of downlink capacity for a single link and a SIMO system with
three ground stations are shown. The use of such a methodology to create capacity time
series bears the advantage that the cumulative statistics of rain attenuation from either
measurements, emulated time series or any other prediction method can be utilized,
including numerical techniques, such as the prediction by ITU-R. P. 618 [44] or any other
well-established distribution used for the modeling the rain attenuation such as the Weibull,
the log-normal, etc. [45–47]. In this paper, the cumulative distribution of rain attenuation
derived from the SST was used directly; the frequency was assumed equal to 19.701 GHz
and the elevation angle equal to 45.98◦ as in the previous section.Electronics 2021, 10, 2073 12 of 16
The outage capacity statistics for the downlink SISO and SIMO cases for 2, 3 and 4
receiving antennas are shown in Figure 14. Regarding the two station scenario, the stations
are placed 386 m apart while in the three station case, the stations form an equilateral
triangle comprising of 386 m sides. Finally, the four stations corresponding to the last
scenario are placed in a square grid with 386 m sides. It is apparent that the gain introduced
in the system compared to the single-link case is quite pronounced and as such, micro-scale
site diversity systems may provide a considerable diversity gain for both clear-sky and
rainy conditions. More presicely, a capacity gain of about 40% can be observed for MR = 2
and 82% for MR = 4 at 0.01% of the time (i.e., 10−4 probability). In Figure 15, the outage
capacity for 1% of the time is shown for the Ka-band downlink SISO and SIMO cases
considering various clear-sky SNR values; a gain in the order of 50% for four stations
is observed.
12
10
8
Capacity [bits/s/Hz]
6
4
2
SISO
SIMO - M R=3
0
0 500 1000 1500 2000 2500
Time [min]
Figure 13. Capacity time series for SISO and SIMO with three stations for the Ka-band downlink at
19.701 GHz using the copula synthesizer.
10 0
10 -1
10 -2
Exceedance Probability
10 -3
10 -4
SISO - Downlink
SIMO - M R=2
10 -5
SIMO - M R=3
SIMO - M R=4
10 -6
0 5 10 15
Capacity [bits/s/Hz]
Figure 14. Ka-band (19.701 GHz) downlink outage capacity statistics for the SISO and the SIMO case
with 2, 3 and 4 stations using the copula synthesizer.Electronics 2021, 10, 2073 13 of 16
10 1
Capacity [bits/s/Hz]
1x4 SIMO
1x3 SIMO
1x2 SIMO
SISO
10 0
0 5 10 15 20 25 30 35
Clear-sky SNR [dB]
Figure 15. Downlink capacity vs. SNR for Ka-band at 19.701 GHz using SISO and SIMO configura-
tions in clear-sky conditions achieved at 1% of the time.
For the case of a MISO system, the uplink from a user terminal with multiple antennas
is examined. In order to have a fair comparison with the SISO system, the uplink power
transmitted through each of the MISO system’s antennas is divided by their number as also
explained in Section III. Using the multi-dimensional synthesizer proposed in the previous
subsection, capacity time series are generated for MISO satellite communication systems
using again 2, 3 and 4 ground stations (MT ) and geometries similar to the ones used in the
SIMO system. Since MISO techniques refer to the uplink/return-link of a user’s terminal,
the operating frequency has been chosen at 29.881 GHz. As in the previous numerical
results, the CDF of rain attenuation calculated from the SST is used for the generation of
rain attenuation time series. The uplink outage capacity is shown in Figure 16 for the three
MISO cases and the corresponding SISO links; as in the case of downlink, a gain is also
observed in the micro-scale site diversity system when the MISO technique is employed.
At 0.01% of the time (i.e., 10−4 probability), the achievable capacity gain almost reaches
100% for MT = 2 and up to 190% for MT = 4, respectively. The diversity gain is further
increased with increasing the number of antennas. Due to the fair comparison in terms
of transmitted power, the capacity in clear-sky conditions remains the same, however,
the use of multiple transmitting antennas under rainy conditions offers a substantial gain
compared to the SISO case. Increasing the number of transmitting stations even further,
a higher gain under rain is to be observed.
As a final remark, the difference between the MISO and SIMO system is the gain at
higher time percentages where SIMO clearly outperforms a corresponding SISO architecture.
10 0
10 -1
10 -2
Exceedance Probability
10 -3
10 -4
SISO
MISO - M T =2
10 -5 MISO - M T =3
MISO - M T =4
10 -6
0 2 4 6 8 10
Capacity [bits/s/Hz]
Figure 16. Uplink outage capacity statistics for the SISO and the MISO case with 2, 3 and 4 stations
using the copula synthesizer.Electronics 2021, 10, 2073 14 of 16
5. Conclusions
In this paper, SIMO and MISO micro-scale site diversity systems are evaluated in
terms of capacity and compared to the conventional SISO case for both downlink and
uplink scenarios, respectively. Using the 4-year experimental rainfall data-bank from two
stations at NTUA campus, the SST is used to obtain rain attenuation time series. From
the rain attenuation time series the outage capacity is calculated assuming receive (SIMO)
and transmit (MISO) diversity schemes with perfect channel state knowledge at the user
terminal; a gain seems to always be present for both cases and at both Ka- and Q-band.
A multi-dimensional time series synthesizer based on Gaussian copulas is proposed for the
generation of spatio-temporally dependent time series of rain attenuation. Using the rain
attenuation time series from the SST, the parameter of Gaussian copula is calculated for
micro-scale site diversity systems. Making use of the proposed synthesizer, micro-scale
site diversity systems with multiple ground stations are evaluated, concluding that a
considerable gain is always present for both clear-sky and rainy conditions. Experimental
propagation campaigns for micro-scale site diversity scenarios must be conducted in order
to validate the presented results.
It has been shown that even small separation distances in the order of a few hundred
meters can significantly improve system performance. Micro-scale site diversity systems
can therefore be exploited by enterprise users to increase data rates, ensure high system
availability and therefore allow for trouble-free operation of time-critical, high data volume
applications. Part of the pending future work on the subject is the assessment of the channel
capacity within the framework of real modulation schemes (e.g., QAM) comparing the
results with the ones based solely on the Shannon’s Gaussian channel.
Author Contributions: Conceptualization, A.Z.P. and A.D.P.; Formal analysis, A.Z.P. and A.D.P.;
Investigation, A.Z.P.; Methodology, A.Z.P., A.D.P. and C.I.K.; Software, A.Z.P. and C.I.K.; Supervision,
A.D.P.; Validation, A.Z.P.; Visualization, A.Z.P. and C.I.K.; Writing—original draft, A.Z.P. and A.D.P.;
Writing—review and editing, A.Z.P. and A.D.P. All authors have read and agreed to the published
version of the manuscript.
Funding: This research received no external funding.
Conflicts of Interest: The authors declare no conflict of interest.
References
1. Sharma, S.K.; Chatzinotas, S.; Arapoglou, P.D. (Eds.) Satellite Communications in the 5G Era; Telecommunications, Institution of
Engineering and Technology: London, UK 2018.
2. Völk, F.; Liolis, K.; Corici, M.; Cahill, J.; Schwarz, R.T.; Schlichter, T.; Troudt, E.; Knopp, A. Satellite Integration into 5G: Accent on
First Over-The-Air Tests of an Edge Node Concept with Integrated Satellite Backhaul. Future Internet 2019, 11, 193. [CrossRef]
3. Gupta, A.; Jha, R.K. A Survey of 5G Network: Architecture and Emerging Technologies. IEEE Access 2015, 3, 1206–1232.
[CrossRef]
4. Evans, B.G. The role of satellites in 5G. In Proceedings of the 2014 7th Advanced Satellite Multimedia Systems Conference and
the 13th Signal Processing for Space Communications Workshop (ASMS/SPSC), Livorno, Italy, 8–10 September 2014; pp. 197–202.
[CrossRef]
5. Shi, S.; An, K.; Li, G.; Li, Z.; Zhu, H.; Zheng, G. Optimal Power Control in Cognitive Satellite Terrestrial Networks With Imperfect
Channel State Information. IEEE Wirel. Commun. Lett. 2018, 7, 34–37. [CrossRef]
6. Wang, C.; Bian, D.; Shi, S.; Xu, J.; Zhang, G. A Novel Cognitive Satellite Network With GEO and LEO Broadband Systems in the
Downlink Case. IEEE Access 2018, 6, 25987–26000. [CrossRef]
7. Morel, C.; Arapoglou, P.D.; Angelone, M.; Ginesi, A. Link adaptation strategies for next generation satellite video broadcasting:
A system approach. IEEE Trans. Broadcast. 2015, 61, 603–614. [CrossRef]
8. Nakazawa, S.; Nagasaka, M.; Tanaka, S.; Shogen, K. A method to control phased array antenna for rain fading mitigation of
21-GHz band broadcasting satellite. In Proceedings of the Fourth European Conference on Antennas and Propagation, Barcelona,
Spain, 12–16 April 2010; pp. 1–5.
9. Lei, J.; Vázquez-Castro, M.Á. Multibeam satellite frequency/time duality study and capacity optimization. J. Commun. Netw.
2011, 13, 472–480. [CrossRef]
10. Vasavada, Y.; Gopal, R.; Ravishankar, C.; Zakaria, G.; BenAmmar, N. Architectures for next generation high throughput satellite
systems. Int. J. Satell. Commun. Netw. 2016, 34, 523–546. [CrossRef]Electronics 2021, 10, 2073 15 of 16
11. Katona, Z.; Clazzer, F.; Shortt, K.; Watts, S.; Lexow, H.P.; Winduratna, R. Performance, cost analysis, and ground segment design
of ultra high throughput multi-spot beam satellite networks applying different capacity enhancing techniques. Int. J. Satell.
Commun. Netw. 2016, 34, 547–573. [CrossRef]
12. Roumeliotis, A.J.; Kourogiorgas, C.I.; Panagopoulos, A.D. Dynamic Capacity Allocation in Smart Gateway High Throughput
Satellite Systems Using Matching Theory. IEEE Syst. J. 2019, 13, 2001–2009. [CrossRef]
13. Matricciani, E. A method to achieve clear-sky data-volume download in satellite links affected by tropospheric attenuation. Int. J.
Satell. Commun. Netw. 2016, 34, 713–723. doi:10.1002/sat.1126. [CrossRef]
14. Matricciani, E. Probability distributions of rain attenuation obtainable with linear combining techniques in space-to-Earth links
using time diversity. Int. J. Satell. Commun. Netw. 2018, 36, 220–237. doi:10.1002/sat.1214. [CrossRef]
15. Kanatas, A.; Panagopoulos, A.D. Radio Wave Propagation and Channel Modeling for Earth–Space Systems; CRC Press: Boca Raton, FL,
USA, 2016; Chapter 2.
16. Crane, R.K. Propagation Handbook for Wireless Communication System Design; CRC Press: Boca Raton, FL, USA, 2003.
17. Panagopoulos, A.D.; Arapoglou, P.D.M.; Cottis, P.G. Satellite communications at Ku, Ka, and V bands: Propagation impairments
and mitigation techniques. IEEE Commun. Surv. Tutor. 2004, 6, 2–14. [CrossRef]
18. Matricciani, E. Micro scale site diversity in satellite and tropospheric communication systems affected by rain attenuation. Space
Commun. 2003, 19, 83–90.
19. Acosta, R.J. Special effects: Antenna wetting, short distance diversity and depolarization. Online J. Space Commun. 2002, 2, 1–9.
20. Enjamio, C.; Vilar, E.; Ndzi, D.; Perez-Fontán, F. Short-scale diversity in a dynamic rain fade environment. Int. J. Satell. Commun.
Netw. 2005, 23, 143–152. [CrossRef]
21. Kourogiorgas, C.; Panagopoulos, A.D.; Livieratos, S.N.; Chatzarakis, G.E. Pico-scale Dynamic Diversity Gain Evaluation in
Broadband Satellite Communication Systems. In Proceedings of the EuCAP 2015, Lisbon, Portugal, 12–17 April 2015.
22. Paulraj, A.; Nabar, R.; Gore, D. Introduction to Space-Time Wireless Communications; Cambridge University Press: Cambridge,
UK, 2003.
23. Kyrgiazos, A.; Evans, B.G.; Thompson, P. On the gateway diversity for high throughput broadband satellite systems. IEEE Trans.
Wirel. Commun. 2014, 13, 5411–5426. [CrossRef]
24. Rossi, T.; De Sanctis, M.; Maggio, F. Evaluation of outage probability for satellite systems exploiting smart gateway configurations.
IEEE Commun. Lett. 2017, 21, 1541–1544. [CrossRef]
25. Jeannin, N.; Castanet, L.; Radzik, J.; Bousquet, M.; Evans, B.; Thompson, P. Smart gateways for terabit/s satellite. Int. J. Satell.
Commun. Netw. 2014, 32, 93–106. [CrossRef]
26. Ventouras, S.; Reeves, R.; Rumi, E.; Perez-Fontan, F.; Machado, F.; Pastoriza, V.; Rocha, A.; Mota, S.; Jorge, F.; Panagopoulos, A.D.;
et al. Large scale assessment of Ka/Q band atmospheric channel across Europe with ALPHASAT TDP5: The augmented network.
In Proceedings of the 2017 11th European Conference on Antennas and Propagation (EUCAP), Paris, France, 19–24 March 2017;
pp. 1471–1475. [CrossRef]
27. Papafragkakis, A.Z.; Panagopoulos, A.D.; Ventouras, S. Combined beacon and noise satellite propagation measurements using
software defined radio. In Proceedings of the 2017 11th European Conference on Antennas and Propagation (EUCAP), Paris,
France, 19–24 March 2017; pp. 2356–2360. [CrossRef]
28. Digital Video Broadcasting (DVB). Second Generation Framing Structure, Channel Coding and Modulation Systems for Broadcasting,
Interactive Services, News Gathering and Other Broadband Satellite Applications; Technical Report; ETSI: Sophia-Antipolis, France, 2005.
29. Digital Video Broadcasting (DVB). Second Generation Framing Structure, Channel Coding and Modulation Systems for Broadcasting,
Interactive Services, News Gathering and Other Broadband Satellite Applications, Part II: S2-Extensions (S2-X) EN 302307-2; Technical
Report; ETSI: Sophia-Antipolis, France, 2014.
30. Karagiannis, G.A.; Panagopoulos, A.D.; Kanellopoulos, J.D. Multidimensional rain attenuation stochastic dynamic modeling:
Application to earth–space diversity systems. IEEE Trans. Antennas Propag. 2012, 60, 5400–5411. [CrossRef]
31. Cheffena, M.; Braten, L.E.; Ekman, T. On the space-time variations of rain attenuation. IEEE Trans. Antennas Propag. 2009,
57, 1771–1782. [CrossRef]
32. Maseng, T.; Bakken, P. A stochastic dynamic model of rain attenuation. IEEE Trans. Commun. 1981, 29, 660–669. [CrossRef]
33. Jeannin, N.; Féral, L.; Sauvageot, H.; Castanet, L.; Lacoste, F. A large-scale space-time stochastic simulation tool of rain attenuation
for the design and optimization of adaptive satellite communication systems operating between 10 and 50 GHz. Int. J. Antennas
Propag. 2012, 2012, 749829. [CrossRef]
34. Kelmendi, A.; Kourogiorgas, C.; Hrovat, A.; Panagopoulos, A.D.; Kandus, G.; Vilhar, A. Prediction of joint rain attenuation
statistics induced on earth–satellite multiple site diversity systems using Gaussian copula. IEEE Antennas Wirel. Propag. Lett.
2017, 16, 95–98. [CrossRef]
35. Nelsen, R.B. An introduction to Copulas; Springer Science & Business Media: London, UK 2007.
36. Kourogiorgas, C.; Kelmendi, A.; Panagopoulos, A.D.; Vilhar, A. On rain attenuation time series generation: A new simple
copula-based channel model for satellite slant paths. IEEE Trans. Antennas Propag. 2016, 64, 3206–3211. [CrossRef]
37. Matricciani, E. Physical-mathematical model of the dynamics of rain attenuation based on rain rate time series and a two-layer
vertical structure of precipitation. Radio Sci. 1996, 31, 281–295. [CrossRef]
38. Matricciani, E.; Riva, C. The search for the most reliable long-term rain attenuation CDF of a slant path and the impact on
prediction models. IEEE Trans. Antennas Propag. 2005, 53, 3075–3079. [CrossRef]Electronics 2021, 10, 2073 16 of 16
39. Lo, T. Maximum ratio transmission. IEEE Trans. Commun. 1999, 47, 1458–1461. [CrossRef]
40. Kanellopoulos, S.A.; Panagopoulos, A.D.; Matricciani, E.; Kanellopoulos, J.D. Annual and diurnal slant path rain attenuation
statistics in Athens obtained with the synthetic storm technique. IEEE Trans. Antennas Propag. 2006, 54, 2357–2364. [CrossRef]
41. EML Environmental Measurements Limited. ARG100 Rain Gauge User Manual. Available online: http://www.emltd.net/
uploads/1/0/5/1/105135655/um-780-001-arg100.pdf (accessed on 1 August 2021)
42. ITU-R Recommendation P.838-3: Specific Attenuation Model for Rain for Use in Prediction Models; Technical Report; International
Telecommunication Union: Geneva, Switzerland, 2005.
43. Paraboni, A.; Riva, C.; Capsoni, C.; Codispoti, G.; Zuliani, L.; Speziale, V.; Falzini, S.; Martellucci, A.; Colzi, E. Description of
Alphasat TDP5 Propagation Experiment. In Proceedings of the ESA Workshop “Radiowave Propagation Models, Tools, and Data
for Space Systems”, Noordwijk, The Netherlands, 3–5 December 2008; pp. 1–4.
44. ITU-R Recommendation P.618-13: Propagation Data and Prediction Methods Required for the Design of Earth-Space Communication
Systems; Technical Report; International Telecommunication Union: Geneva, Switzerland, 2017.
45. Boulanger, X.; Feral, L.; Castanet, L.; Jeannin, N.; Carrie, G.; Lacoste, F. A rain attenuation time-series synthesizer based on a
dirac and lognormal distribution. IEEE Trans. Antennas Propag. 2013, 61, 1396–1406. [CrossRef]
46. Kanellopoulos, S.A.; Panagopoulos, A.D.; Kourogiorgas, C.I.; Kanellopoulos, J.D. Satellite and terrestrial links rain attenuation
time series generator for heavy rain climatic regions. IEEE Trans. Antennas Propag. 2013, 61, 3396–3399. [CrossRef]
47. Kanellopoulos, S.A.; Kourogiorgas, C.I.; Panagopoulos, A.D.; Livieratos, S.N.; Chatzarakis, G.E. Channel model for satellite
communication links above 10 GHz based on Weibull distribution. IEEE Commun. Lett. 2014, 18, 568–571. [CrossRef]You can also read