ITIL Process and Impact Analysis at Rabobank ICT

Page created by Kimberly Moody
 
CONTINUE READING
ITIL Process and Impact Analysis at Rabobank ICT

             Tom Thaler, Sönke Knoch, Nico Krivograd, Peter Fettke, Peter Loos

                               Institute for Information Systems (IWi)
                  {tom.thaler, nico.krivograd, peter.fettke, peter.loos}@iwi.dfki.de
                       Research Department Intelligent User Interfaces (IUI)
                                        soenke.knoch@dfki.de
       at the German Research Center for Artificial Intelligence (DFKI) and Saarland University

          Abstract. The given BPI Challenge 2014 provides an ITSM case study at
          Rabobank based on ITIL with the demand on fact-based insights into the impact
          of changes to the workload at the Service Desk and/or IT Operations. The
          report at hand checks the conformance of the conducted ITSM processes at
          Rabobank Group ICT to the ITIL standard. Moreover, ITIL conforming reports
          considering Incident Management and Change Management are provided and
          an approach for the identification of CIs, wherefore change activities are most
          promising in terms of reducing the workload at Service Desk and IT Operations
          is developed. As a result, some concrete recommendations for the Rabobank
          Group ICT are derived.
          Keywords: Business Process Intelligence, Business Intelligence, Process
          Mining, Data Warehousing, ITIL, BPM

1 Introduction

The given BPI challenge is about a use case at Rabobank Group ICT, the ICT part of
the Rabobank. Similar to other ICT companies, Rabobank Group ICT has to
implement an increasing number of software releases, while the time to market is
decreasing. Thus, ITIL processes were implemented, wherein the change process is
used for implementing so called planned changes. 1 The challenge is to develop
method, techniques or prediction models reducing the workload at Service Desk and
IT Operations. At the same time, the challenge description does not answer the
question, whether the aspects of Rabobank overall or solely aspects of Rabobank
Group ICT is of main interest. The relationship between the corresponding concepts is
visualized in Figure 1.
    Since we need to focus on a particular field, in this report the results from an
analysis of ITIL-processes implemented by Rabobank Group ICT are presented.
Methods of process mining [1] were applied and a set of tools used to understand the
process in a bottom up manner. Log files generated by HP Service Manager 9 which
is the software used in this process form the basis of this analysis. The main focus in
this report is the conformance of the process discovered from the log compared to a

1   BPI Challenge 2014: http://www.win.tue.nl/bpi/2014/challenge
ITIL Process and Impact Analysis at Rabobank ICT
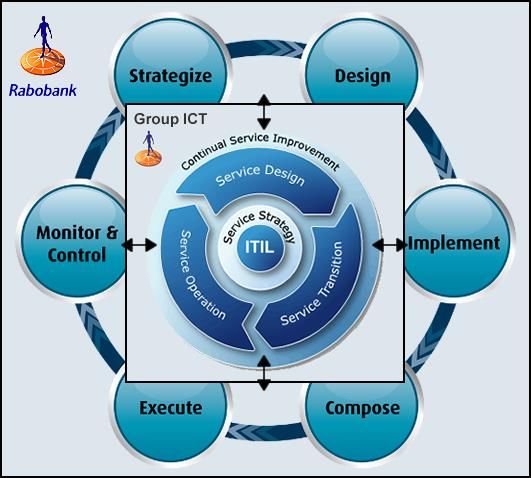
reference process from literature. ITIL process metrics are used to provide an
overview of most important facts and numbers. The development of the process over
time is analyzed and gives insight on tendencies derived from the implemented
business process. Finally, an approach is developed, which allows the identification of
Configuration Items which are promising in term of their impact to Service Desk and
IT Operations.

           Figure 1: Relationship between BPM and ITSM lifecycle at Rabobank
Section 2 starts with a description about the process context and the main objectives
for process analysis. Section 3 and 4 provide information about the approach applied
to prepare and analyze the data. In Section 4 applied tools and techniques are
described. Section 5 depicts the match between the ITIL reference process and the
process at hand, split into incident (5.1) and Change Management (5.2). In Section 6
the results from data and process analysis are presented for Incident Management
(6.1) and Change Management (6.2), respectively. In Subsection 6.3 a comprehensive
analysis over all provided logs is presented. Section 7 underlines central findings and
gives recommendations about what could be done to improve the process and future
process analysis. Finally, in Section 8 the conclusion summarizes the results presented
in this report.

2 Context Description and Objectives

The case study covers two parts of an IT Service Management (ITSM) at Rabobank
Group ICT. These parts are Incident Management and Change Management from the
ITIL framework, whereby the Rabobank is primarily interested in fact-based insights
into the impact of changes to the workload at the Service Desk and/or IT Operations.
The relevant processes (Interaction Management, Incident Management and Change
Management) at Rabobank are summarized as follows:
ITIL Process and Impact Analysis at Rabobank ICT
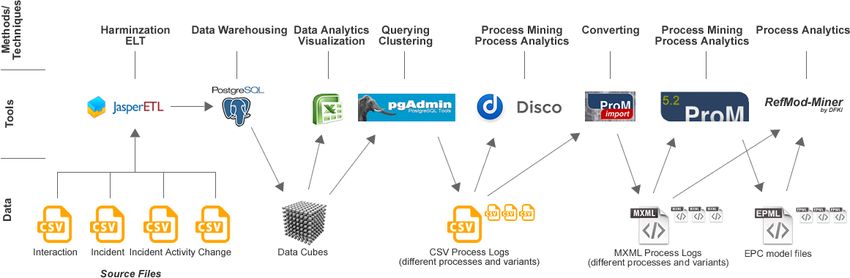
Table 1: Delivered database tables
 interaction          incident               incident activity       change
 CI Name (aff)        CI Name (aff)          Incident ID             CI Name (aff)
 CI Type (aff)        CI Type (aff)          DateStamp               CI Type (aff)
 CI Subtype (aff)     CI Subtype (aff)       IncidentActivity        CI Subtype (aff)
                                             Number
 Service Comp (aff)   Service Comp (aff)     IncidentActivity Type   Service Comp (aff)
 Interaction ID       Incident ID            Interaction ID          Change ID
 Status               Status                 Assignment Group        Change Type
 Impact               Impact                 KM number               Risk Assessment
 Urgency              Urgency                                        Emergency Change
 Priority             Priority                                       CAB-approval
                                                                     needed
 Category             Category                                       Planned Start
 KM number            KM number                                      Planned End
 Open Time            Open Time                                      Scheduled
                                                                     Downtime Start
 Close Time           Reopen Time                                    Scheduled
                                                                     Downtime End
 Closure Code         Resolved Time                                  Actual Start
 First Call           Close Time                                     Actual End
 Resolution
 Handle Time          Handle Time                                    Requested End
 Related Incident     Closure Code                                   Change record
                                                                     Open Time
                      Alert Status                                   Change record
                                                                     Close Time
                      #Reassignments                                 Originated from
                      #Related                                       #Related
                      Interactions                                   Interactions
                      Related Interactions                           #Related Incidents
                      #Related Incidents
                      #Related Changes
                      Related Changes
                      CI Name (CBy)
                      CI Type (CBy)
                      CI Subtype (CBy)
                      Service Comp
                      (CBy)

Interaction Management. In order to manage calls or mails from customers
(Rabobank colleagues) at the Service Desk concerning disruptions of ICT services, a
Service Desk Agent (SDA) logs calls/mails in an Interaction record and relates them
to an Affected Configuration Item (CI). The SDA can either resolve the issue for the
customer directly (First Call Resolution) or create an incident record to assign the
issue to an Assignment Group with more technical knowledge to resolve the service
disruption. If similar calls/mails are received by the Service Desk, a SDA can decide
to relate multiple Interaction records to one Incident record. Further logging of
Activities to resolve the service disruption will be done in the Incident record.
Incident Management. Based on an estimated Impact and Urgency, graded by the
SDA, an Incident record is prioritized and gets a deadline to resolve the service
disruption. A Team Leader within the Assignment Group assigns the records to an
Operator. The Operator resolves the issue for the customer, or reassigns the record to
a colleague if other or more knowledge is needed. After solving the issue for the
customer, the Operator relates the Incident record to the Configuration Item that
caused the service disruption (CausedBy CI). After closing the Incident record, the
customer receives an email to inform him that the issue is resolved.

Change Management. If particular service disruptions reoccur more often than
usual, a problem investigation is started, conducting an analysis leading to an
improvement plan to prevent the service disruption from happening again. The
improvement plan leads to a Request for Change (RfC) on the CausedBy CI. All CIs
are related to a Service Component, Risk Impact Analysis is done by an
Implementation Manager assigned to changes related to the specific Service
Component.

In order to allow the community develop corresponding predictive and analysis
models, the Rabobank provides extracts of four database tables (interaction, incident,
incident activity, change) related to these processes. The field definitions are outlined
in the following Table 1.
                          Table 2: Description of selected fields
 CI Name (aff)         Configuration Item (CI) where a disruption of an ICT Service is
                       noticed, this is what we call the "Affected CI". A Service Desk Agent
                       always uses questions in a Knowledge Document (identified by a
                       KM number) to find the correct CI in the Configuration Item
                       Database (CMDB).
 CI Type (aff)         Every CI in the CMDB is related to an Entity Type.
 CI Subtype (aff)      Every CI in the CMDB is related to a Subtype, which is related to a
                       CI Type.
 Service Comp (aff)    Every CI in the CMDB is related to 1 Service Component, in order to
                       identify which Product Manager is responsible for the CI. A Service
                       Component is equal to a product in the Bill of Material and is part of
                       one or more Services.
 Category              In order to select and compare similar Interactions in the Service
                       Management tool, all records are categorized. The categorization is
                       derived from the Knowledge Document.
 KM number             A Knowledge Document contains default attribute values for the
                       Interaction record and a set of questions for a Service Desk Agent to
                       derive which Configuration Item is disrupted and to determine
                       Impact and Urgency for the customer.
 Change Type           In order to select and compare similar Changes in the Service
                       Management tool, all records are categorized by Change Type.
 Risk Assessment       Impact of Change: Major Business Change, Business Change or
                       Minor Change.
Based on the given data and process descriptions, participants are asked to identify
impact pattern describing or predicting the impact of changes on the workload of the
Service Desk and the IT Operations. Especially the identification of opportunities
decreasing these workloads seems to be very relevant in that context. Against that
background, the report at hand aims at treating the following business
questions/objectives:

           Do the implemented ITSM processes at Rabobank follow the ITIL standard?
            What are conforming parts and where are differences?
           Reporting the current state of the IT Service Management (Incident
            Management and Change Management) at Rabobank.
           Developing an approach allowing the identification of most promising
            changes in terms of reducing the workloads of the Service Desk and IT
            Operations. This makes it possible to derive the parameters which are
            necessary for the development of a prediction model.

3 Data Preparation

Since the available data were provided as CSV files, an ETL process (extract,
transform, load) was conducted in order to harmonize the data and write them into a
database. Indeed, the extraction is already finished (relevant data are available), but
there are some inconsistencies, although the data come from the same information
system. For example, there are four different notations of timestamps, which need to
be harmonized in order to allow an analysis. Furthermore, there are different spellings
of particular attribute values (e.g. Software vs. software vs. SOFTWARE as closure
codes in the interaction table).
   These data transformation and harmonization steps, as well as a transportation of
the resulting data to a PostgreSQL2 database, is modeled and conducted using Jasper
ETL3.

               Figure 2: Composition of used data, tools and methods/techniques

2   PostgreSQL: http://www.postgresql.org/
3   Jaspersoft ETL: http://community.jaspersoft.com/project/jaspersoft-etl
4 Relevant Methods, Techniques and Tools

Since all data are now available in a database, it is possible to analyze them using BI /
data warehousing methods and techniques. Thus, first of all, some analytical views
similar to the concept of data cubes were created, which enables the slicing and dicing
of the data considering particular aspects in detail. With this in mind, furthermore,
some additional information is derived from the delivered data, as e.g. time attributes
(year, quarter, month, week, etc. as well as durations), boolean values (e.g. is change
in requested time, is change in planned time, etc.) as well as particular aggregations
(e.g. aggregation of change types). In a nutshell, both the data are enriched and
preprocessed for an efficient analysis.
   In order to also enable the application of process mining techniques, the resulting
data are linked at some points (e.g. interactions leading to incidents leading to
changes), converted to process mining conforming log files (containing a case ID, an
activity, a timestamp and an originator) and exported as CSV files (process logs).
These process logs were also clustered by different aspects and characteristics (e.g.
only interactions with first call resolution or only incidents without interactions etc.).
Thus, an adequate data material for a detailed analysis of different process variants
was created with the help of a database management system. Against the background
that CSV files are not support by all intended tools (only by fluxicon Disco4), they are
additionally converted to the MXML format using the ProM Import Framework5.
   With the help of ProM6, different process mining approaches, especially the
Heuristics Miner [2] and the Fuzzy Miner [3], are applied to the generated log files,
the resulting models are converted to EPCs (Event-Driven Process Chain) and
exported as EPML7. This format is supported by the RefMod-Miner8 and allows us,
together with the log files, to analyze different further aspects like the correlation
between different events, which are not visible in the mined process models.
   Further analysis of the data and their visualization are conducted with the help of
Microsoft Excel, the PostgreSQL database management system itself and the
corresponding graphical user interface pgAdmin9. The range of the applied methods,
techniques and tools is visualized in Figure 2.

5 ITIL Process Conformance

The given case study in general and the provided data material in particular cover two
processes of the framework, (1) Incident Management and (2) Change Management.
In order to gain a better understanding of what we are working on, a matching of the

4 Fluxicon Disco: http://fluxicon.com/disco/
5 ProM Import Framework 7.0: http://www.promtools.org/promimport/
6 ProM 5.2: http://www.promtools.org/prom5/
7 EPML: http://www.mendling.com/EPML/
8 RefMod-Miner: http://refmod-miner.dfki.de/
9 pgAdmin: http://www.pgadmin.org/
case study (especially the given data material) to the ITIL framework was performed.
The established ITIL within the Rabobank may be much more extensive, however,
the given data material only allows a limited view on the processes with a focus on
the challenge questions. The basic processes are modeled by Software AG (with
ARIS) and base on the original ITIL literature [4-8], whereby the matched parts are
shaded in grey.

5.1 Incident Management

In the terminology of ITIL an incident is defined as “An unplanned interruption to an
IT service or reduction in the quality of an IT service. Failure of a configuration item
that has not yet impacted service is also an incident […]. Incident Management is the
process for dealing with all incidents; this can include failures, questions or queries
reported by the users [...], by technical staff, or automatically detected and reported by
event monitoring tools.” [4] In the context at hand, the customer reports the incident
via calling a Service Desk where it is then treated by a service employee. The incident
is categorized (here: complaint, regular incident, problem, change request,
information request, service request), it is checked for corresponding incidents and
prioritized (here: from 1 - critical to 5 – planning, plus a determination of urgency and
impact on an analogue scale). As the database does not contain any special indicator
or field characterizing a major incident, we define an incident as major if its attributes
urgency and impact and priority are lower than or equal to 2 (0.8%).
   In addition to the ITIL standard, the Rabobank distinguishes between interactions
and incidents, whereby interactions can be interpreted as a preliminary state of an
incident or also as an incident with special characteristics. If a request can be resolved
directly by the Service Desk (with or without first call resolution), it is not necessary
to record an incident, in all other cases, it is. Thus, the interaction constitutes the first
point of contact in ITIL terminology. When an incident is recorded, it is then assigned
to an operator, who either resolves it or reassigns it via different service levels, in case
deeper knowledge is needed. If necessary, a change request (Change Management) is
created. Furthermore, a solution or a workaround (
Release and                                          Service
            Service                                Event                                      Supplier                                    Access
                                                                      Deployment                                          Validation
             Desk                                Management                                  Processes                                  Management
                                                                      Management                                         and Testing
                                XOR

                                                                                                                         test failed
                              incident                                                                                                        access
                                                                                                                         because of
                              reported                                                                                                       violation
                                                                                                                         an incident

                                XOR

                              incident
                               logging

                               incident
                            classification

           service                                   Incident           check for
           request              XOR                  category          correspondi
           logging                                   assigned          ng incidents
                                                        no
                                                                                                                                                          corresponding
           request                                corresponding
                                                                           XOR                                                                               incident
          fulfilment                                 incident
                                                                                                                                                             available
                                                     available

                                                      incident
                                                    priorization                                                                                          link incidents

                                     major                             no major                initial
                                                       XOR
                                    incident                           incident             diagnostics

                                      V                                escalation                             incident can
                                                                                               XOR
                                                                       neccessary                             be resolved
                         IT Service
                                             major incident
                         Continuity                                                                             provide
                                                process                 incident
                        Management                                                                             solution /
                                                                       escalation
                                                                                                              workaround
                                                     hierarchical                       functional
                                                      escalation
                                                       initiated
                                                                          V             escalation
                                                                                         initiated

                                                                                     assign incident
                                                      Inform and
                                                    involve senior        V           to next level
                                                                                     support group

                                                                          XOR

                                                                      analysis and
                                                                      diagnostics

                                                                          XOR

                                                                                          change for
                                                                      permanent
                                                  workaround                             workaround /
                                                                       solution
                                                   provided                                solution
                                                                        found
                                                                                           required
                                                                                             create
                                                                                            change
                                                                                            request

                                                                                            change
                                                                                            request
                                                                                            created

                                                                                           Change
                                                                                         Management

                                                                                        change request
                                                                                          for incident
                                                                          XOR
                                                                                            solution                               Problem
                                                                                           approved                               Management
                                                                      solution and
                                                                        recovery
                                                                                                                                       XOR

                                                                          XOR               XOR                             Problem            Workaround
                                                                                                                             closed            developed
                                                   incident                                Incident
                                                 solution not                              solution                                    XOR
Legend:                                           successful                               finished

                                                                                             V                                         XOR
            Activity
                                                                                                                                   check linked
            Event                                                                                                                     open
                                                                                                                                    incidents

  XOR       XOR                                                                              V                   linked open
                                                                                                                                                         no solution
                                                                                                                    incident           XOR
                                                                                                                                                          possible
                                                                                                                   resolved
  V         OR                                                                          check whether
                                                                                            incident
                                                                                           occured in
  V                                                                                      testing phase
            AND
                                                                        incident did
                                                                                                         test incident
                                                                        not occur in        XOR
                                                                                                           resolved
            Process-                                                   testing phase
            interface                                                                                                            Service
                                                                                            XOR
                                                                                                              V                 Validation
           Matched to                                                                                                          and Testing
           Case Study
                                                                                             close
                                                                                           incident

Figure 3: ITIL Incident                                               incident could
                                                Problem                                                      incident
Management Process matched                                           reoccur / reason       XOR                                  Service Desk
                                               Management                                                 formally closed
                                                                         unknown
to the given case study.
Figure 3: I TIL Incident Ma nage ment Process matched to give n case study

The changes considered in the case study seem to come only from a reactively
perspective since the ‘originated_from’ field in the change table only contains
“Incident” (7,192 cases), “Interaction” (2 cases) and “Problem” (10,810 cases). After
the request for change (RfC) is accepted, it is prioritized in terms of deciding whether
the change is an emergency change (about 0.3%) or not. ITIL defined emergency
changes as reserved “changes intended to repair an error in an IT service that is
negatively impacting the business to a high degree” ([6], pp. 60). The risk for the
change is assessed subsequently, thus, the change is assigned to one of the following
categories: Minor Change (94%), Business Change (5.7%) and Major Change (0.4%).
The ITIL standard furthermore describes a standard change as “a change to a service
or infrastructure for which the approach is pre-authorized by Change Management
that has an accepted and established procedure to provide a specific change
requirement” ([6], pp. 48). It seems, that no of the named change types can be mapped
to the standard change, as all of the type contain cases, in which a CAB approval is
necessary (see Table 3, shaded in grey). However, having a look on the column
named ‘change type aggregated’ (we aggregated the entries to the basic types: Change
Component, Master Change, Master Change Roadmap, Release Change, Standard
Activity and Standard Change), one can easily see that only Release Change falls into
the ITIL definition of a standard change. Thus, not only the risk assessment but also
the change type must be taken into account according to the context, which outlines
an adaption to the ITIL standard.
                   Table 3: Risk assessment to CAB approval needed

risk assessment           change type aggregated                                                                        Need CAB appr.   #cases    ratio
Minor Change              Change Component                                                                                   No             15    0.08%
Business Change           Master Change                                                                                      No              1    0.01%
Minor Change              Master Change                                                                                      No             35    0.19%
Minor Change              Master Change Roadmap                                                                              No              2    0.01%
Business Change           Release Change                                                                                     No             40    0.22%
Major Business Change     Release Change                                                                                     No              2    0.01%
Minor Change              Release Change                                                                                     No          1,063    5.9%
Business Change           Standard Activity                                                                                  No             11    0.06%
Major Business Change     Standard Activity                                                                                  No              1    0.01%
Minor Change              Standard Activity                                                                                  No          6,504 36.13%
Business Change           Standard Change                                                                                    No            748    4.16%
Major Business Change     Standard Change                                                                                    No             21    0.12%
Minor Change              Standard Change                                                                                    No          9,185 51.02%
Business Change           Release Change                                                                                     Yes           211    1.17%
Major Business Change     Release Change                                                                                     Yes            25    0.14%
Minor Change              Release Change                                                                                     Yes           138    0.77%
Release and                                                          Service           Service Asset
                       Problem                 Incident                                                          Transition                Service
Deployment                                                        Validation and            and                                                                 Service Level          Event
                      Management             Management                                                         Planning and              Catalogue
Management                                                           Testing           Configuration                                                            Management           Management
                                                                                                                   Support               Management
                                                                                       Management

                                                  XOR

                                                                    Capacity            Information              IT Service                                                            Service
                       Supplier                                                                                                                                  Availability
                                                  RfC                                     Security               Continuity                Evaluation                                 Catalogue
                      Management                                   Management                                                                                   Management
                                               positioned                              Management               Management                                                           Management

                               review RfC      record RfC

                 RfC                                             RfC
                                  XOR                                                                                 priorization
               declined                                        accepted

                                                                                                   RfC is not                              RfC is
                                                                                                   emergency               XOR           emergency
                                                                                                    change                                change

                                                                                                    risk                                 Emergency
                                                                                                assessment                               procedure

                                                                                                     XOR

                                                change of
                                               access rights                                         minor                         major                            serious         standard
                                                requested                                           change                        change                            change           change

                                                                                                                                                                                     standard
                                                 Access                                                                            CAB                              Board
                                                                                                       V                                              XOR                             change
                                               Management                                                                         meeting                          meeting
                                                                                                                                                                                    procedure
                                                                                                                                                    Action
                                                                                   inform CAB                         XOR                         recommen
                                                                                                                                                     ded

                                                                                                                     request
                                                                                                                   provisional          Evaluation
                                                                                                                   evaluation

                                                                                                                                            XOR
                                                                                                                        expected                         provisional
                                                                                                                       performance                       evaluation
                                                                                                                           is ok                       report created
                                                                                                                                            XOR

                                                                                                                                          estimate
                                                                                                                       V                implications
                                                                                                                                            and
                                                                                                                                         ressources
                                                                                                                    estimate
                                                                                                                      error
                                                                                                                   correction

                                                                                                                  change
                                                                                                                authorization

                                                                                             change not                                  change
                 XOR                                                                                                  XOR
                                                                                             authorized                                 authorized

                                                                                                                                        change
              decline RfC
                                                                                                                                     planning and
                                                                                                                                      scheduling

              inform RfC
            initiator about                                                                                                                 V
                 decline                                                                                                                                         check whether
                                                                               Release and                            manage                                        change is
                                            Service Desk                       Deployment                              change                                     requested by
              RfC initiator                                                    Management                          implementation                              Incident / Problem
               informed
                                                                                                                                                                     Mgmt.

                                                                                   XOR                                                                                  XOR

                                                                                                     release
                                                                 release         release                                                       RfC not
                                                                                                    deployed                                                     RfC approved        RfC approved
                                                               deployment      deployment                                                   requested by
                                                                                                   with known                                                     for incident        for problem
                                                                  failed       successful                                                     Incident /
                                                                                                      errors                                                        solution            solution
                                                                                                                                           Problem Mgmt.
                                                                                             XOR
                                                               trigger error
                                                                                                                                                  V                 Incident          Problem
                                                                correction
                                                                                                                                                                  Management         Management
                                                                   plan
                                                                                                                           evaluation         request
                                                                                                    Evaluation               report          evaluation
                                                                                                                           requested           report

                                                                                                     evaluation
                                                                                                       report
                                                                                                      created
                                                                           Release and                                            change
                                                                                                           V
                                                                           Deployment                                             record
                                                                           Management                                             review

                                                                                                                review not                         review
                                                                                                                                     XOR
                                                                                                                 satisfying                       satisfying
    Figure 4: ITIL Change
    Management Process matched to                                                                                                                     XOR
    the given case study.
                                                                                                                                                   close                change
                                               place RfC          XOR                                                                             change                record
                                                                                                                                                   recort               closed

                                                                                                               V                                   Process-                              Matched to
  Legend:                     Activity              Event          XOR     XOR           V      OR                     AND
                                                                                                                                                   interface                             Case Study
Figure 4: I TIL C ha nge Manageme nt Process matches to the g iven case st udy

The evaluation fragments of the ITIL process cannot be matched to the given case
study, however, the changes are generally planned, scheduled and processed in
conformance to the ITIL standard, although it is not possible to identify a review and
documentation of them in the database tables. The matched fragments of ITIL Change
Management process are visualized in Figure 4 (detailed analysis in Section 6.2).

6 Data and Process Analytics

6.1 ITIL Incident Management Report

In this section we use the ITIL Incident Metrics ([4], pp. 54) and analyze the tables
for further interesting information.
   In this case, we have a special issue. The Rabobank differentiates the ITIL-
Incidents between interactions and incidents. Interactions are events which could be
dissolved in a first call. Interactions that cannot be solved immediately will be
escalated to the next support level. Then, in the next support level, they are called
Incidents. In the following, we use the ITIL definition of incidents and we do not
differentiate between interactions and incidents.
   The following Table 4 presents the considered ITIL Incident Metrics and gives an
overview on the actual state. Details to these metrics and values are presented in the
subsequent explanatory notes.
                                                                                   Table 4: ITIL Incident Management Metrics
 ITIL Metric                                                                                                        Value
 01 Total number of incidents                                                                                                                150,720
 02 Breakdown of incidents at each stage                                                                                     Solved on first contact:
                                                                                                                                 93,996 (≈ 62.36%)
                                                                                                                    Further support levels involved:
                                                                                                                                 42,881 (≈ 28.45%)
                                                                                                                     Not initiated by Service Desk:
                                                                                                                                   3,716 (≈ 2.47%)
 03                                   Size of current incident backlog                                                                            15
 04                                   Number and percentage of major incidents                                                      1,207 (≈ 0.8 %)
 05                                   Mean elapsed time to archive incident resolution
                                                                                                                               see explanatory notes
                                      of circumvention, broke down by impact code
 06                                   Number of incidents reopened and as a percentage
                                                                                                                                   2,428 (≈ 0.52 %)
                                      of the total
 07                                   Number and percentage of incidents incorrectly
                                                                                                                                51,961 (≈ 11.13 %)
                                      assigned
 08                                   Percentage of incidents closed by the Service Desk
                                      without reference to other levels of support (often                                       93,996 (≈ 62.36 %)
                                      referred to as “first point of contact”)
 09                                   Number and percentage of incidents resolved
                                                                                                                                 3,546 (≈ 83.01 %)
                                      remotely, without the need for a visit
 10                                   Breakdown of incidents by time of day, to help
                                                                                                                               see explanatory notes
                                      pinpoint peaks and ensure matching of resources
Explanatory notes

1.   Total number of incidents

The total number of incidents is 150,720. The result was determined by means of an
outer join on Interactions and Incidents.

2.   Breakdown of incidents at each stage

The 150,720 incidents were broken down to their status as shown in Table 5.
                     Table 5: Breakdown of incidents at each stage
 Status     Description                                                  #Incidents
            Interactions solved on the first contact                         93,996
            Interactions leading to incident                                 42,881
 Closed
            Incidents without interactions                                    3,716
            Interactions which are closed but no incidents exist             101,12
            Interactions with status “Open - Linked”                              6
 Open       Interactions with status “Closed” but the incidents
                                                                                   9
            status are “Work in progress”

3.   Size of current incident backlog

Another interesting point is the number of incident backlogs. The incident backlog
contains incidents, which are still opened. Corresponding to Table 5, the backlog has
a size of 15.

4.   Number and percentage of major incidents

A major incident is defined for us by a value less than or equal to 2 at each of the
fields “Impact”, “Urgency”, and “Priority” (IUP). The scale of fields ranges from 1 -
very high to 5 - very low. We noticed a type conflict in the analysis. The interaction
with the “Interaction ID” = SD0117519 and the incident with the “Incident ID” =
IM0038625 have by the field “Urgency” the value “5 –Very Low”. In contrast, all
other records have only numeric values.
   A total of 1,207 (≈ 0.8 %) incidents are major incidents, whereby 1,203 (99.67%)
of them have an IUP code of (2,2,2) and 4 (0.33%) have an UIP code of (1,1,1).

5.   Mean elapsed time to archive incident resolution of circumvention, broke down
     by impact code

Here, we could not determine a link between the IUP code and the rate of dissolution.
Incidents with a higher IUP code do not have a better average solution time as
incidents with a lower IUP code.
6.   Number of incidents reopened and as a percentage of the total

A total of 2,428 (≈ 0.52 %) incidents must be reopened (see Table 6). Especially
already completed incidents to applications often need to be reopened. 2,428 of
32,900 application incidents must be reopened, which corresponds to a rate of 7.80 %.
This indicates that the service team has made mistakes or that the incidents remained
unsolved.
                     Table 6: Number of Reopen Activity / CI Type

CI Type                        #reopen activities Fraction of all reopen activities
Application                                1,858                          76.52%
Subapplication                               367                          15.12%
Computer                                     118                            4.86%
Database                                      30                            1.24%
Software                                      12                            0.49%
Hardware                                      10                            0.41%
Storage                                         9                           0.37%
no type                                         8                           0.33%
Office electronics                              7                           0.29%
Display device                                  4                           0.16%
Network components                              4                           0.16%
Application component                           1                           0.04%

7.   Number and percentage of incidents incorrectly assigned

In 51,961 (≈11.13%) cases, the incidents were incorrectly assigned and therefore had
to be reassigned (see Table 7). Most commonly, such faulty assignments occur in
applications (40,405). This is an indicator for the Service Desk making an incorrect
assignment at each tenth incident.
                    Table 7: Reassignments depending on CI Types

CI Type                          #Reassignments       Fraction of all reassignments
Application                               40,405                             77.76%
Subapplication                             5,926                             11.41%
Computer                                   4,200                              8.08%
Hardware                                     353                              0.68%
Software                                     253                              0.49%
Display device                               225                              0.43%
Storage                                      217                              0.42%
Database                                     163                              0.31%
no type                                       88                              0.17%
Network components                            65                              0.13%
Office electronics                            48                              0.09%
Application component                         11                              0.02%
Phone                                          4                              0.01%
8.   Percentage of incidents closed by the Service Desk without reference to other
     levels of support (often referred to as “first point of contact”)

In total, there are 93,996 (≈ 62.36%) interactions without an incident and a successful
first call resolution (see Table 8). The most frequently occurring incidents belong to
the category of "incident". They have an average handle time of 7 minutes. The
second most frequent category is "request for information" with an average handle
time of 7 minutes.
                   Table 8: Number of Interactions without an Incident

Category                                Number of Incident       Average handle time
incident                                             73,828                         7m
request for information                              20,124                         7m
service request                                           22                       10 m
complaint                                                 17                        5m
problem                                                    5                        8m
                                         average handle time                     7.12 m

9.   Number and percentage of incidents resolved remotely, without the need for a
     visit

Since no incident activity type "customer visit" exists in the data, we have defined a
visit to the customer as follows. When an external vendor was involved and we
contacted the customer, this was considered a visit.
   In 4,272 (≈ 2.83 %) cases an external vendor was involved in the resolution of the
incident. In 726 (≈ 16.99 %) of these cases, a visit to the customer was necessary.
This means that 3,546 (≈ 83.01 %) incidents were resolved remotely, without the need
for a customer visit.

10. Breakdown of incidents by time of day, to help pinpoint peaks and ensure
    matching of resources

In Figure 5 you can clearly see that most incidents occur in the morning. At midday
we have a decrease of incidents. This is most likely the case because the employees
then take their lunch break, and therefore not report any incidents. In the afternoon the
number of incidents rises again. These incidents occurring in the morning can often
be dissolved in a first contact.

Additional Facts

In addition to the ITIL Incident Management Metrics, we also investigated some
further interesting facts and key figures on the incidents. First of all, there are 289
service components (products) which were supported in terms of concrete cases.
Depending on the characteristics of the Incidents, we investigated the corresponding
time consumption as follows.
25000
            20000
   #cases

            15000
            10000
            5000
                0
                        0-1h
                        1-2h
                        2-3h
                        3-4h
                        4-5h
                        5-6h
                        6-7h
                        7-8h
                        8-9h

                      10-11h
                      11-12h
                      12-13h
                      13-14h
                      14-15h
                      15-16h
                      16-17h
                      17-18h
                      18-19h
                      19-20h
                      20-21h
                      21-22h
                      22-23h
                      23-24h
                       9-10h                          time of day

                             Number of Interactions           Number of Incidents

                            Figure 5: Number of Incidents per Time of Day
                    Table 9: Time consumption depending on process characteristics
                                                                     handle time
 Characteristics                                   average              min                  max
 Solved by Service Desk                            00:07:12         00:00:00             06:15:30
 Recorded but not solved by Service               0.96 days           0 days          181.46 days
 Desk
 No Service Desk involvement                       18:51:44         00:04:38           19,61 days
 Open-close time of all incidents                 1.98 days           0 days            889 days
 recorded by Service Desk

Furthermore, we analyzed the waiting time (open-close time - handle time; without
the exceptions and shortened to whole days):
      Exceptions: In 15 cases, the handle time is greater than the open-close time
      Average wait time: 3.78 days
      Min wait time: 0
      Max wait time: 477

We also identified the Top 3 service components and Top 3 CI Types in context of
Incident Management:
             Table 10: Top 3 service components and CI types (Incident Management)
                                            Object                             #Incidents (Ratio)
                                            WBS000073                            33,528 (22.25%)
Top 3 Service Components                    WBS000128                             14,130 (9.36%)
                                            WBS000092                              7,219 (4.79%)
                                            Application                          99,483 (66.01%)
Top 3 CI Types                              Subapplication                       20,745 (13.76%)
                                            Storage                               11,829 (7.85%)
6.2 ITIL Change Management Report

Analogue the Incident Management, we instantiated an ITIL Change Management
Report based on the ITIL standard [4]. Since the given information on changes are
rare, 15 metrics were selected, which were possible to calculate and to derive
statements for.
                      Table 11: ITIL Change Management Metrics
 ITIL Metric                                             Value
 01 Mean Time to Restore Service (MTRS)                      Average delta downtimes
                                                                scheduled: ≈21 hours
                                                                conducted: ≈10 hours
 02    Changes without reference to the CAB                                      98.04%
 03    Outstanding changes and changes in progress                                7.28%
 04    Number and percentage of emergency changes                            34 (0.19%)
 05    Number of changes which met the customer’s                Achieved requested end:
       requirements, e.g., quality, cost, and time                      14,266 (85.45%)
 06    Reduction in the backlog of change requests                                   yes
 07    Reduction in the number and percentage of
                                                                 No significant reduction
       unplanned changes and emergency fixes
 08    Average time to implement                                            1 day 8 hours
 09    Incidents attributable to changes                                     205 (1.14%)
 10    Efficiency                                                       16,688 (92.71%)
 11    Reduction in time, effort, cost to make changes              Light reduction trend
 12    Frequency of changes                                                        18,000
 13    Ratio of planned vs. unplanned changes                     15 changes not planned
 14    Ratio of accepted to rejected changes                                      92.73%
 15    Time to execute a change                                            See Figure 10

Explanatory notes

1.    Mean Time to Restore Service (MTRS)

According to ([4], pp. 45), the MTRS is the total downtime divided by the number of
service breaks. In the data set, we define a downtime as the difference between actual
start and end of an implementation when a scheduled downtime is set. This is the case
for only 2.12% (382) of all changes. While for 36 changes actual start or end is not set
(scheduled and not conducted), the remaining 346 changes were focused. For 55
changes the actual start is earlier than it was scheduled (in time), for 137 actual start
equals the scheduled downtime (just in time) and for 154 it was later than it was
scheduled (not in time). The average delta between scheduled downtime and actual
start is 8 days and 5 hours. Comparing the average delta between start and end of
scheduled downtimes (21 hours) to the average delta between the actual start and end
(10 hours), it turns out that the actual downtime is on average 11 hours, shorter than it
was scheduled.
2.   Changes without reference to the CAB

([4], CAB-Agenda, pp. 59) claims to measure failed changes, unauthorized changes,
backed-out changes, or changes without reference to the CAB sorted by Incident
Management, Problem Management or Change Management. While information on
the first three points is rare, it was focused on the last. 98.04% of all changes need no
CAB-approval. Table 12 lists change numbers that need a CAB-approval by their
origin. Note that the sum of all changes equals 18,004, as 4 changes are labeled as
both, incident and problem.
               Table 12: Number of changes that need CAB-approval by origin
 Origin            CAB-approval      Share of Changes
                   No                                                          2 (0.01%)
 Interaction
                   Yes                                                         0 (0.00%)
                   No                                                      7102 (39.45%)
 Incident
                   Yes                                                       90 (00.50%)
                   No                                                     10526 (58.47%)
 Problem
                   Yes                                                      284 (01.58%)

3.   Outstanding changes and changes in progress

To analyze the number of outstanding changes and changes in progress as suggested
in ([4], CAB-Agenda, pp. 59), a glimpse on the data fields containing timestamps as
provided in Table 13 is necessary. The table shows all change-related data fields
containing time data and provides the earliest and latest time value respectively. It can
be seen that every change has a record open and close event, indicated by the number
of empty cells that is null. To identify outstanding changes, changes that were opened
and closed although an implementation never started were considered. The number of
such changes is 1,310 (7.28%). The timestamp in 2021 in the table seems to be an
error, as no change implementation can be finished in the future. In total, four changes
with an actual start after March 2014 exist.
               Table 13: Earliest and latest timestamp and number of empty cells
 Data field                   Earliest                  Latest                     Null cells
 Requested end                26.10.2012 11:00:00       20.02.2028 17:00:00                 0
 Change record open time      01.09.2011 09:13:00       31.03.2014 16:46:00                 0
 Change record close time     01.10.2013 06:47:00       31.03.2014 23:53:00                 0
 Planned start                01.06.2011 07:00:00       20.02.2021 12:30:00                0
 Planned end                  13.10.2011 10:00:00       20.02.2021 17:30:00              43
 Actual start                 16.10.2012 13:09:00       21.03.2021 00:00:00            3258
 Actual end                   26.10.2012 11:00:00       21.03.2021 00:01:00            3261
 Scheduled downtime start     21.12.2012 14:29:00       21.03.2015 01:00:00           29520
 Scheduled downtime end       23.06.2013 04:00:00       21.03.2015 01:00:00           29531

4.   Number and percentage of emergency changes

The number and percentage of emergency changes is 34 (0.19%).
5.   Number of changes which met the customer’s requirements

To calculate the number of changes implemented to services which met the
customer’s agreed requirements, e.g. quality, cost, and time, it was focused on the
time of change implementations that can be understood as a change’s costs. 66% of
all changes were started in time (started before planned to start), 22% were started just
in time (exactly started when planned to start) and 12% were started later than they
were planned to start. The difference between planned and actual start of changes that
lies on average at 3 days and 19 hours indicates a potential for optimization. In an
ideal world, changes should always start when they were planned to start.
    Customer’s agreed requirements are defined as changes where the requested end
date was not reached. In total, 2,430 (14.55%) did not achieve the requested end. The
mean deviation was 11 days and 13 hours. 747 (4.47%) changes ended exactly when
requested to end and 13,519 (80.98%) changes ended earlier with a mean deviation of
9 days and 22 hours.

6.   Reduction in the backlog of change requests

To check for a reduction in the backlog of change requests, changes with an earlier
requested end compared to the actual end were analyzed. For a statement concerning
the development over time, the data set was divided into two sets. We used the date
‘2013-12-31 23:59:59’ and split the data in changes that occurred before and after that
date. We divided according to the requested end and the actual end, respectively, with
the results presented in Table 14. Divided by the requested end data field, a reduction
of the average deviation between requested and actual end by about 50% could be
observed. Divided by the actual end, no improvement in time could be observed.
Thus, we had a view on changes with a start and end in the respective intervals
indicated by actual end’ in the table. A reduction of 1 day was determined.
                         Table 14: Backlog development over time
 Criterion for division                  Changes           Average deviation
 Requested end < 2013-12-31 23:59:59      1429 (58.81%)               14 days 14:44:14
 Requested end > 2013-12-31 23:59:59      1001 (41.19%)                6 days 28:20:27
 Actual end < 2013-12-31 23:59:59         1359 (55.93%)               10 days 11:44:23
 Actual end > 2013-12-31 23:59:59         1071 (44.07%)               12 days 21:37:10
 Actual end’ < 2013-12-31 23:59:59        1268 (64.27%)                9 days 12:14:59
 Actual end’ > 2013-12-31 23:59:59         708 (35.83%)                8 days 12:45:14

Figure 6 shows the deviation of changes between requested and actual end for the
time interval between October 2013 and March 2014. Changes with a deviation
greater 1 month were considered as outliers (151) and were filtered out. The data is
arranged according to the actual end timestamp, but the diagram looks similar if
arranged according requested end timestamp. Beside the gap around the turn of the
year no trends are visible.
Figure 6: Deviation between requested and actual end ordered by actual end.

7.   Reduction in the number and percentage of unplanned changes and emergency
     fixes

Similar to the approach above, we divided the data set into two halves for emergency
changes. Between October and December 2013, 18 emergency changes occurred,
while, between January and March 2014, 13 emergency changes occurred. To check
for unplanned changes, changes where the planned start or (inclusive) the planned end
is null were considered. Both between October and December 2013 and between
January and March 2014, 15 of such changes occurred. Due to the low number of
relevant changes in both cases, no significant reduction was detected.

8.   Average time to implement based on urgency/priority/change type

Focusing on the duration of change implementations, 35.77% show a time difference
of zero, thus, they are closed instantly. The remaining 64.23% of changes have a
duration that ranges from a few hours up to two years. On Figure 7 it is visible that
the majority of all changes takes between 0 and 2 minutes (13.30%; in all cases
exactly 1 minute), between 10 and 20 minutes (9.52%) and between 1 and 2 hours
(13.18%). Divided into rougher time intervals, about 43% of all changes have a
duration of less than 1 hour, 38% between 1 and 24 hours, 13% between 24 hours and
1 week and the remaining 6% up to two years. Average implementation time of all
changes is 1 day and 8 hours. Focusing on change started and ended between October
2013 and March 2014 the average is 19:52:54 and affects the majority of all changes
(16215 / 90%).
Figure 7: Number of changes per duration of actual implementation.
Table 15 shows the average implementation times for five different categories. It is
noticeable that master changes (0.21% of all changes) take significantly longer than
other changes. Standard change types (56%) and release types (8%) take about one
day longer than the average.
                   Table 15: Average time of implementation per category
 Category                                                 Average time
                            Change Component                             Values not set
                            Standard Activity [x]                       1 day 08:14:40
 Change type                Standard Change Type [x]                   2 days 02:26:28
                            Release Type [x]                           2 days 12:05:43
                            Master Change                    7 months 14 days 09:30:00
                            yes                                               09:41:27
 CAB-approval needed
                            no                                          1 day 08:27:44
                            yes                                               07:41:43
 Emergency change
                            no                                          1 day 08:08:02
                            Major Business Change                             01:24:38
 Risk assessment /
                            Business Change                                   15:32:05
 impact of change
                            Minor Change                                1 day 09:03:20
                            Interaction                                       11:43:30
 Originated from            Incident                                          21:47:16
                            Problem                                     1 day 15:17:32
 All changes                                                            1 day 08:05:08
 Changes started / ended between Oct.’13 / Mar.‘14                            19:52:54
9.   Incidents attributable to changes

Respective data fields indicate 11 related interactions and 18,789 related incidents.
Only 205 changes (1.14% of all changes) are marked as related in the Incident log.

10. Efficiency: Ratio of changes implemented vs. Request for Change (RFC)
    received

16,688 changes were implemented in the data set. This results in an efficiency of
92.71%.

11. Percentage reduction in time, effort, cost to make changes and releases (e.g., by
    service, change type, asset type)

To check for a reduction in time, again, the time interval between October 2013 and
March 2014 was investigated. Therefore, time intervals equal to zero and greater one
month were filtered out. Figure 8 shows a light trend of time reduction indicated by
the red line.

             Figure 8: Implementation time between Oct. 2013 and Mar. 2014.

12. Frequency of changes

The change log lists 18,000 changes, each identified by an ID. Changes are divided
into 240 change types. Figure 9 presents a rough division of changes according to five
different change types abstracted from the 240 concrete change types. It can be seen
that the majority of changes are types as Release Type (8%), Standard Activity (37%)
and Standard Change Type (56%). Parallel to the division into change types, changes
are arranged according to their Impact of Change in the Risk Assessment column.
According to this categorization, a change is a Minor Change (94.11%), Business
Change (5.62%) or Major Business Change (0.27%). Changes originate from an
Interaction (0.02%), an Incident (39.94%) or a Problem (60.04%).

                      Figure 9: Rough division of changes into types.
13. Ratio of planned vs. unplanned changes

Having a look on the delta between the time when a change implementation was
planned to start and when it actually started, it turns out that 66% of all changes were
started in time (started before planned to start), 22% were started just in time (exactly
started when planned to start) and 12% were started later than they were planned to
start. The mean delta between the planned and the actual start is about 3 days and 19
hours.
   Focusing on the ratio of planned and unplanned changes, only 15 changes have no
planned start and end. Only one of these 15 was actually implemented – caused by a
hardware problem.

14. Ratio of accepted to rejected change requests

1,309 (7.27%) changes have a record close time and no actual start and end, thus are
rejected. For 63 changes the actual start lies behind the close time of the record.
Finally, the ratio of accepted to rejected change requests is 92.73%.

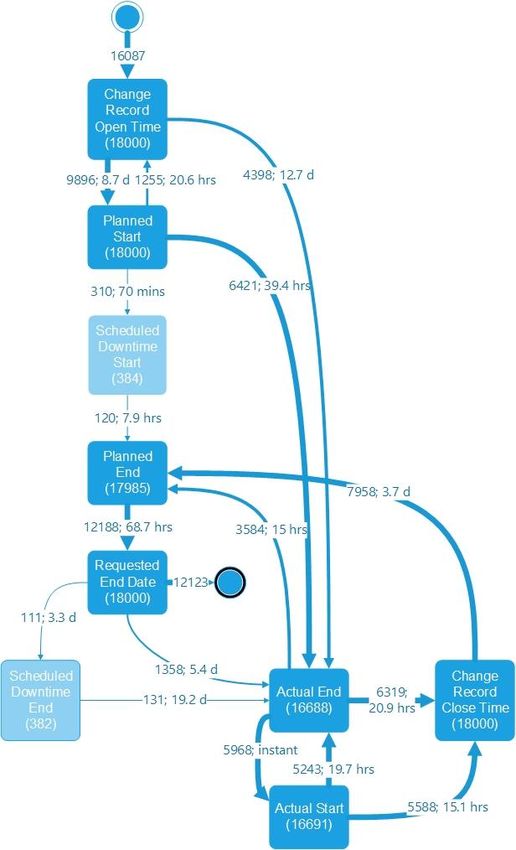
15. Time to execute a change (from initiation through each stage in the lifecycle of a
    change, ending in completion: by lifecycle, by service, by infrastructure
    problem)

Figure 10 shows the process steps a change goes through. The edges of the graph are
labeled with the mean duration calculated by fluxicon Disco. Activities were set to
100% and path to 10%. It is noticeable that not every change runs through all of these
nine process steps. For example, for 97.87% of all changes no service downtime was
scheduled. For 7.22% of all listed changes, the change implementation was never
conducted (no actual start and end).

    Figure 10: Life cycle of changes annotated with absolute change frequency and mean
                            duration inspired by fluxicon Disco.
Additional Facts

The change log contains 30,275 records that cover Configuration Items (CI) and
changes. In this log, 10,293 different CI names are listed divided into 13 types and 74
subtypes. Cis are related to 286 service components. A product manager is
responsible for respective service components.

Delay to start. We wanted to get a deeper understanding of the delay from the point
when a record was opened until the point when the change implementation was
started. In the result, 1.43% are implemented instantly, 18.37% take up to one hour to
be implemented, 25.85% up to 24 hours, 28.39% up to one week, 16.96% up to one
month and 8.69% up to one year. There are also a few changes that take several years
to start (0.29% between one and two years, 2 changes between two and three (0.01%),
1 change seven years (0.01%). The mean difference between both timestamps over all
changes averages 12 days. Changes that are labeled as an emergency change average
about 3 and a half days. When a CAB-approval is needed, the change needs on
average 65 days to start. When a CAB-approval for an emergency change is needed, it
takes only about 8 days.

Deviation between requested and actual end. To validate the planned values, the
requested end was analyzed. Comparing it to the actual end of a change
implementation results in the mean deviation of 9 days and 17 hours. When the
change involves an emergency change the deviation is 1 day and 18 hours. When a
CAB-approval is needed the mean deviation counts 18 days and 18 hours.

Time a record remains open. The mean time a change record remains open is about
18 days. Using the change categorization from above, the analysis of the data shows
that Business Changes take longer (with an average duration of 42 days) than Minor
Changes (with an average duration of 16 and a half days). As expected, a Major
Business Change takes even longer with an average of about 85 days. Concerning the
change’s origin, Incidents result in change records that are open for about 21 days on
average. Changes with an Incident as origin remain open for 13 and a half days. The
two changes with an Interaction as origin remain open for 1 year 2 month 15 days and
10 days 20 hours respectively. According to the five change types depicted in Figure
9, Change Components take about 180 days and Master Changes almost 200 days on
average. Release Types remain open for about 77 days, Standard Activities for 33
days and Standard Change Types for 56 days. Table 16 provides an overview on the
discussed time intervals regarding the time, a change record remains open.
                Table 16: Mean time a record remains open per category.
    Change Category          Mean Time Difference per Change        Share of Changes
 Business Change                                42 days 01:41:45                5.50%
 Minor Change                                   16 days 11:59:20               94.25%
 Major Business Change                          85 days 07:41:37                0.25%
 Interaction                                   226 days 11:10:00                0.01%
 Incident                                       13 days 11:23:56               39.92%
 Problem                                        21 days 02:31:21               60.07%
 Emergency Change Y                             15 days 14:51:34                0.19%
 Emergency Change N                             18 days 02:04:58               99.81%
 CAB-approval needed Y                          79 days 10:55:11                1.96%
 CAB-approval needed N                          16 days 20:27:04               98.04%
 Master Change                                 198 days 20:41:08                0.21%
 Change Component                              179 days 15:16:40                0.08%
 Release Type [x]                               77 days 16:05:25                8.21%
 Standard Activity [x]                          33 days 02:24:46               36.20%
 Standard Change Type [x]                       56 days 08:50:15               55.30%
6.3 Crossover Analytics

We generally consider the time span between 2013-10-01 and 2014-03-31, since this
is the relevant time span within the given data, wherein cases (interactions, incidents,
changes) were closed.
    First of all, we try to answer the question of whether there are particular
Configuration Items (CIs) affecting the workload of the Service Desk and IT
Operations significantly more than others. Since we identified the combination of CI
name and the service component as a precise identifier of a CI, we analyzed the
number of interactions to the different CIs (Figure 11).
                                  15000                                             21 CIs (of 4,213) cover at least
   # Interactions

                                  10000                                                 1% of all interactions each
                                                                              (= Most Important CIs at Service Desk)
                                  5000
                                      0
                                          1100
                                          1257
                                          1414
                                          1571
                                          1728
                                          1885
                                          2042
                                          2199
                                          2356
                                          2513
                                          2670
                                          2827
                                          2984
                                          3141
                                          3298
                                          3455
                                          3612
                                          3769
                                          3926
                                          4083
                                             1
                                           158
                                           315
                                           472
                                           629
                                           786
                                           943

                                                                            CI

                                                    Figure 11: Number of interactions per CI
Thereby we found out, that only 144 of the available 4,213 CIs cover 87.37% of all
interactions. Moreover, only 21 of the CIs still cover 50.28% of all interactions and
are responsible for 46.88% of the overall Service Desk workload (see Figure 12).
Moreover, about 30% of the corresponding interactions lead to the creation of an
incident (further service levels) and there are also 10 CIs whose interactions lead to an
Incident in more than 40% of the cases(when the green line in the figure is over the
dotted line). These 21 CIs are analyzed with a special consideration of their
characteristics and impact to the IT Operations (see Table 17).

                                  100,00%                                          21 CIs (of 4,213) cover
   Fraction of all Interactions

                                                                                   ~ 50% of all Interactions and
                                  80,00%

                                  60,00%

                                  40,00%

                                  20,00%

                                    0,00%
                                             1 2 3 4 5 6 7 8 9 10 11 12 13 14 15 16 17 18 19 20 21
                                                                  CI

                                          Interaction        Leading to Incident         First Call Resolution

                                                 Figure 12: Most important CIs at Service Desk
Table 17: Workload Characteristics of Most Important CIs at Service Desk

                                                                               Fraction of all
                                                               #Interactions

                                                                                                                           Service Desk
                                                                                Interactions
                       Component

                                                 CI-Subtype

                                                                                                                            Fraction of
                                                                                                 Leading to

                                                                                                              Resolution

                                                                                                                            Workload
                                                                                                              First Call
          CI-Name

                                   CI-Type

                                                                                                  Incident
                        Service
ID

  1 SAN000182       WBS000128      S         SAN              10668            7.26%              4.52%       95.02%          3.23%
  2 WBA000133       WBS000073      A         WBA              6897             4.69%             24.87%       74.92%          5.41%
  3 SUB000456       WBS000073      SA WBA                     6476 4.41% 52.63%                               47.33%         3.94%
  4 DTA000057       WBS000094      A         DA               5708             3.88%             13.84%       86.05%          4.46%
  5 DTA000616       WBS000089      A         DA               4173             2.84%             10.54%       89.17%          3.32%
  6 SBA000439       WBS000219      A         SBA              3983             2.71%             14.06%       86.09%          3.46%
  7 DTA000616       WBS000092      A         DA               3738             2.54%              16.1%       83.52%          3.05%
  8 SBA000462       WBS000073      A         SBA              3693 2.51% 53.86%                               46.06%         2.64%
  9 SBA000263       WBS000072      A         SBA              3309 2.25% 75.49%                               24.51%         0.95%
 10 SBA000607       WBS000263      A         SBA              2827 1.92% 67.46%                               32.51%         1.55%
 11 SBA000729       WBS000101      A         SBA              2588             1.76%                4.1%      95.71%          1.54%
 12 SBA000659       WBS000128      A         SBA              2531             1.72%              11.5%       88.46%          1.36%
 13 WBA000058       WBS000073      A         WBA              2515 1.71% 68.23%                               31.77%         1.64%
 14 SUB000113       WBS000095      SA SBA                     2213 1.51% 53.55%                               46.41%         1.62%
 15 WBA000011       WBS000152      A         WBA              2112 1.44% 50.28%                               49.57%           1.5%
 16 WBA000144       WBS000318      A         WBA              2112 1.44% 46.78%                               53.22%         1.46%
 17 APP000005       WBS000292      A         C                1954             1.33%             24.31%       75.33%          1.48%
 18 SUB000424       WBS000073      SA WBA                     1936 1.32% 41.89%                               58.01%         1.52%
 19 SBA000017       WBS000099      A         SBA              1512 1.03% 47.09%                               52.71%         0.76%
 20 MON00015        WBS000091      D         M                1478             1.01%              8.66%       91.27%          1.17%
 21 SBA000659       WBS000255      A         SBA              1477             1,00%              7.92%       92.08%          0.81%

Legend: CI-Type: S = Storage; A = Application; SA = Subapplication, D = Displayservice, CI-
Subtype: SAN = SAN; WBA = Web Based Application; DA = Desktop Application; SBA =
Server Based Application; C = Citrix; M = Monitor

One can see that the bold written CIs in Table 17 lead to significantly more Incidents
than the others. Against that background, we call CIs which are responsible for more
than 1% of all Interactions and which lead to an Incident in more than 40% of all
cases Most Incident-Relevant Interaction CIs (MIRIC). The MIRICs are now deeper
analyzed concerning their impact to the whole Incident Management (Service Desk
and IT Operations) and their impact on the Change Management (see Figure 13).
Analysis of Most Incident-Relevant Interaction CIs (MIRICs)
                   (Interaction Ratio > 1% and Leading to Incident Ratio > 40%)
                               7000
                                                                           Fraction of Service Desk
                               6000
                                                                                  Workload: ~18%
                               5000
                                                                                        Fraction of IT
                               4000                                             Operations Workload:
   Cases

                                                                                               ~ %
                               3000
                               2000
                               1000
                                  0
                                       03     08     09     10     13     14     15     16     18     19
           #Interactions              6476   3693   3309   2827   2515   2213   2112   2112   1936   1512
           #IA => Incident            3408   1989   2498   1907   1716   1185   1062   988    811    712
           #Incidents                 3050   1698   2176   1743   1614   1100   945    909    744    669
           Affected CI != CausedBy CI 119     43     23    249     41    279     50     15     28    508

                   Figure 13: Analysis of Most Incident-Relevant Interactions
A first interesting result is that these 10 CIs are responsible for ~18% of the Service
Desk workload and ~21% of the IT Operations workload. The MIRICs also cover
31.51% of all Incidents coming from Interactions. Thus, one should derive the
conclusion that the MIRICs are of major importance to the Service Desk and IT
Operations and have high potentials for a positive impact of changes. At the same
time, one can see only little efforts in addressing the affected CIs of the MIRICs in
Change Management. 4 of the 10 MIRICs do not have any changes during the whole
observation period, 3 have less than 10 changes and the other 3 have 29, 35 and 52
changes respectively. Overall, these 133 changes cover only 0.44% of all changes,
which seems to be a value too low with a consideration of the relevance for the
Service Desk and IT Operations. To ensure the correctness of that result, we will
carry out a deeper analysis of these cases over time. Intuitively, there is no trend
observable concerning the occurrence of service cases at those CIs, wherefore no
changes are available. Figure 14 visualized that for CI 16; CI03, CI18 and CI19 look
quite similar. In contrast to the analysis above, we have taken here the case start point
instead of the case end into consideration, which is necessary in terms of impact
analysis.
   The following two figures visualize the occurrences of cases over time related to
the different other CIs, while the first figure shows one of the CIs with only changes
in the observation period and the second figure shows one of those CIs which have
more changes. The dotted lines represent the points of time, where a change was
done.
#Cases                                                                                                                                      #Cases                                                                                                                                        #Cases

                                                                                                                      0
                                                                                                                               100
                                                                                                                                     150
                                                                                                                                                                                                                                                                 0
                                                                                                                                                                                                                                                                          100
                                                                                                                                                                                                                                                                                150
                                                                                                                                                                                                                                                                                      200
                                                                                                                                                                                                                                                                                                                                                                                                                0
                                                                                                                                                                                                                                                                                                                                                                                                                         100
                                                                                                                                                                                                                                                                                                                                                                                                                               150

                                                                                                                          50
                                                                                                                                                                                                                                                                     50
                                                                                                                                                                                                                                                                                                                                                                                                                    50
                                                                                                            2013-41                                                                                                                                    2013-41                                                                                                                                        2013-41
                                                                                                            2013-42                                                                                                                                    2013-42                                                                                                                                        2013-42
                                                                                                            2013-43                                                                                                                                    2013-43                                                                                                                                        2013-43
                                                                                                            2013-44                                                                                                                                    2013-44                                                                                                                                        2013-44
                                                                                                            2013-45                                                                                                                                    2013-45                                                                                                                                        2013-45
                                                                                                            2013-46                                                                                                                                    2013-46                                                                                                                                        2013-46
                                                                                                            2013-47                                                                                                                                    2013-47                                                                                                                                        2013-47
                                                                                                            2013-48                                                                                                                                    2013-48                                                                                                                                        2013-48

                                                                                                                                                                                                                         CI13 Interactions
                                                                                                                                                                                                                                                                                                                                                                        CI16 Interactions
                                                                                                                                                                                                                                                       2013-49                                                                                                                                        2013-49

                                                                              CI15 Interactions
                                                                                                            2013-49
                                                                                                                                                                                                                                                       2013-50                                                                                                                                        2013-50
                                                                                                            2013-50
                                                                                                                                                                                                                                                       2013-51                                                                               CI16 Interactions to INC                                 2013-51

                                                                                                                                                                                              CI13 Interactions to INC
                                                                                                            2013-51

                                                   CI15 Interactions to INC
                                                                                                                                                                                                                                                       2013-52                                                                                                                                        2013-52
                                                                                                            2013-52
                                                                                                                                                                                                                                                       2014-01                                                                                                                                        2014-01
                                                                                                                                                                                                                                                                                                                                                                                               Week

                                                                                                                                                                                                                                                Week
                                                                                                            2014-01
                                                                                                                                                                                                                                                       2014-02                                                                                                                                        2014-02

                                                                                                     Week
                                                                                                            2014-02
                                                                                                                                                                                                                                                       2014-03                                                                                                                                        2014-03
                                                                                                            2014-03
                                                                                                                                                                                                                                                       2014-04                                                                                                                                        2014-04
                                                                                                            2014-04                                                                                                                                    2014-05                                                                                                                                        2014-05
                                                                                                            2014-05
                                                                                                                                                                                                                                                                                                                                             CI16 Incidents

                                                                                                                                                                                              CI13 Incidents
                                                                                                                                                                                                                                                       2014-06                                                                                                                                        2014-06

                                                   CI15 Incidents
                                                                                                            2014-06                                                                                                                                    2014-07                                                                                                                                        2014-07
                                                                                                                                                                                                                                                                                            Figure 14: MIRIC 16 case occurrences over time

                                                                                                                                           Figure 15: MIRIC 13 change impacts (affected CI)

Figure 16: MIRIC 15 change impacts (affected CI)
                                                                                                            2014-07

                                                                                                                                                                                                                         CI13 Interaction FCR
                                                                                                                                                                                                                                                                                                                                                                        CI16 Interaction FCR

                                                                                                                                                                                                                                                       2014-08                                                                                                                                        2014-08

                                                                              CI15 Interaction FCR
                                                                                                            2014-08                                                                                                                                    2014-09                                                                                                                                        2014-09
                                                                                                            2014-09                                                                                                                                    2014-10                                                                                                                                        2014-10
                                                                                                            2014-10                                                                                                                                    2014-11                                                                                                                                        2014-11
                                                                                                            2014-11                                                                                                                                    2014-12                                                                                                                                        2014-12
                                                                                                            2014-12                                                                                                                                    2014-13                                                                                                                                        2014-13
                                                                                                            2014-13
The case occurrence behavior of all considered CIs have tail at the year switch in
common, which is explicable by holiday time. Moreover, a trend, also at those CIs
where changes were conducted, is not observable. Since there is no detailed
information on what is done in particular changes, it is unclear whether that result is
the cause of inadequate changes or whether the changes are not related to the occurred
interactions and incidents. Since up to now, solely the affected CIs were taken into
account, it now also checked, whether the affected CIs are generally equal to the
CausedBy CIs at the corresponding Incidents (Figure 17).
                3500
                3000
                2500
   #Incidents

                2000
                1500
                1000
                 500
                   0
                       03       08     09     10     13     14     15     16     18   19
                                                    Affected CI

                       Affected CI = CausedBy CI        Affected CI != CausedBy CI

                            Figure 17: Affected CIs vs. CausedBy CIs at MIRICs
As a result, in 90.75% of all MIRIC Incidents, the affected CI is equal to the
CausedBy CI. Solely CI19 (CI-Name: SBA0000017, Service Component:
WBS000099) is a statistical outlier. Thus, the analysis shows, that itit would be
promising to invest more workload in changes concerning the MIRICs.

7 Central Findings and Recommendations

MIRIC Identification Approach. We developed an approach which allows the
identification of CIs, wherefore the analysis of change possibilities is very promising.
With the help of that approach, 10 MIRICs (Most Important Incident-Related CIs)
were identified, which are responsible for about 18% of the overall Service Desk
workload and for about 21% of the overall IT Operations workload. Against the
background of more than 10,000 supported CIs overall, these CIs have a significant
importance for the IT service management. It can also be observed that for 4 of these
MIRICs no changes exist. Moreover, the changes conducted to the other 6 MIRICs do
not have a relevant impact to the workload they cause.
   Since we do not have detailed information on what exactly these CIs are, we
strongly recommend analyzing them on a functional level. The provision of adequate
changes seems very promising in terms of reducing the workload of the Service Desk
and the IT Operations. A possible scenario may be password forgotten requests,
which can be avoided by providing a web form automating the processing of these
You can also read