Profiles of Monopoly: Big Cable and Telecom - By H. Trostle and Christopher Mitchell @CommunityNets - Institute for Local Self ...
←
→
Page content transcription
If your browser does not render page correctly, please read the page content below

Profiles of Monopoly:
            Big Cable and Telecom
                 By H. Trostle and Christopher Mitchell
                                     @CommunityNets

July 2018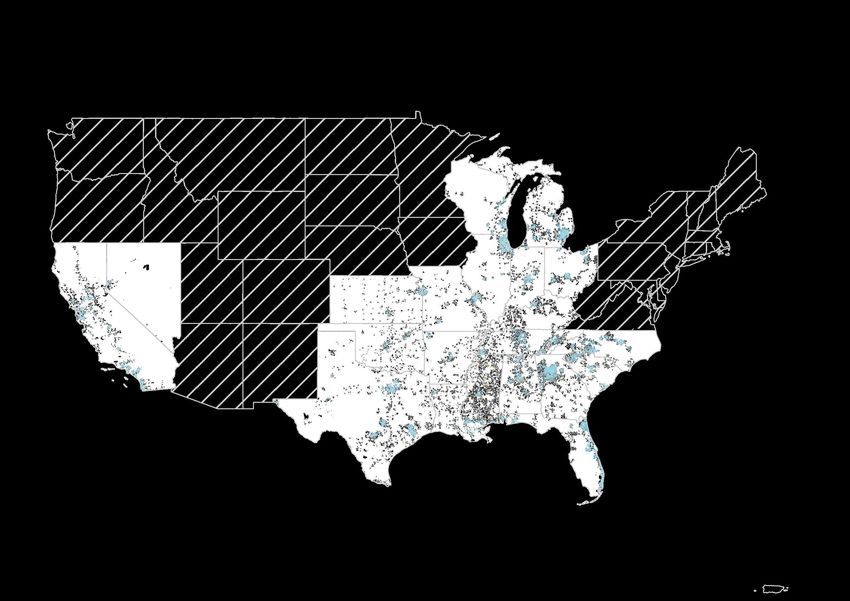
Table of Contents

Introduction ………..………………………1

  Comcast …..……………………………5

   Charter ..………………………………7

    AT&T ……………………………….9

   Verizon ………………………………13

CenturyLink ………………………………19

  Frontier……………………………….24

Conclusion ………………………………27

Appendices .……………………………..34
We wish to acknowledge those who reviewed and
                                                offered valuable feedback on this report including
                                                Miranda Adams - Minneapolis Community Organizer,
                                                Bill Coleman - Community Technology Advisors, Susan
                                                Crawford - Harvard Law School, Harold Feld - Public
                                                Knowledge, and Blair Levin - the Brookings Institution.

                                                Our colleagues at ILSR also provided crucial feedback
                                                and support—thank you to Christopher Barich, Hannah
                                                Bonestroo, Lisa Gonzalez, Hibba Meraay, David Morris,
                                                Hannah Rank, and Nick Stumo-Langer.

H. Trostle is a research associate with the Community Broadband Networks Initiative
at the Institute for Local SelfReliance in Minneapolis.

Christopher Mitchell is the Director of the Community Broadband Networks Initiative
at the Institute for Local Self-Reliance in Minneapolis.

Published by the Institute for Local Self-Reliance.
                   The Institute’s mission is to provide innovative strategies, working
                   models and timely information to support environmentally sound
                   and equitable community development. To this end, ILSR works                             If you find our work useful
                   with citizens, activists, policymakers and entrepreneurs to design                       and want to see more of it,
                   systems, policies and enterprises that meet local or regional                          please donate. ILSR is mostly
                   needs; to maximize human, material, natural and financial                               funded by individual donors
                   resources; and to ensure that the benefits of these systems and                             and foundation grants.
                   resources accrue to all local citizens.
For ongoing information about broadband policy, be sure to read
MuniNetworks.org and sign up for the weekly newsletter.
Listen to the podcast at MuniNetworks.org/BroadbandBits                                                         Contribute here:
                                                                                                             http://bit.ly/ilsr-donate

                                                                                                                                          1
Introduction
tend to be confused about their options. Even policymakers tasked
The market has spoken: The market is broken. This research sets the
with improving access lack basic information as to which service
stage to explore how national forces are at work in local
providers are in each geographic region.
communities. Nationally, cable companies maintain monopolies on
high-speed Internet access. The large telecommunication
In this report, we provide detailed information about broadband
companies, such as AT&T and Verizon, invest mainly where they face
competition by sifting through data on claimed broadband availability
cable competition.1 Admittedly, cable service is available to the vast
of six of the largest Internet Service Providers (ISPs) through a series
majority of Americans, in large part because of historic municipal
of maps. Two of the ISPs are cable companies: Comcast and Charter
franchise requirements for buildout. However, available data
(largest and second largest, respectively). The other four ISPs are the
suggests that government programs to encourage rural investment
four largest telecommunication companies, formerly telephone
from the biggest companies has generally failed whereas
companies (telcos): AT&T, CenturyLink, Frontier, and Verizon. We
cooperatives and smaller firms have thrived with fewer subsidies.
classify their broadband service areas and identify where each ISP
faces no competition in providing broadband speeds of 25 Megabits
This research began with the simple desire to explore where the
per second (Mbps) download and 3 Mbps upload, the Federal
largest providers offer service and how they have carefully minimized
Communications Commission’s (FCC) definition of broadband.2
head-to-head competition with each other, particularly when looking
solely at the cable companies or the telephone companies. We came
Charter and Comcast rely on coaxial cable to provide Internet
to believe others would find it helpful not just to see these territories
service. This type of network can offer fast downloads and
but also to include some basic facts, such as the number of
slow-to-moderate speed uploads — easily supporting broadband.
households with access to broadband as defined by the FCC or
The telcos, however, primarily use two types of technology: DSL and
basic revenues for the providers.
Fiber-to-the-Home (FTTH). DSL is based on copper telephone lines
and often cannot deliver broadband-level speeds, especially in rural
Monopolies and Broadband Internet Access areas. FTTH is considered the gold standard of high-speed Internet
service. It provides the most reliable connection and fastest
Millions of Americans still do not have a real choice when it comes to download and upload speeds, as well as the most robust upgrade
their Internet service. In urban areas, a thin majority can choose path. For that reason we also present corresponding maps of the four
between the monopoly cable company and the often slower telcos’ FTTH service areas.
monopoly phone company. In rural areas the situation is worse.
Residents and businesses are often lucky to have access to 2
Both the Obama and Trump administrations agree on the definition for the
high-quality Internet access at all. No matter where you go, people minimum threshold for“broadband.” For an in-depth discussion on the
changing definition of broadband, see BroadbandNow’s article (February
1
The term monopoly is used rigidly by some to mean a sole single seller but 2018) https://broadbandnow.com/report/fcc-broadband-definition/.
historically, and we believe more correctly, has been understood to mean See also, MuniNetworks’ article (May 2018)
companies that exert a large amount of market power. This definition was https://muninetworks.org/content/why-25-mbps-3-mbps-reasonable-minim
good enough for Milton Friedman and it is good enough for us. um-standard-2018.
1
The Data
Since 2015, the federal government has given the large telcos $1.5 Our primary source of information is the FCC Form 477 Data
billion in subsidies each year through the Connect America Fund to December 2016 v1. The FCC releases updates to this form every six
bring high-speed Internet service to rural areas. Large telcos only months. ISPs self-report this information to the FCC down to the
need to provide speeds of at least 10 Mbps (download) and 1 Mbps census block level. The result overestimates actual broadband
(upload) in order to receive the subsidy. availability and ISPs’ service areas.
Despite the Connect America Fund, the large providers have rarely Census blocks are the smallest unit of measurement in the U.S.
invested in next-generation services in areas where they do not face census, but they vary in both land area and population. An ISP may
competition. The telcos’ widespread, legacy DSL networks, classify a census block as served even if only one resident could
especially in rural areas, often do not support broadband service and, receive service.4 This methodology leads to an overstatement of
as such, the majority of their rural DSL networks rarely appear on broadband service available (see Figure 1). Competition is also
maps showing connections that meet the broadband definition. The overstated (see Figure 2).
Connect America Fund will continue to provide these subsidies
through 2020 but areas that have already received the basic We have deep hesitations about using this data because of its many
upgrades funded by it will need additional subsidies immediately to inaccuracies, but there is no other feasible option. In any event, this
avoid falling further behind. provides a conservative baseline for the problems in the market —
though we believe the true level of competition is worse than this
This demonstrates a key point: The largest telephone companies analysis shows, neither is tolerable in a country that claims to support
have far different incentives than smaller firms, whether private, a market-driven solution for supplying broadband Internet access.
cooperative, or public. Large firms appear to invest in modern
networks solely where they face competition and provide the Throughout this analysis, we include all fixed wireless Internet access
minimum allowable under subsidy programs elsewhere. Cooperatives providers (WISPs) that claim to offer 25 Mbps / 3 Mbps broadband
and municipal networks as well as locally owned private networks service as competitors to the cable and telecom companies. Fixed
tend to invest in longer-term, next-generation services that well wireless data, however, appears to be inaccurate at a higher rate than
exceed the minimum definition of broadband.3 Compare the fiber other technologies in this data set. WISPs are often smaller firms that
maps of the telcos in this report to the map in Appendix G of fiber have legitimate challenges in completing the unnecessarily complex
networks built by rural cooperatives. 4
“For this purpose, ‘broadband service’ is ‘available’ at an address if the
provider does, or could, within a typical service interval (7 to 10 business
3
Trostle and Mitchell, “Cooperatives Fiberize Rural America: A Trusted days) without an extraordinary commitment of resources, provision two-way
Model for the Internet Era,” Institute for Local Self-Reliance (November data transmission to and from the Internet with advertised speeds….”
2017) NTIA State Mapping NOFA, 74 Fed. Reg. at 32557 (July 7, 2009)
https://ilsr.org/the-fiber-future-is-cooperative-policy-brief-on-rural-cooperati https://www.ntia.doc.gov/files/ntia/publications/fr_broadbandmappingnofa_
ve-fiber-deployment/; and Lucey and Mitchell, “Successful Strategies for 090708.pdf.
Broadband Public-Private Partnerships,” Institute for Local Self-Reliance See also, FCC 2015 Broadband Progress Report, Footnote 137 (January
(July 2016) https://ilsr.org/ppp-fiber/. 2015) https://apps.fcc.gov/edocs_public/attachmatch/FCC-15-10A1.pdf.
2
and poorly managed FCC data collection process. The result is that
more than a few have claimed to offer faster speeds than what they
actually advertise.5 We, however, do include fixed wireless providers
because the FCC uses the fixed wireless broadband data in their
estimate of national terrestrial fixed broadband access.6 Additionally,
fixed wireless is often a superior option to DSL in rural regions and
even some urban areas.7
We do not include satellite service providers because the technology
is highly dependent on terrain and weather, has very poor latency,
and is often more expensive than terrestrial ISPs. Further,
households and businesses have unequivocally rejected satellite
Internet access where there is a single alternative. Unlike many cable
and telephone companies, satellite service bases pricing on both
speed and data usage, making it difficult to estimate monthly bills.8
Satellite service is also excluded by the FCC in the official estimates
of fixed broadband coverage published in the National Broadband
Deployment Progress reports.9
5
For instance, LTD Broadband misreported its advertised speeds to the
FCC near Rochester, Minnesota, in FCC Form 477 December 2016 v1. The
company stated that it offers speeds of 244 Mbps, but LTD Broadband only
advertises speeds up to 10 Mbps for $75 per month,
http://ltdbroadband.com/plans.html.
6
The FCC estimates that 92.3 percent of the population has access to fixed
terrestrial Internet service of 25 Mbps / 3 Mbps in the 2018 Broadband
Deployment Report,
https://www.fcc.gov/reports-research/reports/broadband-progress-reports/
2018-broadband-deployment-report.
7
Companies like NetBlazr in Boston and Monkey Brains in San Francisco,
for instance.
8
Minnesota Rural Broadband Coalition, “Understanding Satellite: The Figure 2: Diagram of FCC Broadband Data Competition Overstatement
Technology and Pricing,” http://mnbroadbandcoalition.com/?page_id=464.
9
The FCC did calculate that 95.6 percent of the population would have fixed 9
The FCC did calculate that 95.6 percent of the population would have fixed
broadband access if the FCC were to count satellite data in the 2018 broadband access if the FCC were to count satellite data in the 2018
Broadband Deployment Report. The BroadbandNow Team explains why Broadband Deployment Report. The BroadbandNow Team explains why this
this is a bad idea. BroadbandNow.com, “FCC Concludes Satellite Internet Is is a bad idea. BroadbandNow.com, “FCC Concludes Satellite Internet Is
Good Enough for Rural Broadband,” Good Enough for Rural Broadband,”
https://broadbandnow.com/report/satellite-internet-good-enough-rural-broa https://broadbandnow.com/report/satellite-internet-good-enough-rural-broa
dband/. dband/.
3
Cable
Profiles

           4
Comcast Xfinity
Comcast receives no federal Connect America Fund subsidies but
Comcast is the largest residential ISP and also the largest cable
has received subsidies from some states, like Vermont and
company in the U.S. Approximately 110 million people in 39 states
Massachusetts.14
live in Comcast’s residential Xfinity Internet service area.10 All of these
people have access to broadband-level service through Comcast
Xfinity, but about 30 million of these people have no other option for
broadband service.11
Per Comcast, approximately 25.5 million households, or about 64.8
million people, subscribe to Comcast’s Internet service (average U.S.
household is 2.54 people).12 These households may not actually
subscribe to broadband speeds because that service tier may be
unaffordable.
According to Comcast’s 2017 fourth quarter results, revenue from
this Internet division was $3.8 billion, and capital expenditure for the
entire company was about $2.1 billion. Annual revenue from the
Internet division was approximately $14.8 billion, and the annual
capital expenditure was about $8 billion in 2017.13
10
110 million according to the US 2010 Census . Current estimates in 2018
are 111.2 million from BroadbandNow.com, XFINITY by Comcast,
https://broadbandnow.com/XFINITY.
11
There are some exceptions - for instance apartment buildings that do not
allow Comcast to offer services are included in this number because of the
problems previously discussed in the data set.
12
Comcast 4th Quarter Results 2017,
https://www.cmcsa.com/news-releases/news-release-details/comcast-repo
rts-4th-quarter-and-year-end-2017-results.
14
Woodward, “State to pay Comcast $4m to build out rural broadband,”
Statista, Average Household Size, Boston Globe (August 2016)
https://www.bostonglobe.com/business/2016/08/22/state-pay-comcast-for-
https://www.statista.com/statistics/183648/average-size-of-households-in-t
more-rural-broadband/Zb8bqq5qGlpKfQ0RErgDHM/story.html;
he-us/. and Edwards, “Grants help fund ‘last mile’ of Vermont broadband,” Rutland
13
Comcast 4th Quarter Results 2017, Herald (March 2014)
https://www.cmcsa.com/news-releases/news-release-details/comcast-repo https://www.rutlandherald.com/articles/grants-help-fund-last-mile-of-vermo
rts-4th-quarter-and-year-end-2017-results. nt-broadband/.
5
Read the full     at:
                                                                                                                             ILSR.org/Monopoly-Networks
30 million people only have access to broadband
(25 Mbps / 3 Mbps) through Comcast finity
                                                                                            Internet customers: 25.5 million households ( 64.8 million people)
                                                                                            2017 fourth quarter revenue from Internet division: $3.8 billion

                                                                                                                                    Broadband Monopoly
                                                                                                                                    30 million people only
                                                                                                                                       have access to
                                                                                                                                     broadband through
                                                                                                                                       Comcast finity

                                                                                                                                  Broadband Competition
                                                                                                                                    80 million people have
                                                                                                                                     access to broadband
                                                                                                                                  from Comcast finity and
                                                                                                                                  at least one other provider

                                                                       Comcast does not offer finity service in Alaska, Hawaii, Iowa, Montana, Nebraska,
                                                                       Nevada, North Dakota, Oklahoma, Rhode Island, South Dakota, or yoming

Design: H. Trostle, Institute for Local Self-Reliance
Source: FCC Form 477 December 2016 v 1; Comcast 4th Quarter Results 20176                                                     MuniNetworks.org                  6
This is a best-case scenario. FCC Form 477 data overstates broadband availability and competition.
Charter Spectrum
Charter is the 2nd largest cable company in the U.S. Approximately in 2016. Charter has not met the state’s broadband expansion
101 million people in 45 states can subscribe to Charter Spectrum goals.19 As this report goes to press, Charter has about 60 days to
residential Internet service.15 All of these people people have access present a transition plan.20
to broadband-level service through Charter Spectrum.16 About 38
million have no other option for broadband service.
According to Charter, approximately 22.5 million households, or
about 57.2 million people, subscribe to Charter Spectrum Internet
service (average U.S. household size is 2.54 people).17
According to Charter’s 2017 fourth quarter results, revenue from the
Internet division was $3.6 billion and capital expenditure for the entire
company was about $2.6 billion. Annual revenue from the Internet
division was approximately $14.1 billion, and the annual capital
expenditure was about $8.7 billion in 2017.18
Charter receives no federal Connect America Fund subsidies.
As of July 2018, Charter is under orders from the State of New York
to sell the Time Warner Cable system which the company had bought
15
101 million according to the US 2010 census. Current estimates in 2018
are 101.5 million from BroadbandNow.com Charter Communications,
https://broadbandnow.com/Charter-Communications.
16
There are some exceptions - for instance apartment buildings that do not
allow Charter to offer services are included in this number because of the
problems previously discussed in the data set.
17
Charter 4th Quarter Results 2017,
http://ir.charter.com/phoenix.zhtml?c=112298&p=irol-newsArticle&ID=2330
19
Brodkin, “NY orders Charter out of state, says it must sell Time Warner
071. Cable system,” Ars Technica (July 2018)
Statista, Average Household Size, https://arstechnica.com/tech-policy/2018/07/new-york-revokes-approval-of
-chartertime-warner-cable-merger/?amp=1
https://www.statista.com/statistics/183648/average-size-of-households-in-t 20
Fung, “New York moves to break up Charter’s merger with Time Warner
he-us/. Cable,” Washington Post (July 2018)
18
Charter 4th Quarter Results 2017, https://www.washingtonpost.com/technology/2018/07/27/new-york-moves-
http://ir.charter.com/phoenix.zhtml?c=112298&p=irol-newsArticle&ID=2330 break-up-charters-merger-with-time-warner-cable/?utm_term=.92cf46ed34
071. 38
7Read the full at:
Charter’s Captured Customers ILSR.org/Monopoly-Networks
38 million people only have access to broadband
(25 Mbps / 3 Mbps) through Charter Spectrum
Internet customers: 22.5 million households (57.2 million people)
2017 fourth quarter revenue from Internet division: $3.6 billion
Broadband Monopoly
38 million people only have
access to broadband
through Charter Spectrum
Broadband Competition
63 million people have
access to broadband from
Charter Spectrum and at
least one other provider
Charter does not offer Spectrum service in North Dakota, South Dakota, Iowa,
Oklahoma, Arkansas, Utah, or Alaska
Design: H. Trostle, Institute for Local Self-Reliance
Source: FCC Form 477 December 2016 v 1; Charter 4th Quarter Results 2017 8 MuniNetworks.org 8
This is a best-case scenario. FCC Form 477 data overstates broadband availability and competition.9
AT&T
AT&T is the largest telecommunications provider in the world and the According to AT&T’s 2017 fourth quarter results, revenue from the
largest DSL provider in the U.S. AT&T has also invested in FTTH, Internet division was $1.9 billion and capital expenditure for the entire
almost entirely in urban areas. This analysis does not include any of company, including video and wireless, was $5.1 billion. Annual
AT&T’s wireless customers. revenue from the Internet division was approximately $7.6 billion, and
the annual capital expenditure for the entire company was about
AT&T claims 122.5 million people in 21 states can subscribe to $21.6 billion in 2017.24
AT&T’s residential Internet service.21 The DSL service area covers
119.9 million people, but the FTTH service area covers 7.8 million Through the Connect America Fund, AT&T receives $427.7 million
people; these service areas overlap. each year from 2015 to 2020 to serve 1.1 million homes and
businesses.25 That is $2.5 billion total. In order to receive this
About 53.7 percent of people (65.8 million) in the total service area subsidy, AT&T only needs to provide download speeds of 10 Mbps
have access to broadband-level service through AT&T.22 Of these and upload speeds of 1 Mbps — far less than broadband service.
people, at least 745 thousand have no other other option for AT&T’s Internet service subsidized by the Connect America Fund
broadband service. The data suggests that AT&T has almost service is quite costly with monthly bandwidth caps.26
exclusively upgraded its networks to offer broadband-level service
only in areas where it faces competition.
Approximately 15.7 million households, or about 39.9 million people,
subscribe to Internet service from AT&T (average U.S. household size
is 2.54 people) .23 These households may not actually subscribe to
broadband speeds because that speed tier may be unavailable at
their address or it may be unaffordable.
21
122.5 million according to the US 2010 census. Current estimates in 2018
are 119.9 million from BroadbandNow.com, AT&T,
https://broadbandnow.com/ATT. 24
AT&T is also currently building FirstNet, a network a network which will
22
There are some exceptions - for instance apartment buildings that do not
provide dedicated connectivity for police officers, firefighters, and
allow AT&T to offer services are included in this number because of the
emergency medical services. AT&T 4th Quarter Results 2017,
problems previously discussed in the data set.
https://investors.att.com/financial-reports/quarterly-earnings/2017.
23
AT&T 4th Quarter Results 2017,
https://investors.att.com/financial-reports/quarterly-earnings/2017.
25
FCC Connect America Fund Phase II Funding Carrier State County,
https://www.fcc.gov/document/connect-america-fund-phase-ii-funding-carr
And Statista, Average Household Size,
ier-state-and-county.
https://www.statista.com/statistics/183648/average-size-of-households-in-t 26
Dawson, “AT&T’s CAF II Data Caps,” Pots And Pans by CCG Consulting,
he-us/. (July 2017)
https://potsandpansbyccg.com/2017/07/13/atts-caf-ii-data-caps/.
10Read the full at:
ILSR.org/Monopoly-Networks
AT T has a widespread DSL network, but many of these DSL customers
cannot get broadband (25 Mbps / 3 Mbps).
Internet customers: 15.7 million households ( 3 . million people)
2017 fourth quarter revenue Internet division: $1. billion
- No Broadband
62 million people o no
e o n e
i om *
Broadband Monopoly
745 thousand people only
have access to broadband
through AT T
Broadband Competition
65.8 million people have
access to broadband from
AT T and at least one
other provider
AT T does not offer Internet service in Alaska, Ari ona, Colorado, Connecticut, Delaware,
D.C., Hawaii, Idaho, Iowa, Maine, Maryland, Massachusetts, Minnesota, Montana, Nebraska,
New Hampshire, New ersey, New Me ico, New ork, North Dakota, Oregon, ennsylvania,
Rhode Island, South Dakota, Utah, ermont, irginia, ashington, est irginia, or yoming
* million people in o l e e o
Design: H. Trostle, Institute for Local Self-Reliance
Source: FCC Form 477 December 2016 v 1; AT T 4th Quarter Results 2017 11 MuniNetworks.org 11
This is a best-case scenario. FCC Form 477 data overstates broadband availability and competition.’s road a d er to the ome
12 1213
Verizon
Verizon is the 3rd largest DSL provider in the U.S. and has heavily from the Internet division was approximately $11.7 billion, and the
invested in its FTTH FiOS throughout its service area and in areas it annual capital expenditure was about $5.3 billion.36
has since sold off to Frontier. This analysis does not include any of
Verizon’s wireless customers. Verizon turned down most Connect America Fund dollars in 2012
and 2015. The areas where Verizon did accept funding, the company
Verizon has reported that approximately 55.2 million people in 9 sold to Frontier and passed along the Connect America Fund money
states and D.C. can subscribe to Verizon’s Internet service.33 The DSL to Frontier. Verizon has been in the process of selling much of its
service area covers 47.7 million people, but the FTTH service area rural wireline network to competitors.37
covers 33.3 million people; these service areas overlap.
About 60.7 percent of people (33.5 million) in the total service area
have access to broadband-level service through Verizon.34
Approximately 185 thousand people have no other option for
broadband service. This means that FiOS has almost exclusively
been deployed to areas where it faces cable competition.
Of that population, 7 million households, or about 17.8 million people,
subscribe to Internet service from Verizon (average U.S. household
size is 2.54 people).35 These households may not actually subscribe
to broadband speeds because that speed tier may be unavailable at
their address or it may be unaffordable.
According to Verizon’s 2017 fourth quarter results, revenue from the
FIOS division was $2.9 billion and the capital expenditure for the
FIOS division was about $2 billion. In total in 2017, annual revenue
33
55.2 million according to the US 2010 census. Current estimates in 2018
are 47.7 million from BroadbandNow.com, Verizon High Speed Internet,
https://broadbandnow.com/Verizon-High-Speed-Internet. 36
Verizon 4th Quarter Results 2017,
34
There are some exceptions - for instance apartment buildings that do not http://www.verizon.com/about/investors/quarterly-reports/4q-2017-quarter-
allow Verizon to offer services are included in this number because of the earnings-conference-call-webcast.
problems previously discussed in the data set. 37
Buckley, “Verizon passes on $144M in CAF II funding as wireline asset
35
Verizon 4th Quarter Results 2017, sale rumors swirl,” Fierce Telecom, (August 2015)
http://www.verizon.com/about/investors/quarterly-reports/4q-2017-quarter- https://www.fiercetelecom.com/telecom/verizon-passes-144m-caf-ii-fundin
earnings-conference-call-webcast. g-as-wireline-asset-sale-rumors-swirl.
14er o ’s Captured Customers Read the full at:
eri on sold off much of its wireline network to competitors, such as ILSR.org/Monopoly-Networks
Frontier. Many of eri on s DSL customers cannot get broadband (25
Mbps / 3 Mbps).
Internet customers: 7 million households ( 17.8 million people)
2017 fourth quarter revenue from eri on FIOS division: $2. billion
- No Broadband
million people o no
e o n e
i om e i on*
Broadband Monopoly
185 thousand people only
have access to broadband
through eri on
Broadband Competition
33.5 million people have
access to broadband from
eri on and at least one
other provider
eri on offers service in Connecticut, Delaware, D.C., Massachusetts,
Maryland, New ork, New ersey, ennsylvania, Rhode Island, and irginia.
* million people in o l e e o e i on
Design: H. Trostle, Institute for Local Self-Reliance
Source: FCC Form 477 December 2016 v 1; eri on 4th Quarter Results 2017 19 MuniNetworks.org 15
This is a best-case scenario. FCC Form 477 data overstates broadband availability and competition.Read the full at:
er o ’s road a d er to the ome ILSR.org/Monopoly-Networks
roadband (25 Mbps/ 3 Mbps) is only available from eri on on its Fiber-to-the-Home network.
iber to t e ome
service is available to
33.3 million people
eri on offers service in Connecticut, Delaware, D.C., Massachusetts,
Maryland, New ork, New ersey, ennsylvania, Rhode Island, and irginia
Design: H. Trostle, Institute for Local Self-Reliance
Source: FCC Form 477 December 2016 v 1 20 MuniNetworks.org 16
This is a best-case scenario. FCC Form 477 data overstates fiber availability.- No Broadband
million people o
no e o n
e i om
e i on*
eri on offers service in Connecticut, Delaware, D.C., Massachusetts,
Maryland, New ork, New ersey, ennsylvania, Rhode Island, and irginia.
* million people in o l e e o e i on
21 17New York City is pursuing action against Verizon.
Verizon was supposed to deploy FTTH throughout
the city by 2014. Many in the city, however, remain
without access to this service. Verizon places the
blame on landlords: apartment buildings require
landlord permission to install fiber. New York City
filed suit in 2017. The case is pending.
Read more on Ars Technica:
18
1819
CenturyLink
CenturyLink is the 2nd largest DSL provider in the U.S. and has also According to CenturyLink’s 2017 fourth quarter results, revenue from
invested in FTTH, mainly in urban areas. CenturyLink’s Internet division was $1.4 billion and capital
expenditure for the entire company was $528 million. Annual revenue
According to CenturyLink, roughly 49.1 million people in 39 states from the Internet division was approximately $5.7 billion, and the
can subscribe to CenturyLink’s Internet service.27 The DSL service annual capital expenditure was about $2.9 billion in 2017.31
area covers 48.4 million people, but the FTTH service area covers 3.8
million people; these service areas overlap. Through the Connect America Fund, CenturyLink receives $505.7
million each year from 2015 to 2020 to serve 1.1 million homes and
About 47.9 percent of people (23.5 million) in the total service area businesses.32 That is $3 billion total. In order to receive this subsidy,
have access to broadband-level service through CenturyLink28 and CenturyLink only needs to provide download speeds of 10 Mbps and
approximately 1 million people have no other option for broadband upload speeds of 1 Mbps — far less than broadband service.
service. Of the 4 biggest telcos, CenturyLink has the most potential
customers that have no other broadband choice, meaning it has
invested more in areas without competition, but not by much.
Of that population, 5 million households, or about 12.7 million people,
subscribe to Internet service from CenturyLink (average U.S.
household size is 2.54 people).29 These households may not actually
subscribe to broadband speeds because that speed tier may be
unavailable at their address or it may be unaffordable.
In early 2018, CenturyLink’s CFO announced that it would focus less
on rural investment to focus on enterprise and urban markets.30
27
49.1 million according to the US 2010 census. Current estimates in 2018
are 48.4 million from BroadbandNow.com, CenturyLink,
https://broadbandnow.com/CenturyLink.
28
There are some exceptions - for instance apartment buildings that do not
allow CenturyLink to offer services are included in this number because of
the problems previously discussed in the data set.
29
CenturyLink 4th Quarter Results 2017, https://www.fiercetelecom.com/telecom/centurylink-s-patel-broadband-exp
http://ir.centurylink.com/quarterly-results. ansion-will-focus-higher-speeds-dense-areas
And Statista, Average Household Size,
31
CenturyLink 4th Quarter Results 2017,
https://www.statista.com/statistics/183648/average-size-of-households-in-t http://ir.centurylink.com/quarterly-results.
he-us/. 32
FCC Connect America Fund Phase II Funding Carrier State County,
30
Buckley, “CenturyLink's Patel: Broadband expansion will focus on higher https://www.fcc.gov/document/connect-america-fund-phase-ii-funding-carr
speeds, dense areas,” Fierce Telecom (January 2018) ier-state-and-county.
20o o n
2 million people o no
e o n e i
om en in *
* million people in o l e e o en in
en in e e l 2 21Read the full at:
Ce tur ’s road a d er to the ome ILSR.org/Monopoly-Networks
CenturyLink primarily invests in Fiber-to-the-Home in urban areas.
iber to t e ome
service is available to
3.8 million people
CenturyLink does not offer service in Alaska, Hawaii, entucky, Maine,
Massachusetts, Maryland, New ork, New Hampshire, New ersey, Oklahoma,
Rhode Island, ermont, or est irginia
Design: H. Trostle, Institute for Local Self-Reliance
Source: FCC Form 477 December 2016 v 1 16 MuniNetworks.org 22
This is a best-case scenario. FCC Form 477 data overstates fiber availability.23
Frontier
Frontier is the 4th largest DSL provider in the U.S. Frontier has some was approximately $4.5 billion, and the annual capital expenditure
FTTH in urban areas, mostly due to its FiOS acquisition from Verizon. was about $1.2 billion in 2017.41
Per Frontier, approximately 32.6 million people in 29 states can Through the Connect America Fund, Frontier receives $238.4 million
subscribe to Frontier’s Internet service.38 The DSL service area each year from 2015 to 2020 to serve about 660 thousand homes
covers 30 million, but the FTTH service area covers 10 million; these and businesses.42 That is $1.4 billion total. In order to receive this
service areas overlap. subsidy, Frontier only needs to provide download speeds of 10 Mbps
and upload speeds of 1 Mbps — far less than broadband service.
About 38.7 percent of people (12.6 million) in this service area have
access to broadband-level service through Frontier.39 Approximately
59 thousand people have no other option for broadband service.
These data suggest that Frontier has invested in faster services
almost solely where it faces competition and not in more rural areas.
Approximately 3.9 million households, or about 9.9 million people,
subscribe to Internet service from Frontier (average U.S. household
size is 2.54 people) .40 These households may not actually subscribe
to broadband speeds because that speed tier may be unavailable at
their address or it may be unaffordable.
According to the 2017 fourth quarter results, revenue from the
Internet division was $1 billion and capital expenditure for the entire
company was $308 million. Annual revenue from the Internet division
38
32.6 million according to the US 2010 census. Current estimates in 2018
are 30 million from BroadbandNow.com, Frontier Communications,
https://broadbandnow.com/Frontier-Communications.
39
There are some exceptions - for instance apartment buildings that do not
allow Frontier to offer services are included in this number because of the
problems previously discussed in the data set.
40
Frontier 4th Quarter Results 2017,
41
Frontier 4th Quarter Results 2017,
http://investor.frontier.com/financial-information. http://investor.frontier.com/financial-information.
42
And Statista, Average Household Size, CC Connect America Fund Phase II Funding Carrier State County,
F
https://www.statista.com/statistics/183648/average-size-of-households-in-t https://www.fcc.gov/document/connect-america-fund-phase-ii-funding-carr
he-us/. ier-state-and-county.
24Read the full epo at:
ro t er’s Captured Customers ILSR.org/Monopoly-Networks
Frontier has a widespread DSL network, but many of these DSL customers
cannot get broadband (25 Mbps / 3 Mbps).
Internet customers: 3. million households ( . million people)
2017 fourth quarter revenue from consumer division: $1 billion
- No Broadband
20 million people o no
have access to o n
i DSL om on ie *
Broadband Monopoly
5 thousand people only
have access to broadband
through Frontier
Broadband Competition
12.5 million people have
access to broadband from
Frontier and at least one
other provider
Frontier does not offer service in Alaska, Arkansas, Colorado, Delaware, D.C., Hawaii,
ansas, entucky, Louisiana, Maine, Maryland, Massachusetts, Missouri, New
Hampshire, New ersey, North Dakota, Oklahoma, Rhode Island, South Dakota,
ermont, irginia, or yoming
* million people in o l e e o on ie
Design: H. Trostle, Institute for Local Self-Reliance
Source: FCC Form 477 December 2016 v 1; Frontier 4th Quarter Results 2017 25 MuniNetworks.org 25
This is a best-case scenario. FCC Form 477 data overstates broadband availability and competition.Read the full at:
ILSR.org/Monopoly-Networks
Frontier bought most of its fiber networks from eri on.
iber to t e ome
service is available to
10 million people
Frontier does not offer service in Alaska, Arkansas, Colorado, Delaware, D.C., Hawaii,
ansas, entucky, Louisiana, Maine, Maryland, Massachusetts, Missouri, New Hampshire,
New ersey, North Dakota, Oklahoma, Rhode Island, South Dakota, ermont, irginia, or
yoming
Design: H. Trostle, Institute for Local Self-Reliance
Source: FCC Form 477 December 2016 v 1 26 MuniNetworks.org 26
This is a best-case scenario. FCC Form 477 data overstates fiber availability.Conclusion
The broadband market is broken. Comcast and Charter maintain a These are our key findings with potential for more research:
monopoly over 68 million people. Some 48 million households (about
● Real Competition Drives Investment
122 million people) subscribe to these cable companies, whereas the
The telecom companies have invested in Fiber-to-the-Home
four largest telecom companies combined have far fewer subscribers
in areas where they face competition, which are generally
— only 31.6 million households (about 80.3 million people). The big
more urban areas. The advent of Google Fiber in 2011 further
telecom companies have largely abandoned rural america — their
increased the competition in urban markets.43 Efforts to
DSL networks overwhelmingly do not support broadband speeds —
increase investment from the largest firms in more rural areas
despite years of federal subsidies and many state grant programs.
have largely failed. Though states have varied regulations, the
same trend results in every state — investment by the large
Large ISPs’ Broadband Monopoly and Competition
ISPs is correlated to competition rather than the regulatory
environment. This reality does not suggest that competition
between a cable monopoly and a telephone monopoly is
sufficient for high-quality Internet access, but it clearly helps
to ensure connections at the minimum definition of
broadband.
● Big Cable Companies Dominate
These networks are capable of delivering high-speed
broadband to everyone within their service area, a legacy of
the local franchising requirements that often required
universal service or at least service to all areas with a
specified density of housing.44 More than half of the states
have since removed local authority to negotiate such
43
Google Fiber is available in several cities, including Kansas City, Missouri;
Nashville, Tennessee; and Austin, Texas. https://fiber.google.com/newcities/
See also, Karsten and West, “Google Fiber, Competition, and Broadband for
All,” Brookings.edu (March 2016)
https://www.brookings.edu/blog/techtank/2016/03/22/google-fiber-competi
tion-and-affordable-broadband-for-all/.
44
These cable networks are much better at providing high-speed
downloads than uploads, but speeds in both directions tend to far
greater than those available from DSL.
27provisions but they bear some responsibility for the
far-reaching cable networks. The big four phone companies offer FTTH service to some areas of
some urban areas, but only FiOS (some still owned by Verizon, some
● Big Cable and Telecom Focus on Urban Markets sold to Frontier) approaches ubiquitous coverage of some
The big cable and telecom companies fight over urban communities. Future research should focus on where within each city
customers, not rural customers. About 98 percent of the these large providers have brought Fiber-to-the-Home service. The
urban population (254 million people) have access to 2017 report, “AT&T’s Digital Divide in California” from the Haas
broadband.45 About 5 million urban residents, however, Institute for a Fair and Inclusive Society at UC Berkeley offers a
remain without broadband access. In rural areas, only 69 model for this investigation, highlighting how AT&T has invested in
percent of the population (43.6 million people) have Fiber-to-the-Home in mostly higher-income neighborhoods
broadband access, leaving 19.3 million rural residents without throughout California while leaving the low-income communities on
high-speed Internet access. slow DSL.46
Moving Forward Furthermore, this research on the big telcos highlights the failed
strategy of the Connect America Fund. Some articles and small
These profiles in our report show the tremendous influence the large studies have begun to examine whether the Connect America Fund is
telecom and cable companies have in the broadband market. The improving Internet access to a reasonable level. See the recent report
visuals and maps explore each company’s reach and offer some from Blandin Foundation: “Impact of CAF II-funded Networks:
clues as to how national policies have an impact on local broadband Lessons From Two Rural Exchanges Left Underserved.”47 We predict
markets. the vast majority of households touched by the Connect America
Fund will rapidly need another large subsidy to achieve high-quality
Public data on broadband deployment in the U.S. is deeply flawed Internet access.
and may push policymakers to misunderstand the true problems in
broadband access across the nation. We are torn as to whether the Rural areas may do better to look elsewhere for improved broadband
Form 477 data is even worth collecting given the challenge smaller service. Our 2017 policy brief, “Cooperatives Fiberize Rural America:
providers face in completing the paperwork. We can only imagine the A Trusted Model for the Internet Era,” explores the role of electric and
frustration small ISPs must have in paying these compliance costs to telephone cooperatives in providing broadband service.48 Small
produce such flawed data. With modern technology, it should be
trivial to develop a process that is easy for ISPs to use and less likely 46
Strain, Moore, and Gambhir, “AT&T’s Digital Divide in California: An
for monopoly ISPs to game, but we have not found a single person Analysis of AT&T Fiber Deployment and Wireline Broadband Speeds in
California,” (2017)
with deep knowledge of the FCC that believes it will happen in the https://haasinstitute.berkeley.edu/atts-digital-divide-california.
near future. We would love to see a talented group of programmers 47
Coleman, “Impact of CAF II-funded Networks: Lessons From Two Rural
develop a solution to shame the FCC into improving its process. Exchanges Left Underserved,” Blandin Foundation, (June 2018)
https://blandinfoundation.org/content/uploads/Impact-of-CAF-II-funded-Net
FCC 2018 Broadband Deployment Report, Appendix D, (February 2018)
45
works_WEB.pdf.
https://www.fcc.gov/reports-research/reports/broadband-progress-reports/ 48
Trostle and Mitchell, Cooperatives Fiberize Rural America: A Trusted
2018-broadband-deployment-report. Model for the Internet Era,” Institute for Local Self-Reliance, (November
28towns may need to look to their city councils or municipal electric disconnect from a FTTH network, due to state lawmakers’ alliance
utilities to explore ways of improving high-speed Internet service. with the cable industry.52
Many cities and small towns across the U.S. have already improved The fact is, the large providers, such as Comcast and AT&T, have not
their communities’ Internet service options by building their own answered the digital divide. Communities must find their own way,
networks. This new competition can encourage the incumbent whether be working in partnership with local ISPs, cooperatives, or
provider, whether a cable or telecom company, to offer better service building their own community networks.
and rates. A 2017 Pew Research Center report found that 70 percent
of the public believe that local governments should be able to invest
in better Internet infrastructure.49 About 20 states, however, have
erected barriers to these municipally owned networks.50
These preemption laws have been on the books for many years, but
have only served to discourage investment by preventing
competition. Residents in Colorado must vote in a referendum before
their city council can build a municipal network. Almost 120 Colorado
communities have already voted to enable their city councils to
explore all the options for better Internet service.51 North Carolina’s
ban on municipal networks is forcing at least one small town to
2017)
https://ilsr.org/the-fiber-future-is-cooperative-policy-brief-on-rural-cooperati
ve-fiber-deployment/.
49
Olmstead, Anderson, and Horrigan, “Americans have mixed views on
policies encouraging broadband adoption,” Pew Research Center (April
2017)
http://www.pewresearch.org/fact-tank/2017/04/10/americans-have-mixed-v
iews-on-policies-encouraging-broadband-adoption/
50
Baller, Stokes, and Lide, “State restrictions on community broadband
services or other public communications initiatives,” Baller Stokes & Lide
(January 2018)
http://www.baller.com/wp-content/uploads/BallerStokesLideStateBarriers1-
1-18.pdf
51
The law is called SB 152, and many communities vote each year to
restore local authority. “SB 152,” MuniNetworks.org 52
For more on Pinetops, North Carolina, read the MuniNetworks coverage,
https://muninetworks.org/tags/tags/sb-152. “Pinetops,” MuniNetworks.org https://muninetworks.org/tags/tags/pinetops.
29Resources Sources
MuniNetworks AT&T 4th Quarter Results 2017.
The Institute for Local Self-Reliance’s Community Broadband https://investors.att.com/financial-reports/quarterly-earnings/2017
Initiative creates a daily digest of stories on locally rooted, community
networks across the country. The Initiative also produces fact sheets, Baller, Stokes, and Lide. “State restrictions on community broadband
videos, and policy briefs on the community network movement. services or other public communications initiatives.” Baller Stokes &
Lide (January 2018)
MuniNetworks.org
http://www.baller.com/wp-content/uploads/BallerStokesLideStateBar
riers1-1-18.pdf
Next Century Cities
185 cities are members of this organization that advocates for better Berg. “U.S. Urban Population is Up… But What Does Urban Really
Internet service and affordable solutions. NextCenturyCities.org Mean?” CityLab. (March 2012)
https://www.citylab.com/equity/2012/03/us-urban-population-what-d
Coalition for Local Internet Choice oes-urban-really-mean/1589/
This collaboration of public and private organizations promotes local
authority in improving connectivity. LocalNetChoice.org BroadbandNow.com. “FCC Broadband Definition Has Changed
Before and Will Change Again” (February 2018)
Open Technology Institute https://broadbandnow.com/report/fcc-broadband-definition/
The New America Foundation’s Open Technology Institute considers
the intersection of technology, policy, and research. BroadbandNow.com. “FCC Concludes Satellite Internet Is Good
NewAmerica.org/OTI/ Enough for Rural Broadband.”
https://broadbandnow.com/report/satellite-internet-good-enough-rur
Fiber Film Fest al-broadband/
This curated collection of videos and documentaries explores issues
BroadbandNow.com. Overview of ISPs.
related to Internet access and community networks. It features
AT&T.
Dividing Lines, a
four-part documentary series by Maria Smith, and
https://broadbandnow.com/ATT
“Do Not Pass Go” from Hyrax Films, a short film by Cullen Hoback. CenturyLink.
FiberFilmFestival.com/ https://broadbandnow.com/CenturyLink
Charter Communications.
Broadband Communities https://broadbandnow.com/Charter-Communications
This organization produces the Broadband Communities Magazine, Frontier Communications.
and hosts conferences on key issues, such as economic https://broadbandnow.com/Frontier-Communications
development. http://www.bbpmag.com/ Verizon High Speed Internet.
https://broadbandnow.com/Verizon-High-Speed-Internet
Verizon FIOS.
https://broadbandnow.com/Verizon-Fios
30XFINITY by Comcast. Dawson. “AT&T’s CAF II Data Caps.” Pots And Pans by CCG
https://broadbandnow.com/XFINITY Consulting. (July 2017)
https://potsandpansbyccg.com/2017/07/13/atts-caf-ii-data-caps/
Brodkin. “NYC blasts broadband competition shortage as it pursues
suit against Verizon.” Ars Technica. (April 2018)
Edwards. “Grants help fund ‘last mile’ of Vermont broadband.”
https://arstechnica.com/information-technology/2018/04/nyc-blasts-
Rutland Herald (March 2014)
broadband-competition-shortage-as-it-pursues-suit-against-verizon/
https://www.rutlandherald.com/articles/grants-help-fund-last-mile-of
-vermont-broadband/
Brodkin. “NY orders Charter out of state, says it must sell Time
Warner Cable system.” Ars Technica (July 2018)
FCC 2015 Broadband Progress Report. (January 2015)
https://arstechnica.com/tech-policy/2018/07/new-york-revokes-appr
https://apps.fcc.gov/edocs_public/attachmatch/FCC-15-10A1.pdf
oval-of-chartertime-warner-cable-merger/?amp=1
FCC 2018 Broadband Deployment Report. (February 2018)
Buckley. “CenturyLink's Patel: Broadband expansion will focus on
higher speeds, dense areas.” Fierce Telecom (January 2018) https://www.fcc.gov/reports-research/reports/broadband-progress-r
https://www.fiercetelecom.com/telecom/centurylink-s-patel-broadba eports/2018-broadband-deployment-report
nd-expansion-will-focus-higher-speeds-dense-areas
FCC Connect America Fund Phase II Funding Carrier State County
Buckley. “Verizon passes on $144M in CAF II funding as wireline https://www.fcc.gov/document/connect-america-fund-phase-ii-fundi
asset sale rumors swirl.” Fierce Telecom. (August 2015) ng-carrier-state-and-county
https://www.fiercetelecom.com/telecom/verizon-passes-144m-caf-ii-
funding-as-wireline-asset-sale-rumors-swirl FCC Form 477 Data December 2016 v1.
https://www.fcc.gov/general/broadband-deployment-data-fcc-form-
Coleman. “Impact of CAF II-funded Networks: Lessons From Two 477
Rural Exchanges Left Underserved.” Blandin Foundation. (June 2018)
https://blandinfoundation.org/content/uploads/Impact-of-CAF-II-fund
Frontier 4th Quarter Results 2017.
ed-Networks_WEB.pdf
http://investor.frontier.com/financial-information
Comcast 4th Quarter Results 2017.
Fung. “New York moves to break up Charter’s merger with Time
https://www.cmcsa.com/news-releases/news-release-details/comca
Warner Cable.” Washington Post (July 2018)
st-reports-4th-quarter-and-year-end-2017-results https://www.washingtonpost.com/technology/2018/07/27/new-york-
moves-break-up-charters-merger-with-time-warner-cable/?utm_term
Charter 4th Quarter Results 2017. =.92cf46ed3438
http://ir.charter.com/phoenix.zhtml?c=112298&p=irol-newsArticle&ID
=2330071 Google Fiber. “New Cities.”
https://fiber.google.com/newcities/
CenturyLink 4th Quarter Results 2017.
http://ir.centurylink.com/quarterly-results
31Karsten and West. “Google Fiber, Competition, and Broadband for Statista. “Average number of people per household in the United
All.” Brookings.edu. (March 2016) States from 1960 to 2017.” Accessed June 4, 2018.
https://www.brookings.edu/blog/techtank/2016/03/22/google-fiber-c https://www.statista.com/statistics/183648/average-size-of-househol
ompetition-and-affordable-broadband-for-all/ ds-in-the-us/
LTD Broadband. “Plans.” Strain, Moore, and Gambhir. “AT&T’s Digital Divide in California: An
http://ltdbroadband.com/plans.html Analysis of AT&T Fiber Deployment and Wireline Broadband Speeds
in California.” (2017)
Lucey and Mitchell. “Successful Strategies for Broadband https://haasinstitute.berkeley.edu/atts-digital-divide-california
Public-Private Partnerships.” Institute for Local Self-Reliance. (July
2016) https://ilsr.org/ppp-fiber/ Trostle and Mitchell. Cooperatives Fiberize Rural America: A Trusted
Model for the Internet Era.” Institute for Local Self-Reliance.
Minnesota Rural Broadband Coalition. “Understanding Satellite: The (November 2017)
Technology and Pricing.” https://ilsr.org/the-fiber-future-is-cooperative-policy-brief-on-rural-co
http://mnbroadbandcoalition.com/?page_id=464 operative-fiber-deployment/
MuniNetworks.org. “Why 25 Mbps / 3 Mbps is a Reasonable U.S. Census 2010 Data. TIGER/Line Shapefiles.
Minimum Standard in 2018.” (May 30, 2018)
https://www.census.gov/geo/maps-data/data/tiger-line.html
https://muninetworks.org/content/why-25-mbps-3-mbps-reasonable
-minimum-standard-2018
Verizon 4th Quarter Results 2017.
MuniNetworks.org. “SB 152.” Accessed July 11, 2018. http://www.verizon.com/about/investors/quarterly-reports/4q-2017-q
https://muninetworks.org/tags/tags/sb-152 uarter-earnings-conference-call-webcast
MuniNetworks.org. “Pinetops.” Accessed July 11, 2018. Woodward. “State to pay Comcast $4m to build out rural
https://muninetworks.org/tags/tags/pinetops broadband.” Boston Globe (August 2016)
https://www.bostonglobe.com/business/2016/08/22/state-pay-comc
NTIA State Mapping NOFA, 74 Fed. Reg. at 32557 (July 7, 2009) ast-for-more-rural-broadband/Zb8bqq5qGlpKfQ0RErgDHM/story.ht
https://www.ntia.doc.gov/files/ntia/publications/fr_broadbandmappin ml
gnofa_090708.pdf
Olmstead, Anderson, and Horrigan. “Americans have mixed views on
policies encouraging broadband adoption.” Pew Research Center
(April 2017)
http://www.pewresearch.org/fact-tank/2017/04/10/americans-have-
mixed-views-on-policies-encouraging-broadband-adoption/
3233
Appendi B Summary Table for Lar e IS s

                      ll o                     ll o          ll o               ll o                   ll o                      ll o

                     110         Total: 110

                                         Monopoly: 30        N/A               N/A         Population: 64.8                     $3.8

                                         Competitive: 80                                   Households: 25.5

                     101         Total: 101

                                         Monopoly: 38        N/A               N/A         Population: 57.2                     $3.6

                                         Competitive: 63                                   Households: 22.5

                                 Total: 65.8

                    122.5                Monopoly: 0.745     7.8              119.9        Population: 39.9                     $1.9

                                         Competitive: 65                                   Households: 15.7

                                 Total: 23.5

                     49.1                Monopoly: 1         3.8               48.4        Population: 12.7                     $1.4

                                         Competitive: 22.5                                 Households: 5

                                 Total: 33.5

                     55.2                Monopoly: 0.185     33.3              47.7        Population: 17.8                     $2.9

                                         Competitive: 33.5                                 Households: 7

                                 Total: 12.6

                     32.6                Monopoly: 0.059     10                 30         Population: 9.9                       $1

                                         Competitive: 12.5                                 Households: 3.9
                                                                              All populations are approximate and based on 2010 census data.
                                                                    This is a best-case scenario based on the December 2016                .
                                                                                                                                          34
Appendi C rban ural Summary of Lar e IS s Monopoly and Competiti e Ser ice Areas
ll o ll o
Total: 30 Total: 80
Urban: 25.7 Urban: 76
Rural: 4.7 Rural: 4
Total: 38 Total: 63
Urban: 29.3 Urban: 58.9
Rural: 8.6 Rural: 4.5
Total: 0.745 Total: 65
Urban: 0.498 Urban: 53.2
Rural: 0.247 Rural: 1.8
Total: 1 Total: 22.5
Urban: 0.647 Urban: 20.6
Rural: 0.367 Rural: 1.9
Total: 0.185 Total: 33.5
Urban: 0.158 Urban: 0.839
Rural: 0.027 Rural: 32.5
Total: 0.059 Total: 12.5
Urban: .042 Urban: 12.2
Rural: .017 Rural: 0.282
All populations are approximate and based on 2010 census data.
This is a best-case scenario based on the December 2016 FCC Form 477.
35You can also read