Reassessment of Need for the Trans Mountain Pipeline Expansion Project - By J. David Hughes
←
→
Page content transcription
If your browser does not render page correctly, please read the page content below
Reassessment of Need for the
Trans Mountain Pipeline Expansion Project
Production forecasts, economics and environmental considerations

By J. David Hughes
OCTOBER 2020

Reassessment of Need for the
Trans Mountain Pipeline Expansion Project
Production forecasts, economics and environmental considerations
by J. David Hughes
October 2020

This paper is part of the Corporate Mapping Project (CMP), a research and public engagement initiative
investigating the power of the fossil fuel industry. The CMP is jointly led by the University of Victoria, the
Canadian Centre for Policy Alternatives and the Parkland Institute. This research was supported by the
Social Science and Humanities Research Council of Canada (SSHRC).

For more information, visit www.corporatemapping.ca.

We also thank Stand for its financial support of this research.

PUBLISHING TEAM
Shannon Daub, Jean Kavanagh, Emira Mears, Terra Poirier
Copyedit: Grace Yaginuma
Layout: Paula Grasdal
Cover photo: Bruce Raynor / Shutterstock
Figures copyright © 2020 by J. David Hughes

ISBN 978-1-77125-521-9

This report is available under limited copyright protection. You may download, distribute, photocopy,
cite or excerpt this document provided it is properly and fully credited and not used for commercial
purposes. Figures copyright © 2020 by J. David Hughes. All rights reserved. Published July 2020.

The opinions and recommendations in this report, and any errors, are those of the author, and do not
necessarily reflect the views of the funders of this report.

                                               520 – 700 West Pender Street Vancouver, BC V6C 1G8
                                               604.801.5121 | ccpabc@policyalternatives.ca

                                               www.policyalternatives.ca
The CCPA–BC is located on unceded Coast Salish territory, including the lands belonging to the
xwməθwəýəm (Musqueam), Skwxwú7mesh (Squamish) and səÍílwətaʔɬ /Selilwitulh (Tsleil-Waututh) Nations.
ABOUT THE AUTHOR
J. DAVID HUGHES is an earth scientist who has studied the energy resources of Canada for more than four
decades, including 32 years with the Geological Survey of Canada as a scientist and research manager. He
developed the National Coal Inventory to determine the availability and environmental constraints associated with
Canada’s coal resources. As Team Leader for Unconventional Gas on the Canadian Gas Potential Committee, he
coordinated the publication of a comprehensive assessment of Canada’s unconventional natural gas potential.

Over the past two decades, Hughes has researched, published and lectured widely on global energy and
sustainability issues in North America and internationally. In his work for the Canadian Centre for Policy
Alternatives, Hughes authored A Clear View of BC LNG in 2015, which examined the issues surrounding a proposed
massive scale-up of shale gas production in British Columbia for LNG export, Can Canada increase oil and gas
production, build pipelines and meet its climate commitments? in 2016, which examined the issues surrounding
climate change and the Trans Mountain pipeline expansion (now updated in this paper), Canada’s Energy Outlook:
Current realities and implications for a carbon-constrained future in 2018, and BC’s Carbon Conundrum: Why LNG
exports doom emissions-reduction targets and compromise Canada’s long-term energy security earlier in 2020. He has
also authored multiple reports on unconventional oil and gas development in the United States, consulted for the
private sector on unconventional oil and gas, and served as an expert witness on hearings for energy projects in
the US and Canada.

Hughes is president of Global Sustainability Research, a consultancy dedicated to research on energy and
sustainability issues. He is also a board member of Physicians, Scientists & Engineers for Healthy Energy (PSE
Healthy Energy) and is a Fellow of Post Carbon Institute. His work has been featured in Nature, Canadian Business,
Bloomberg and USA Today, as well as other popular press, radio, and television.

ACKNOWLEDGEMENTS
Special thanks to Stand for supporting this research and to the Corporate Mapping Project for providing a
platform for its publication. Dr. Tom Gunton of Simon Fraser University, Dr. Bill Carroll of the University of
Victoria and Marc Lee of the CCPA critically reviewed the manuscript and provided many helpful suggestions.
Grace Yaginuma carefully copyedited the report and the CCPA publishing team oversaw its review and
publication.
Contents

List of figures and tables..................................................................................................... 5

Summary..........................................................................................................................6

Introduction.....................................................................................................................8

Western Canada oil supply.............................................................................................10

Pipeline requirements given supply forecasts.................................................................15

Markets and prices for Canadian heavy oil......................................................................20

Reduced netbacks for exports to Asia..............................................................................23

Conclusion.....................................................................................................................27

List of figures and tables

FIGURES

Figure 1: Carbon dioxide equivalent emissions from oil sands production, with projected
emissions to 2040 ....................................................................................................................11

Figure 2: Canadian overall emissions by economic sector through 2018 and forecast for
the oil and gas sector through 2050 .........................................................................................12

Figure 3: Oil supply in Western Canada by oil type through 2040, with a 100 Mt
per year oil sands emissions cap ..............................................................................................14

Figure 4: Existing and proposed Western Canada export takeaway capacity and domestic
refinery consumption from Table 3 compared to Western Canada supply forecasts
from Table 2 ............................................................................................................................17

Figure 5: Close-up of Figure 4: Existing and proposed Western Canada export takeaway
capacity and domestic refinery consumption from Table 3 compared to Western Canada
supply forecasts from Table 2 ...................................................................................................18

Figure 6: Rail requirements if the TMX and Keystone XL pipelines are not constructed .............19

Figure 7: US imports of heavy, sour crude oil by country to the Midwest and
Gulf Coast, 2010–2020 .............................................................................................................22

TABLES

Table 1: Oil sands emissions, production and emissions per barrel from 2005 to 2018. ............10

Table 2: Forecasts of oil supply in Western Canada through 2040 (million barrels per day)......13

Table 3: Existing and proposed domestic refinery capacity and pipeline and rail export
capacity from Western Canada (million barrels per day)..........................................................16

Table 4: Global demand for heavy oil by region in 2018 ...........................................................21

Table 5: Price of Mexican Maya heavy, sour crude oil, 2010-2020 .............................................24

Table 6: Tolls for transporting Canadian heavy oil to south China compared to the US
Midwest or Gulf Coast, with toll-price penalties for selling to Asia ...........................................25

A CORPORATE MAPPING PROJECT REPORT                                                                                                            5
Summary

  There have been     CANADA’S ACQUISITION OF KINDER MORGAN’S TRANS MOUNTAIN PIPELINE and expansion project
    significant new   (TMX), and its subsequent efforts to begin construction, have been fraught with delays, oppos-
     developments     ition and court challenges. This report assesses the latest data on the need for the project and its
   that bear on the   likely impact on Canadian producers and commitments under international climate agreements.

need for TMX since    There have been significant new developments that bear on the need for TMX since the govern-
  the government      ment purchased the project in 2018 and approved it for the second time in 2019. These include:
     purchased the
                          •    Announced expansions and optimizations of existing pipelines that will increase export
    project in 2018
                               capacity over the next two to three years, including the Enbridge mainline, and the
   and approved it
                               Aurora-Rangeland, Keystone and Express pipelines.
     for the second
                          •    The reversal of the Southern Lights pipeline for export use in 2023.
      time in 2019.
                          •    The likely completion of the Line 3 expansion project in 2021.

                          •    The release of new production forecasts since June, 2019, by the Canada Energy Regulator
                               (CER, formerly the National Energy Board), Alberta Energy Regulator (AER), Canadian
                               Association of Petroleum Producers (CAPP) and International Energy Agency (IEA).

                          •    The release of the latest update of Alberta’s Oil Sands Emissions Limit Act in January 2020.

                          •    The release of Canada’s 2020 emissions report by economic sector which allows an up-
                               dated assessment of future emissions from the oil and gas sector and compliance with
                               Alberta’s 2020 Oil Sands Emissions Limit Act.

                          •    The increase in the cost of the TMX project from $7.4 billion when it was purchased in
                               2018 to $12.6 billion in February 2020, which will significantly increase shipping costs
                               for Canadian producers selling oil to Asia compared to US exports.

                          •    The COVID-19 pandemic of 2020 which has resulted in an unprecedented decline in the
                               demand for oil and is likely to reduce demand in the longer term.

                      Key conclusions of this report are as follows:

                          1.   Emissions from the oil and gas sector alone are on track to exceed Canada’s emissions
                               reduction target in 2050 by 81 per cent — even with a 100 megatonne (Mt) per year
                               cap on oil sands emissions (as evidenced from the latest CER oil and gas production
                               forecast, coupled with the latest Environment Canada emissions report). Without the
                               cap, emissions from the oil and gas sector would exceed this target by 101 per cent.

                  6                               REASSESSMENT OF NEED FOR THE TRANS MOUNTAIN PIPELINE EXPANSION PROJECT
2. The increase in oil production forecast by CER (with an oil sands emissions cap), AER,
CAPP and IEA can easily be accommodated for the next decade with existing pipelines,
including announced optimizations and the Line 3 expansion, without rail or the TMX
and Keystone XL pipelines. These forecasts, however, substantially overstate likely pro-
duction increases as they do not account for the impact of demand reduction resulting
from the COVID-19 pandemic or the need to reduce emissions from oil and gas produc-
tion to meet Canada’s emissions reduction targets.
3. There is no price premium to be had selling Canadian heavy oil to Asia. In fact, based on The government’s
Pemex sales of Maya heavy oil (comparable to Canada’s Western Canada Select heavy claim that TMX
oil benchmark) over the past six years, cargos bound for the Far East sold at an average must be built in
discount of $4.27 per barrel compared to cargos bound for the US. (The higher price order to provide
paid for heavy oil in the US reflects the fact that the US has more than half of the world’s increased revenue
refineries equipped to process heavy oil.)
to Canadian oil
4. Transportation costs to Asia from Alberta are also higher than to the US Midwest or Gulf producers and
Coast. Transport costs to south China are between US$1.88 to US$3.52 per barrel higher $500 million per
than to the US Gulf Coast, and from US$5.90 to US$7.92 per barrel higher than to the year to reduce
US Midwest. emissions must
5. Thus, the narrative that the Trans Mountain Expansion project will lead to increased be viewed
netbacks1 for Canadian producers is not supported by the evidence. The discount from with extreme
selling Canadian heavy oil to Asia, coupled with higher transportation costs, will lead to skepticism.
a reduction in netbacks for Canadian producers, compared to the US, of US$4 to US$6
per barrel or more.
6. Therefore, the government’s claim that TMX must be built in order to provide increased
revenue to Canadian oil producers and $500 million per year to reduce emissions must
be viewed with extreme skepticism. An expenditure of $12.6 billion tax dollars on a pro-
ject that will likely reduce revenues for Canadian producers would certainly be better
spent directly on reducing emissions.
Canada’s emissions reduction policies have so far proven to be ineffective at the scale required.
Although Canada has committed to a 30 per cent reduction of emissions by 2030 (from 2005
levels), emissions were down only 0.14 per cent by 2018. Emissions in Alberta, where the oil to
fill TMX would be produced, have increased by 17.5 per cent since 2005.
The $12.6 billion the government plans to spend on the construction of TMX is counterproduct-
ive, as it is unlikely to increase the profits of Canadian producers or result in a revenue stream
that will both cover construction costs and provide additional funds to reduce emissions in a
meaningful timeframe. If anything, TMX will exacerbate the emissions problem by incentivizing
additional production growth while diverting funds that could otherwise be spent on actual
emissions reduction. TMX will also increase the risk of oil spills along its route and in the marine
environment. Canada urgently requires a viable strategy that will effectively address future
energy security needs, environmental objectives, and emissions reduction targets.
1 “Netbacks” refers to profit after covering production, marketing and transportation costs.
A CORPORATE MAPPING PROJECT REPORT 7Introduction
At the heart of the THE TRANS MOUNTAIN PIPELINE EXPANSION (TMX) PROJECT was first proposed by Kinder Morgan
rationale behind in 2012, and was approved by the National Energy Board (NEB) and federal government in
TMX is the notion 2016. The project became a lightning rod for mass protests and arrests, and in early 2018 Kinder
that Canada Morgan suspended non-essential spending — the federal government subsequently purchased
the existing Trans Mountain pipeline and related infrastructure from Kinder Morgan for $4.5
will capture
billion in mid-2018 in order to ensure the expansion project would proceed. In August 2018,
higher prices
the Federal Court of Appeal overturned the federal government’s approval of the project, and a
for its oil in Asia,
second round of environmental assessment and consultation was commenced, which culminat-
compared with
ed in the federal government approving TMX a second time in June 2019.2 In the meantime, the
the US market, cost of the expansion project increased from an initial estimate of $5.4 billion in 2013 to the most
where virtually recent estimate of $12.6 billion made in February 2020.3
all Canadian oil
exports are sold. In parallel with the evolution of the TMX project, the federal government signed the Paris
Agreement in 2016, which committed Canada to a 30 per cent reduction in emissions from 2005
levels by 2030.4 In addition, the federal government has committed to achieving net-zero emis-
sions by 2050, stating, “Canada will develop a plan to achieve net-zero emissions by 2050 and
will set legally-binding, five-year emissions reduction milestones.”5 The government justified
the apparent conflict between expanding oil production infrastructure and reducing emissions
by claiming TMX would generate $500 million in annual revenue, which would be spent on
reducing emissions.6
At the heart of the rationale behind TMX is the notion that Canada will capture higher prices for
its oil in Asia, compared with the US market, where virtually all Canadian oil exports are sold.
2 Canadian Press, “Timeline: Key Dates in the History of the Trans Mountain Pipeline,” CBC
News, October 3, 2018, updated June 18, 2019, https://www.cbc.ca/news/canada/calgary/
timeline-key-dates-history-trans-mountain-pipeline-1.4849370.
3 Vassy Kapelos and John Paul Tasker, “Cost of Trans Mountain Expansion Soars to $12.6B,” CBC News,
February 7, 2020, https://www.cbc.ca/news/politics/vassy-trans-mountain-pipeline-1.5455387.
4 Catherine Cullen, “Justin Trudeau Signs Paris Climate Treaty at UN, Vows to Harness Renewable Energy,”
CBC News, April 22, 2020, https://www.cbc.ca/news/politics/paris-agreement-trudeau-sign-1.3547822.
5 Environment and Climate Change Canada, “Government of Canada Releases Emissions Projections,
Showing Progress towards Climate Target,” news release, December 20, 2019, https://www.canada.ca/
en/environment-climate-change/news/2019/12/government-of-canada-releases-emissions-projections-
showing-progress-towards-climate-target.html.
6 Mia Rabson, “Trans Mountain Pipeline Could Fund $500M a Year in Clean Energy
Projects,” CBC News, October 24, 2019, https://www.cbc.ca/news/canada/edmonton/
tmx-pipeline-morneau-alberta-1.5333319.
8 REASSESSMENT OF NEED FOR THE TRANS MOUNTAIN PIPELINE EXPANSION PROJECTGiven that the Canadian government is committed to spending $12.6 billion of its citizens’
tax revenue on TMX, and the government’s commitments to reducing emissions, this report
addresses the following key questions:
• What is the future production outlook from Western Canada for oil exports, considering
federal commitments to reduce emissions and Alberta’s pledge to cap oil sands emis-
sions at 100 megatonnes (Mt) per year?7
• Is TMX needed, given the existing pipeline- and rail-takeaway capacity from Western
Canada and new capacity coming online from other projects? (These include announced
expansions and optimizations of existing pipelines and the expected completion of the
Enbridge Line 3 expansion project in 2021.)
• Will oil exported on TMX capture higher prices in Asia, as claimed by its proponents?
This analysis is based on the most recent oil and gas production forecast from the Canada
Energy Regulator (CER),8 which I will refer to as the “CER forecast,” and Canada’s 2020 National
Inventory Report of emissions by economic sector,9 referred to as the “NIR emissions report.” I
also assess production forecasts of the Canadian Association of Petroleum Producers (the “CAPP
forecast”),10 the Alberta Energy Regulator (the “AER forecast”)11 and the International Energy
Agency (the “IEA forecast”).12
7 Province of Alberta, 2020, Oil Sands Emissions Limit Act, Statutes of Alberta, 2016, Chapter
O-7.5 Current as of January 1, 2020, https://www.qp.alberta.ca/1266.cfm?page=O07p5.
cfm&leg_type=Acts&isbncln=9780779814053.
8 Canada Energy Regulator, Canada’s Energy Future 2019: Energy Supply and Demand Projections to 2040
(Ottawa, ON: Canada Energy Regulator, 2019), https://www.cer-rec.gc.ca/en/data-analysis/canada-
energy-future/2019/index.html.
9 Environment and Climate Change Canada, National Inventory Report 1990–2018: Greenhouse Gas Sources
and Sinks in Canada (Ottawa, ON: Environment and Climate Change Canada, 2020), https://unfccc.int/
documents/224829.
10 Canadian Association of Petroleum Producers, 2019 Crude Oil Forecast, Markets and Transportation
(Calgary, AB: Canadian Association of Petroleum Producers, 2019), https://www.capp.ca/wp-content/
uploads/2019/11/CAPP-2019-Crude-Oil-Markets-and-Transportation-338794-1.pdf.
11 Alberta Energy Regulator, ST98: Alberta Energy Outlook (Calgary, AB: Alberta Energy Regulator, 2020),
http://www1.aer.ca/ProductCatalogue/32.html.
12 International Energy Agency, World Energy Outlook 2019 (Paris, France: International Energy Agency,
2019), https://www.iea.org/reports/world-energy-outlook-2019.
A CORPORATE MAPPING PROJECT REPORT 9Western Canada oil supply
THE LATEST CER FORECAST FOR OIL AND GAS PRODUCTION IN CANADA breaks out production
by product, province, production method and producing formation. The latest NIR emissions
report breaks down oil production emissions into “conventional,” “oil sands mining,” “oil
sands upgrading” and “oil sands in situ.” In the case of oil sands, the effect of Alberta’s cap on
emissions at 100 Mt per year on future production can be determined using emissions per unit
of production (Table 1).
Table 1: Oil sands emissions, production and emissions per barrel from 2005 to 2018
Oil sands emissions (Mt/year) Oil sands production (kbd)b Oil sands emissions per barrel (kg CO2e /bbl)c
Year
Mining In situa Upgrading Mining In situ Upgrading Mining In situ Upgrading
2005 9 11 17 626 438 522 39.4 68.7 89.2
2006 11 13 19 760 494 619 39.6 72.1 84.1
2007 12 14 20 784 536 652 41.9 71.6 84.0
2008 11 16 19 721 583 620 41.8 75.2 83.9
2009 12 17 21 825 664 722 39.8 70.2 79.6
2010 12 20 22 857 752 703 38.4 72.8 85.8
2011 12 21 23 893 847 810 36.8 67.9 77.8
2012 14 25 25 932 990 817 41.1 69.2 83.8
2013 15 27 26 976 1,106 835 42.1 66.9 85.3
2014 16 29 25 960 1,263 843 45.7 62.9 81.3
2015 17 33 24 1,161 1,362 850 40.1 66.4 77.3
2016 17 35 22 1,150 1,396 932 40.5 68.7 64.7
2017 18 38 23 1,276 1,546 1,030 38.7 67.3 61.2
2018 18 41 24 1,489 1,555 1,091 33.1 72.2 60.2
Future emissions calculated from the average of 2015–2018 38.1 68.7 65.9
Source: Data from Canada Energy Regulator (see note 8) and Environment and Climate Change Canada (see note 9)
a In situ refers to bitumen produced from wells without mining.
b kbd = thousand barrels per day.
c kg CO₂e/bbl = kilograms of CO₂ equivalent per barrel.
10 REASSESSMENT OF NEED FOR THE TRANS MOUNTAIN PIPELINE EXPANSION PROJECTUsing an average of the most recent four years for which emissions data are available (Table 1), and the CER forecast of oil sands production, the emissions cap will be reached in 2025 (Figure 1). In 2018, the latest year for which emissions data are available, oil sands emissions still had 17 Mt per year left to grow, before reaching the emissions cap. After 2025, oil sands production would be constrained by the cap — but given Canada’s aspirations to achieve net-zero emissions by 2050, reduced oil demand in the future given the coronavirus pandemic, and the aspirations of many other countries to reduce oil consumption and associated emissions, it is questionable if oil sands production will even reach the emissions cap level. (Note that the CER forecast was released before the pandemic.) Figure 1: Carbon dioxide equivalent emissions from oil sands production, with projected emissions to 2040 Sources: Data from Environment and Climate Change Canada (see note 9) and Canada Energy Regulator (see note 8). Figure 2 illustrates Canada’s emissions from 1990 through 2018 by economic sector based on the NIR emissions report. The figure also shows projected emissions from the oil and gas sector through 2040 based on the CER forecast (using the 2015–2018 average emissions per unit of production). Emissions are then held flat for each component of the oil and gas sector through 2050 at 2040 levels (an approximation given that there is no forecast from 2040 to 2050), to assess compliance with an 80 per cent reduction of Canadian emissions from 2005 levels by 2050. Oil sands emissions are held constant at 100 Mt per year through 2050 after reaching the cap in 2025. The oil sands emissions cap reduces overall emissions of the larger oil and gas sector by 9.3 per cent in 2050. However, even with the cap, emissions from the oil and gas sector alone exceed Canada’s commitment to an 80 per cent reduction in overall emissions by 2050, and do so by a large margin of 81 per cent — even if all other sectors of the economy are reduced to zero. Without the oil sands emissions cap, the oil and gas sector would exceed the 2050 target by 101 per cent. And since Canada’s target of 80 per cent by 2050 was set, the federal government has A CORPORATE MAPPING PROJECT REPORT 11
Figure 2: Canadian overall emissions by economic sector through 2018 and forecast for the oil and gas sector through 2050

Oil and gas emissions 2018-2050 are based on CER production forecast assuming an oil sands emissions cap of 100 Mt per year.

Sources: Emissions data to 2018 from Environment and Climate Change Canada (see note 9) and projections from 2018–2040 based on Canada
         Energy Regulator (see note 8).
Note:   Flat emissions from 2040 to 2050 are assumed as the CER forecast ends in 2040.

                               further committed to net zero by 2050. Clearly, the increases in oil and gas production forecasted
                               by CER are inconsistent with the required emissions reductions.

                               Given that as of 2018 total Canadian emissions had only been reduced by 0.14 per cent, despite
                               policies put in place to reduce emissions and government assurances that Canada will meet its
                               commitments under the Paris Agreement, it seems highly unlikely that every sector of the econ-
                               omy other than oil and gas production can be reduced to zero by 2050. And even if they could,
                               the oil and gas sector will clearly have to greatly reduce emissions for Canada to have any chance
                               of meeting its emissions-reduction targets. (The IEA’s 2019 “sustainable development” scenario
                               requires a 32 per cent reduction in oil production by 2040 to meet global emissions-reduction
                               requirements.)13 Although there are some opportunities for emissions reduction in the oil and
                               gas sector, such as reducing fugitive methane, reducing steam-to-oil ratios for in situ bitumen
                               production and deploying solvent injection and electrification, these are by no means sufficient
                               without also reducing oil and gas production.

                               In determining oil supply that is available for export, allowance must be made for imported
                               diluents, as raw bitumen must be blended with diluents at 30 per cent by volume to lower its
                               viscosity and enable movement through a pipeline. Production of condensates and other natural

                               13		 International Energy Agency, World Energy Outlook 2019 (Paris, France: International Energy Agency,
                                    2019), https://www.iea.org/reports/world-energy-outlook-2019.

                    12                                          REASSESSMENT OF NEED FOR THE TRANS MOUNTAIN PIPELINE EXPANSION PROJECT
gas liquids used as diluents in Western Canada is not sufficient to meet what is required to export
the forecasted volume of raw bitumen. There are several forecasts of Western Canadian supply
of oil available for domestic refining and export including imported diluents, which are illustrat-
ed in Table 2. (In the case of the CER forecast with the emissions cap, the volume of imported
diluents required was based on domestic diluent production and the forecasted volume of raw
bitumen exports. In the case of the IEA, its forecast for all of Canada was reduced by the CER
forecasted production in Eastern Canada in order to obtain Western Canadian supply.)
Table 2: Forecasts of oil supply in Western Canada through 2040 (million barrels per day)
CERa CERa
(in 2019) (in 2019) AERb CAPPc IEAd
with without (in 2020) (in 2019) (in 2019)
emissions cap emissions cap
2018 4.705 4.705 4.527 4.657 5.154
2019 4.864 4.864 4.580 4.802 5.152
2020 5.107 5.107 4.848 5.004 5.218
2021 5.281 5.281 4.998 5.093 5.239
2022 5.394 5.394 5.073 5.226 5.276
2023 5.489 5.489 5.172 5.297 5.305 Given that as
2024 5.589 5.589 5.292 5.384 5.352 of 2018 total
2025 5.646 5.661 5.424 5.472 5.408
Canadian
emissions had
2026 5.659 5.817 5.576 5.581 5.454
only been reduced
2027 5.675 5.927 5.687 5.666 5.496
by 0.14 per cent
2028 5.696 5.958 5.790 5.753 5.531 it seems highly
2029 5.722 6.042 5.865 5.783 5.555 unlikely that every
2030 5.749 6.159 5.867 5.582
sector of the
economy other
2031 5.775 6.285 5.949 5.636
than oil and gas
2032 5.799 6.346 6.023 5.695
production can
2033 5.824 6.478 6.139 5.744 be reduced to
2034 5.850 6.538 6.254 5.788 zero by 2050.
2035 5.874 6.546 6.336 5.828
2036 5.896 6.540 5.834
2037 5.919 6.600 5.846
2038 5.942 6.627 5.861
2039 5.965 6.685 5.877
2040 5.989 6.715 5.893
Sources:
a Canada Energy Regulator (see note 8).
b Alberta Energy Regulator. Figures are from their “base case” (see note 11).
c Canadian Association of Petroleum Producers (see note 10).
d International Energy Agency. Figures are IEA’s stated policies (see note 12).
A CORPORATE MAPPING PROJECT REPORT 13Figure 3 illustrates the CER forecast (with the emissions cap) broken down by oil type, along
with the other forecasts. With the exception of the CER forecast without the emissions cap, there
is fairly good agreement between the forecasts, even though it is unlikely the other forecasts
include the oil sands emissions cap. Also, CAPP’s forecast was made in 2019 before the recent
downturn in oil markets and the cancellation of projects such as Teck’s 260,000-barrel-per-day
Frontier mine. CAPP decided, because of the uncertainty in oil markets, it would not provide
an updated 2020 forecast, but given the significant weakening of oil markets an updated CAPP
forecast would most likely be lower than the 2019 CAPP forecast shown in Table 2 and Figure 3.
Figure 3: Oil supply in Western Canada by oil type through 2040, with a 100 Mt per year oil sands emissions cap
Also shown is the supply forecast by CER without an emissions cap, and forecasts by AER, CAPP and IEA (see Table 2).
Sources: Data from Canada Energy Regulator (see note 8), Alberta Energy Regulator (note 11), Canadian Association of Petroleum Producers
(note 10), and International Energy Agency (note 12).
14 REASSESSMENT OF NEED FOR THE TRANS MOUNTAIN PIPELINE EXPANSION PROJECTPipeline requirements
given supply forecasts
WESTERN CANADIAN OIL IS USED BOTH DOMESTICALLY IN REFINERIES in the three western prov- Although rail is a
inces and exported to refineries in the US and Eastern Canada. CAPP has enumerated the refinery more expensive
capacity in Alberta, Saskatchewan and British Columbia,14 and CER has enumerated the existing option than
and proposed pipeline export capacity.15
pipelines, it has
In addition to pipelines, rail also provides export capacity. In February 2020, 411,991 barrels per the flexibility to
day were exported by rail,16 and the total existing oil-loading capacity of rail in Western Canada access markets
is estimated by CAPP at 1,108,000 barrels per day.17 Although rail is a more expensive option not served by
than pipelines, it has the flexibility to access markets not served by pipelines and is three times pipelines and is
safer than pipelines in terms of the volume of oil spilled per ton-mile transported.18 three times safer
than pipelines
Table 3 illustrates the total existing and projected export takeaway capacity from Western
in terms of the
Canada to the US, Eastern Canada and the West Coast. Pipeline capacities for existing and
volume of oil
proposed pipelines are from the CER forecast,19 and rail capacity is based on 75 per cent of
spilled per ton-
the existing rail oil-loading capacity (assuming that the full rail loading capacity will not
be accessible owing to insufficient rail cars and other logistical constraints). Also included mile transported.
is additional capacity announced by Enbridge on its Mainline system beginning in 2020
14 Canadian Association of Petroleum Producers, 2019 Crude Oil Forecast, Markets and Transportation,
https://www.capp.ca/wp-content/uploads/2019/11/CAPP-2019-Crude-Oil-Markets-and-
Transportation-338794-1.pdf.
15 Canada Energy Regulator, “Results,” Canada’s Energy Future 2019, updated June 24, 2020,
https://www.cer-rec.gc.ca/nrg/ntgrtd/ftr/2019/rslts/index-eng.html, Figure 19.
16 Canada Energy Regulator, “Canadian Crude Oil Exports by Rail — Monthly Data,” Crude Oil and
Petroleum Products, accessed July 19, 2020, https://www.cer-rec.gc.ca/nrg/sttstc/crdlndptrlmprdct/stt/
cndncrdlxprtsrl-eng.html.
17 Canadian Association of Petroleum Producers, 2019 Crude Oil Forecast, Markets and Transportation,
https://www.capp.ca/wp-content/uploads/2019/11/CAPP-2019-Crude-Oil-Markets-and-
Transportation-338794-1.pdf.
18 Congressional Research Service, U.S. Rail Transportation of Crude Oil: Background and Issues for Congress
(Washington, DC: Congressional Research Service, 2014), https://fas.org/sgp/crs/misc/R43390.pdf, 11,
Figure 3.
19 Canada Energy Regulator, “Results,” Canada’s Energy Future 2019, updated June 24, 2020,
https://www.cer-rec.gc.ca/nrg/ntgrtd/ftr/2019/rslts/index-eng.html, Figure 19.
A CORPORATE MAPPING PROJECT REPORT 15Table 3: Existing and proposed domestic refinery capacity and pipeline and rail export capacity
from Western Canada (million barrels per day)
Mainline Southern
AB & SK Milk Aurora Trans Enbridge Line 3 Keystone
Express Keystone enhance- Lights Rail TMX
refineries River Rangeland Mountain Mainline expansion XL
ments reversal
2014 0.54 0.28 0.10 0.04 0.23 2.34 0.53 0.00 0.00 0.00 0.42 0.00 0.00
2015 0.54 0.28 0.10 0.04 0.25 2.52 0.58 0.00 0.00 0.00 0.42 0.00 0.00
2016 0.57 0.28 0.10 0.04 0.26 2.76 0.57 0.00 0.00 0.00 0.42 0.00 0.00
2017 0.58 0.28 0.10 0.04 0.27 2.81 0.59 0.00 0.00 0.00 0.48 0.00 0.00
2018 0.63 0.28 0.10 0.04 0.26 2.78 0.59 0.00 0.00 0.00 0.64 0.00 0.00
2019 0.65 0.28 0.10 0.05 0.28 2.82 0.58 0.00 0.00 0.00 0.83 0.00 0.00
2020 0.65 0.31 0.10 0.11 0.27 2.87 0.63 0.05 0.00 0.00 0.83 0.00 0.00
2021 0.65 0.32 0.10 0.12 0.28 2.87 0.63 0.05 0.00 0.16 0.83 0.00 0.00
2022 0.65 0.32 0.10 0.12 0.28 2.87 0.63 0.05 0.00 0.36 0.83 0.35 0.00
2023 0.65 0.32 0.10 0.12 0.28 2.87 0.63 0.24 0.14 0.36 0.83 0.81 0.45
2024 0.65 0.32 0.10 0.12 0.28 2.87 0.75 0.24 0.14 0.36 0.83 0.81 0.53
2025 0.72 0.32 0.10 0.12 0.28 2.87 0.75 0.24 0.14 0.36 0.83 0.81 0.53
2026 0.72 0.32 0.10 0.12 0.28 2.87 0.75 0.24 0.14 0.36 0.83 0.81 0.53
2027 0.72 0.32 0.10 0.12 0.28 2.87 0.75 0.24 0.14 0.36 0.83 0.81 0.53
2028 0.72 0.32 0.10 0.12 0.28 2.87 0.75 0.24 0.14 0.36 0.83 0.81 0.53
2029 0.72 0.32 0.10 0.12 0.28 2.87 0.75 0.24 0.14 0.36 0.83 0.81 0.53
2030 0.80 0.32 0.10 0.12 0.28 2.87 0.75 0.24 0.14 0.36 0.83 0.81 0.53
2031 0.80 0.32 0.10 0.12 0.28 2.87 0.75 0.24 0.14 0.36 0.83 0.81 0.53
2032 0.80 0.32 0.10 0.12 0.28 2.87 0.75 0.24 0.14 0.36 0.83 0.81 0.53
2033 0.80 0.32 0.10 0.12 0.28 2.87 0.75 0.24 0.14 0.36 0.83 0.81 0.53
2034 0.80 0.32 0.10 0.12 0.28 2.87 0.75 0.24 0.14 0.36 0.83 0.81 0.53
2035 0.80 0.32 0.10 0.12 0.28 2.87 0.75 0.24 0.14 0.36 0.83 0.81 0.53
2036 0.80 0.32 0.10 0.12 0.28 2.87 0.75 0.24 0.14 0.36 0.83 0.81 0.53
2037 0.80 0.32 0.10 0.12 0.28 2.87 0.75 0.24 0.14 0.36 0.83 0.81 0.53
2038 0.80 0.32 0.10 0.12 0.28 2.87 0.75 0.24 0.14 0.36 0.83 0.81 0.53
2039 0.80 0.32 0.10 0.12 0.28 2.87 0.75 0.24 0.14 0.36 0.83 0.81 0.53
2040 0.80 0.32 0.10 0.12 0.28 2.87 0.75 0.24 0.14 0.36 0.83 0.81 0.53
Note: This table assumes 95 per cent of the capacity given by Enbridge for the enhancement of its Mainline and the Southern Lights reversal; 75
per cent of the oil-loading capacity for rail given by CAPP; and 95 per cent of the capacity given by CAPP for the refineries.
Sources: Data from Canadian Association of Petroleum Producers (see note 10), Canada Energy Regulator (note 15), Enbridge (note 20), Alberta
Energy Regulator (note 21), and Canadian Press (note 22).
(“Mainline enhancements” in the table), including the reversal of its Southern Lights pipe-
line for exports, which is currently used to import diluent;20 enhancements on TC Energy’s
Keystone pipeline (50,000 barrels per day beginning in 2020,21 and a further 120,000 barrels
20 Enbridge, “Resilience Discipline Growth” (PowerPoint presentation, investment community presentation,
June 2020), https://www.enbridge.com/~/media/Enb/Documents/Investor%20Relations/2020/
ENB_Investment_Community_Presentation_June_2020v2.pdf, 45, 50.
21 Alberta Energy Regulator, “Oil Pipelines,” in ST98: Alberta Energy Outlook (Calgary, AB: Alberta Energy
Regulator, 2020), https://www.aer.ca/providing-information/data-and-reports/statistical-reports/st98/
pipelines-and-other-infrastructure/pipelines.html.
16 REASSESSMENT OF NEED FOR THE TRANS MOUNTAIN PIPELINE EXPANSION PROJECTper day — an expansion that has been approved by the US).22 (This additional capacity has
been discounted by 5 per cent to reflect the likely maximum usable capacity given mainten-
ance and other possible outages.) The Southern Lights pipeline reversal in 2023 is due to
rising domestic diluent production, allowing this pipeline to be repurposed for exports.
The refinery capacity in Table 3 is from CAPP,23 and includes only Alberta and Saskatchewan,
even though BC refineries have a capacity of 67,000 barrels per day. This is because much of the
crude oil for BC’s Parkland refinery is shipped on the Trans Mountain pipeline and hence this
refinery does not reduce the need for export capacity as the Alberta and Saskatchewan refineries
do. The refinery capacity in Alberta has also been increased by 79,000 barrels per day in 2025 and
again in 2030, to reflect the probable addition of Phases 2 and 3, respectively, of the Sturgeon
refinery.(The refinery capacity in Table 3 has been reduced by 5 per cent from the capacity given
by CAPP to reflect a maximum usable capacity.)
Figure 4 presents Table 3 as a chart. The various supply forecasts from Table 2 are also shown
to compare with existing and proposed Western Canada pipeline and rail export capacity and
domestic refinery consumption. Figure 5 expands a section of Figure 4.
Figure 4: Existing and proposed Western Canada export takeaway capacity and domestic refinery consumption from
Table 3 compared to Western Canada supply forecasts from Table 2
Sources: For export capacity data, see notes 10, 15 and 20–22 and Table 3. For Western Canada supply data, see notes 8 and 10–12 and Table 2.
For refinery capacity, see note 10.
Note: This figure assumes 95 per cent of the capacity given by Enbridge for the enhancement of its Mainline and the Southern Lights reversal;
75 per cent of the oil-loading capacity given by CAPP for rail; and 95 per cent of the capacity given by CAPP for the refineries.
22 Canadian Press, “New U.S. Permit to Boost Keystone Pipeline Oil Exports by Next
Year: TC Energy,” JWN, July 30, 2020, https://www.jwnenergy.com/article/2020/7/
new-us-permit-boost-keystone-pipeline-oil-exports-next-year-tc-energy/.
23 Canadian Association of Petroleum Producers, 2019 Crude Oil Forecast, Markets and Transportation,
https://www.capp.ca/wp-content/uploads/2019/11/CAPP-2019-Crude-Oil-Markets-and-
Transportation-338794-1.pdf.
A CORPORATE MAPPING PROJECT REPORT 17Figure 5: Close-up of Figure 4
Existing and proposed Western Canada export takeaway capacity and domestic refinery consumption from Table 3 compared to
Western Canada supply forecasts from Table 2.
Sources: For export capacity data, see notes 10, 15 and 20–22 and Table 3. For Western Canada supply data, see notes 8 and 10–12 and Table 2.
For refinery capacity, see note 10.
Even with a surplus of pipeline export capacity a certain amount of rail would still be used,
given rail’s flexibility in serving markets not accessible by pipeline. In addition to the rail load-
ing capacity, rail shipments may be constrained by the availability of railcars. As noted above, in
February 2020, 411,991 barrels per day were exported by rail, which sets a minimum level for
the current availability of railcars.24
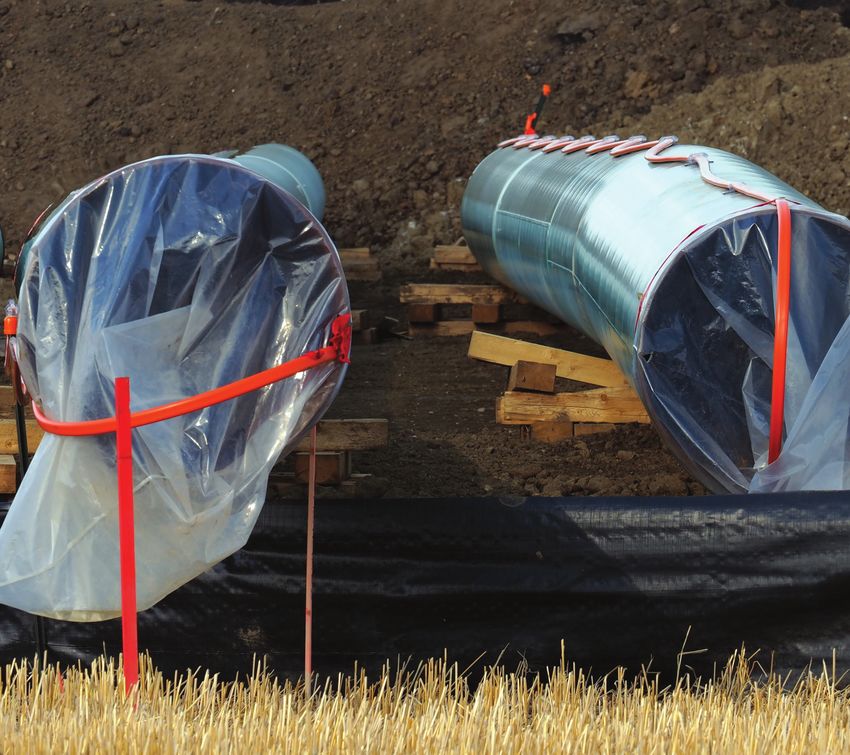
Figure 6 illustrates the need for rail, based on oil supply forecasts and existing and proposed
pipelines and pipeline enhancements (see Tables 2 and 3) —but without the construction of
the TMX or Keystone XL pipelines. With the exception of the CER forecast without the oil sands
emissions cap, only the CAPP forecast requires the full capacity of currently available railcars, and
that is not until 2035. (And if the capacity of the cancelled Frontier mine is subtracted from the
CAPP forecast, much less rail is required than the currently available railcars within the forecast
period.) Given the stated policy of an oil sands emissions cap by the Alberta government, and
the extreme overshoot of Canada’s emissions-reduction targets even with the cap, the CER
forecast without the emissions cap would be extremely unlikely.
24 Canada Energy Regulator, “Canadian Crude Oil Exports by Rail — Monthly Data,” accessed July 21, 2020,
https://www.cer-rec.gc.ca/en/data-analysis/energy-commodities/crude-oil-petroleum-products/statistics/
canadian-crude-oil-exports-rail-monthly-data.html.
18 REASSESSMENT OF NEED FOR THE TRANS MOUNTAIN PIPELINE EXPANSION PROJECTFigure 6: Rail requirements if the TMX and Keystone XL pipelines are not constructed
Sources: For export capacity data, see notes 10, 15 and 20–22 and Table 3. For Western Canada supply data, see notes 8 and 10–12 and Table 2.
For refinery capacity, see note 10.
A CORPORATE MAPPING PROJECT REPORT 19Markets and prices for
Canadian heavy oil
Oil is a globally A KEY NARRATIVE OF GOVERNMENT AND INDUSTRY IS THAT CANADIAN HEAVY OIL shipped to Asia
priced commodity, on TMX will garner higher prices than US exports. This narrative claims that Canadian heavy oil
and prices are is being unfairly discounted by the US.
similar in Asia
In fact, oil is a globally priced commodity, and prices are similar in Asia and the US after adjust-
and the US after ments for quality and transportation costs are factored in. The Western Canada Select (WCS) price
adjustments benchmark for Canadian heavy oil is set at Hardisty, Alberta; and the West Texas Intermediate
for quality and (WTI) benchmark to which WCS is frequently compared is set at Cushing, Oklahoma. WTI is of
transportation a higher quality than WCS, with a quality differential typically from US$6 to US$8 per barrel, and
costs are in addition it costs from US$6 to US$7 per barrel to transport oil by pipeline from Hardisty to
factored in. Cushing. As a result, the WCS benchmark typically averages from US$12 to US$15 per barrel lower
than WTI. This differential — or discount — averaged US$13.74 per barrel over 2019 and the first
half of 2020,25 and CER forecasts a differential of US$12.50 per barrel from 2022 through 2040.26
This discount can vary, however, if there are shipping constraints — as was the case in late 2018
when the differential briefly exceeded US$40 per barrel.27 The discount may also vary due to
supply constraints, as was seen recently due to the economic fallout from the global pandemic.
The pandemic-induced collapse in demand pushed the differential below US$5 per barrel owing
to reduced shipments to complex refineries in the US Midwest and on the Gulf Coast, which are
equipped for heavy-oil refining.28 Heavy, sour crude oil, such as WCS, requires specialized add-
ons to refineries to optimally refine the oil. These include cokers and other equipment, which
significantly increase the refinery construction cost.
25 Government of Alberta, “Oil Prices,” Economic Dashboard, Government of Alberta (website), accessed July
31, 2020, https://economicdashboard.alberta.ca/OilPrice.
26 Canada Energy Regulator, “Assumptions,” Canada’s Energy Future 2019, updated June 24, 2020,
https://www.cer-rec.gc.ca/nrg/ntgrtd/ftr/2019/ssmptns/index-eng.html, Figure 1.
27 Government of Alberta, “Oil Prices,” Economic Dashboard, Government of Alberta (website), accessed July
31, 2020, https://economicdashboard.alberta.ca/OilPrice.
28 Reuters, “Heavy Discount Narrows on Final Day of August Trading,” BOE Report, July 16, 2020,
https://boereport.com/2020/07/16/heavy-discount-narrows-on-final-day-of-august-trading/.
20 REASSESSMENT OF NEED FOR THE TRANS MOUNTAIN PIPELINE EXPANSION PROJECTOnly about 12 per cent of global refinery throughput was heavy, sour crude oil in 2018.29 More Canada provides
than half of this heavy-oil demand was in North America, concentrated in the US Midwest and virtually all
on the Gulf Coast. Table 4 breaks down the demand for heavy oil by region. The US Gulf Coast, heavy-oil supply
which has 29 per cent of the world’s heavy oil refining capacity, has historically relied on Mexico to the US Midwest
and Venezuela for the bulk of its supplies; however, Canada has become increasingly important
because the close
in recent years as supply from these sources decline. Mexico’s production of heavy oil has been
proximity is a
in terminal decline since peaking in 2004, and Venezuela’s production has long been in decline
transportation
owing to both lack of investment and political disruptions. The recent embargo by the US of
cost advantage,
Venezuela has completely cut off further imports. Figure 7 illustrates US imports of heavy, sour
crude oil by country and importing region.
and is increasing
its supply to the
Canada provides virtually all heavy-oil supply to the US Midwest because the close proximity is a US Gulf Coast.
transportation cost advantage, and is increasing its supply to the US Gulf Coast.
Table 4: Global demand for heavy oil by region in 2018
Region % of global demand Million barrels per day
US Gulf Coast 29% 2.79
Elsewhere in North America 26% 2.51
Asia 23% 2.22
Europe 7% 0.67
Commonwealth independent states 3% 0.29
Middle East 7% 0.67
Latin America 5% 0.48
Total 100% 9.64
Source: Data from IHS Markit (see note 29).
29 IHS Markit, Looking North: A US Perspective on Canadian Heavy Oil (London, UK: IHS Markit, 2018),
https://ihsmarkit.com/products/energy-industry-oil-sands-dialogue.html.
A CORPORATE MAPPING PROJECT REPORT 21Figure 7: US imports of heavy, sour crude oil by country to the Midwest and Gulf Coast, 2010–2020
Source: Data from Energy Information Agency’s U.S. Crude Import Tracking Tool (accessed July 2, 2020), https://www.eia.gov/petroleum/
imports/browser/#/?vs=PET_IMPORTS.WORLD-US-ALL.A.
22 REASSESSMENT OF NEED FOR THE TRANS MOUNTAIN PIPELINE EXPANSION PROJECTReduced netbacks
for exports to Asia
A PRINCIPAL NARRATIVE OF GOVERNMENT AND INDUSTRY in justifying the construction of TMX The fact that
is that the increased tidewater access will yield higher netbacks (profit after accounting for pro- complex refineries
duction and shipping costs) for Canadian producers compared with US exports. We can evaluate designed to
this narrative by comparing the price of heavy, sour crude oil sold to the US and the Far East, and process heavy oil
the transportation costs involved to each destination. are concentrated
Mexican Maya is a heavy, sour crude oil, comparable to WCS in quality (in terms of API (American
in the US means
Petroleum Institute) gravity and sulphur content), that is traded globally. Roughly 60 per cent of that the US on
Maya exports from Mexico in recent years went to the US (mainly to the Gulf Coast), 25 per cent average pays
to Europe and 15 per cent to the Far East.30 WCS sold on the US Gulf Coast or in the Far East a premium
would fetch prices comparable to Maya. compared with
the Far East, which
Table 5 illustrates the price paid for Maya cargoes bound for the US (mainly the Gulf Coast,
has less processing
although some Maya is imported by California) and the Far East. The price paid for US-bound
capacity.
cargoes has averaged US$1.90 per barrel above the price paid for Far East–bound cargoes
over the 2010–2020 period, and has averaged US$4.27 per barrel above the Far East over the
2014–2020 period.31
The price data for Mexican Maya in recent years tells us that Canadian heavy oil exported to Asia
is likely to command a lower price than if sold to the US. This is to be expected given that oil is
a globally traded and priced commodity, and once quality differences and transportation costs
are accounted for, oil should trade at roughly similar prices everywhere. In the case of heavy oil,
however, the fact that complex refineries designed to process heavy oil are concentrated in the
US means that the US on average pays a premium compared with the Far East, which has less
processing capacity. (Heavy oil has higher yields of diesel and certain other products compared
with the medium and light oil processed in conventional refineries.)
30 Pemex, Statistical Yearbook 2018 (Mexico City, Mexico: Pemex, 2019), https://www.pemex.com/en/
investors/publications/Anuario%20Estadstico%20Archivos/statisticalyearbook2018.pdf. See years 2010 to
2018. “Petroleum Statistics May 2020,” Investors, Pemex, accessed May 2020, https://www.pemex.com/
en/investors/publications/Paginas/petroleum-statistics.aspx. See years 2019 and 2020; 2020 is based on
the average of January through May.
31 Ibid.
A CORPORATE MAPPING PROJECT REPORT 23Table 5: Price of Mexican Maya heavy, sour crude oil, 2010-2020
Table 5 compares the price of Maya crude in cargoes purchased in Mexico bound for the US and for the
Far East and shows the price difference, in US dollars per barrel.
US Far East US minus Far East
2010 $70.22 $74.27 -$4.05
2011 $98.36 $101.41 -$3.05
2012 $99.66 $101.48 -$1.82
2013 $96.82 $96.88 -$0.06
2014 $85.77 $78.02 $7.75
2015 $43.45 $36.07 $7.38
2016 $36.20 $34.63 $1.57
2017 $46.88 $46.54 $0.34
2018 $62.62 $60.07 $2.55
2019 $57.09 $54.21 $2.88
2020* $32.84 $25.45 $7.39
Average discount in Far East 2014–2020 $4.27
Average discount in Far East 2010–2020 $1.90
Sources: Data from Pemex, Statistical Yearbook 2018; and “Petroleum Statistics May 2020” (see note 30).
*Average of January through May 2020.
Another important consideration in determining netbacks for Canadian producers is transpor-
tation cost. Would transportation from Edmonton to the Westridge terminal on TMX and tanker
transport to Asia cost less than transport from Hardisty, Alberta, to the US Midwest and Gulf
Coast? Table 6 summarizes the pipeline and tanker tolls to each destination. Tolls are from the
2013 Kinder Morgan application for TMX.32 As noted in this application, tolls are adjusted by
CAD$0.07 per barrel for each $100 million increase in the cost of the pipeline expansion. As dis-
cussed above, the cost of the expansion has increased from CAD$5.4 billion when proposed in
2013 to the most recent estimate of CAD$12.6 billion. All prices in Table 6 have been adjusted for
inflation and converted to 2019 dollars. The cost of tanker transport from the Westridge terminal
to south China is from the 2015 Muse Stancil report filed by Kinder Morgan.
32 Trans Mountain Pipeline ULC, “Final Form of the FSA,” Appendix 7 (A3E7D3) in Application for Approval
of the Transportation Service and Toll Methodology for the Expanded Trans Mountain Pipeline System
(RH-001-2012), January 10, 2013, https://apps.neb-one.gc.ca/REGDOCS/File/Download/902023, 10;
and Trans Mountain Pipeline ULC, “Final form of the FSA — TSA Schedules,” Appendix 9 (A3E7D5) in
Application for Approval of the Transportation Service and Toll Methodology for the Expanded Trans
Mountain Pipeline System (RH-001-2012), revised January 10, 2013, https://apps.neb-one.gc.ca/
REGDOCS/File/Download/901941.
24 REASSESSMENT OF NEED FOR THE TRANS MOUNTAIN PIPELINE EXPANSION PROJECTTable 6: Tolls for transporting Canadian heavy oil to south China compared to the US Midwest or Gulf Coast,
with toll-price penalties for selling to Asia
Toll (in USD, 2019) Toll (in USD, 2019)
with initial cost estimate of with final cost estimate of
CAD$ 6 billion for TMX CAD$ 12.6 billion for TMX
Edmonton to Westridge terminal
20-year heavy-oil open-season toll limita >75 kbdb $4.42 $8.11
20-year heavy-oil indicative fixed + variable tollc >75 kbd $3.58 $7.27
Tanker voyage from Westridge terminal to South China
Muse Stancil (2015) Cold Lake blend heavy oil in 2019 $4.21
Total tolls from Edmonton to South China
20-year heavy-oil open-season toll limit >75 kbd $8.63 $12.32
20-year heavy-oil indicative fixed + variable toll >75 kbd $7.79 $11.48
Hardisty, AB, to the US Midwest
Enbridge Mainline heavy oil >80 kbd
$5.58
(as of May 2020, Hardisty to Ohio or Michigan)
CAPP 2019 heavy oil (Hardisty to Chicago) $4.40
Hardisty, AB, to the US Gulf Coast
CAPP 2019 (via Enbridge/Seaway pipeline) 15-year, 50+ kbd
$9.60
committed volumes
CAPP 2019 (via Keystone/TC Energy) $8.80
Toll-price penalty for selling to Asia, with final cost estimate for TMX
Midwest (Ohio or Michigan) versus south China (open-season toll limit) $6.74
Midwest (Ohio or Michigan) versus south China (indicative fixed +
$5.90
variable toll)
Midwest (Chicago) versus south China (open-season toll limit) $7.92
Midwest (Chicago) versus south China (indicative fixed + variable toll) $7.08
US Gulf Coast via Enbridge Seaway pipeline versus south China
$2.72
(open-season toll limit)
US Gulf Coast via Enbridge Seaway pipeline versus south China
$1.88
(indicative fixed + variable toll)
US Gulf Coast via Keystone/TC Energy versus south China
$3.52
(open-season toll limit)
US Gulf Coast via Keystone/TC Energy versus south China
$2.68
(indicative fixed + variable toll)
Sources: Data about tolls from Hardisty to Ohio or Michigan are from Enbridge, International Joint Rate Tariff, CER No. 475/FERC No. 37.13.0 (Calgary,
AB: Enbridge, 2020), https://www.enbridge.com/~/media/Enb/Documents/Tariffs/2020/CDMN%20CER%20475%20FERC%2037130%20
TLD%20LKH.pdf; tolls from Hardisty to Chicago or Gulf Coast are from CAPP (see note 10); tolls from Edmonton to Westridge Terminal are
from Trans Mountain Pipeline ULC (see note 32); and tanker tolls are from Muse Stancil, Market Prospects and Benefits Analysis of the Trans
Mountain Expansion Project for Trans Mountain Pipeline (ULC) (Addison, TX: Muse Stancil, 2015), https://apps.neb-one.gc.ca/REGDOCS/File/
Download/2825856, 62, Table A-3.
a Open-season toll limit as defined by Kinder-Morgan (see footnote 32).
b kbd = thousand barrels per day.
c Indicative fixed + variable toll as defined by Kinder-Morgan (see footnote 32).
A CORPORATE MAPPING PROJECT REPORT 25Depending on the toll type and pipeline route, transportation costs to south China are from
US$1.88 to US$3.52 per barrel more expensive than to the US Gulf Coast, and from US$ 5.90 to
Canadian US$7.92 per barrel more expensive than to the US Midwest. Adding the difference in transpor-
producers are tation cost to the discount in price selling to Asia compared to the US, and the netback loss per
likely to lose barrel to Canadian producers by selling heavy oil to Asia is US$4 to US$6 per barrel or more.
money if their
Thus, the government and industry narrative that Canadian producers will have higher netbacks
oil is transported
because of TMX is not supported by the evidence. Canadian producers are in fact likely to
via TMX to Asia. lose money if their oil is transported via TMX to Asia. Very little heavy oil on the existing Trans
Mountain pipeline is transported to Asia. Instead, seaborne shipments go primarily to the West
Coast of the US, which confirms the fact that there is no bonanza for shippers in Asia.
26 REASSESSMENT OF NEED FOR THE TRANS MOUNTAIN PIPELINE EXPANSION PROJECTConclusion
THERE HAVE BEEN SIGNIFICANT NEW DEVELOPMENTS THAT BEAR ON THE NEED for TMX since the Emissions from
government purchased the project in 2018 and approved it for the second time in 2019. These the oil and gas
include: sector alone
• Announced expansions and optimizations of existing pipelines that will increase export are on track to
capacity over the next two to three years, including the Enbridge mainline, and the exceed Canada’s
Aurora-Rangeland, Keystone and Express pipelines. emissions
• The reversal of the Southern Lights pipeline for export use in 2023. reduction target
in 2050 by 81
• The likely completion of the Line 3 expansion project in 2021.
per cent.
• The release of new production forecasts since June 2019, by the Canada Energy Regulator
(CER, formerly the National Energy Board), Alberta Energy Regulator (AER), Canadian
Association of Petroleum Producers (CAPP) and International Energy Agency (IEA).
• The release of the latest update of Alberta’s Oil Sands Emissions Limit Act in January 2020.
• The release of Canada’s 2020 emissions report by economic sector which allows an up-
dated assessment of future emissions from the oil and gas sector and compliance with
Alberta’s 2020 Oil Sands Emissions Limit Act.
• The increase in the cost of the TMX project from $7.4 billion when it was purchased in
2018 to $12.6 billion in February 2020, which will significantly increase shipping costs
for Canadian producers selling oil to Asia compared to US exports.
• The COVID-19 pandemic of 2020 which has resulted in an unprecedented decline in the
demand for oil and is likely to reduce demand in the longer term.
Key conclusions of this report are as follows:
1. Emissions from the oil and gas sector alone are on track to exceed Canada’s emissions
reduction target in 2050 by 81 per cent — even with a 100 megatonne (Mt) per year
cap on oil sands emissions (as evidenced from the latest CER oil and gas production
forecast, coupled with the latest Environment Canada emissions report). Without the
cap, emissions from the oil and gas sector would exceed this target by 101 per cent.
2. The increase in oil production forecast by CER (with an oil sands emissions cap), AER,
CAPP and IEA can easily be accommodated for the next decade with existing pipelines,
including announced optimizations and the Line 3 expansion, without rail or the TMX
and Keystone XL pipelines. These forecasts, however, substantially overstate likely pro-
A CORPORATE MAPPING PROJECT REPORT 27You can also read