A mass-balance-based emission inventory of non-methane volatile organic compounds (NMVOCs) for solvent use in China
←
→
Page content transcription
If your browser does not render page correctly, please read the page content below
Atmos. Chem. Phys., 21, 13655–13666, 2021
https://doi.org/10.5194/acp-21-13655-2021
© Author(s) 2021. This work is distributed under
the Creative Commons Attribution 4.0 License.

A mass-balance-based emission inventory of non-methane volatile
organic compounds (NMVOCs) for solvent use in China
Ziwei Mo1, , Ru Cui2,3, , Bin Yuan2,3 , Huihua Cai4 , Brian C. McDonald5 , Meng Li5,6 , Junyu Zheng2,3 , and
Min Shao2,3
1 Schoolof Atmospheric Sciences, Sun Yat-sen University, Zhuhai 519082, China
2 Institute
          for Environmental and Climate Research, Jinan University, Guangzhou 511443, China
3 Guangdong–Hongkong–Macau Joint Laboratory of Collaborative Innovation for Environmental Quality,

Guangzhou 511443, China
4 Guangdong Polytechnic of Environmental Protection Engineering, Foshan 528216, China
5 Chemical Sciences Laboratory, NOAA Earth System Research Laboratories, Boulder, CO, USA
6 Cooperative Institute for Research in Environmental Sciences, University of Colorado, Boulder, CO, USA
 These authors contributed equally to this work.

Correspondence: Bin Yuan (byuan@jnu.edu.cn) and Min Shao (mshao@pku.edu.cn)

Received: 14 December 2020 – Discussion started: 15 March 2021
Revised: 2 July 2021 – Accepted: 11 August 2021 – Published: 14 September 2021

Abstract. Non-methane volatile organic compounds               in 2017, respectively. Our results and previous inventories
(NMVOCs) are important precursors of ozone (O3 ) and           are generally comparable within the estimation uncertainties
secondary organic aerosol (SOA), which play key roles          (−27 %–52 %). However, there exist significant differences
in tropospheric chemistry. A huge amount of NMVOC              in the estimates of sub-categories. Personal care products
emissions from solvent use are complicated by a wide           were a significant and quickly rising source of NMVOCs,
spectrum of sources and species. This work presents a          which were probably underestimated in previous inventories.
long-term NMVOC emission inventory of solvent use              Emissions from solvent use were growing faster compared
during 2000–2017 in China. Based on a mass (material)          with transportation and combustion emissions, which were
balance method, NMVOC emissions were estimated for six         relatively better controlled in China. Environmentally
categories, including coatings, adhesives, inks, pesticides,   friendly products can reduce the NMVOC emissions from
cleaners, and personal care products. The results show that    solvent use. Supposing all solvent-based products were sub-
NMVOC emissions from solvent use in China increased            stituted with water-based products, it would result in 37 %,
rapidly from 2000 to 2014 then kept stable after 2014. The     41 %, and 38 % reduction of emissions, ozone formation
total emission increased from 1.6 Tg (1.2–2.2 Tg at 95 %       potential (OFP), and secondary organic aerosol formation
confidence interval) in 2000 to 10.6 Tg (7.7–14.9 Tg) in       potential (SOAP), respectively. These results indicate there
2017. The substantial growth is driven by the large demand     is still large potential for NMVOC reduction by reducing the
for solvent products in both industrial and residential        utilization of solvent-based products and implementation of
activities. However, increasing treatment facilities in the    end-of-pipe controls across industrial sectors.
solvent-related factories in China restrained the continued
growth of solvent NMVOC emissions in recent years.
Rapidly developing and heavily industrialized provinces
such as Jiangsu, Shandong, and Guangdong contributed sig-      1   Introduction
nificantly to the solvent use emissions. Oxygenated VOCs,
                                                               Air pollution has caused wide public attention because of its
alkanes, and aromatics were the main components, account-
                                                               adverse effect on human health (Nel, 2005). The high con-
ing for 42 %, 28 %, and 21 % of total NMVOC emissions
                                                               centrations of ozone (O3 ) and fine particles (PM2.5 ) are the

Published by Copernicus Publications on behalf of the European Geosciences Union.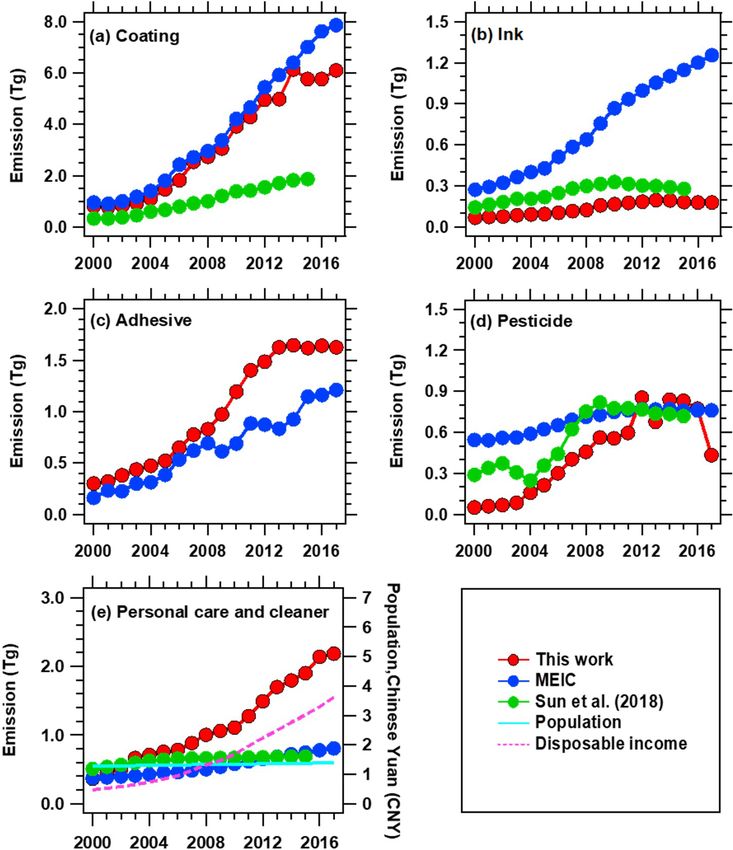
13656                                                           Z. Mo et al.: A mass-balance-based emission inventory of VOCs

main reasons for heavy pollution episodes in urban areas              several times for automobile coating (2.43–21.2 kg/vehicle)
(MEEPRC, 2019). As the precursors of O3 and secondary                 (Bo et al., 2008; Wu et al., 2016; Zhong et al., 2017). Emis-
organic aerosol (SOA), non-methane volatile organic com-              sions from domestic solvent use were always estimated by an
pounds (NMVOCs) become the key pollutants targeted for                emission factor with a unit of kilograms per capita. However,
priority control (Hao and Xie, 2018; Nishanth et al., 2014).          a recent study questioned the accuracy of using national pop-
China is the hotspot of NMVOC emissions across the world.             ulation to estimate the solvent use emissions (Pearson, 2019).
The total NMVOC emissions have increased rapidly in recent               Unlike the EF-based estimation, the mass balance or ma-
decades (Li et al., 2019; Simayi et al., 2019; Sun et al., 2018;      terial balance (MB) approach provides reliable average emis-
S. X. Wang et al., 2014; Wei et al., 2011b; Wu et al., 2016).         sion estimates for specific sources in developing emission
Reducing NMVOC emissions is of the utmost importance for              inventory for solvent use (U.S. EPA, 1995). This technique
tackling air pollution problems in megacities of China (Jin           involves quantification of chemical material flows going into
and Holloway, 2015; Yuan et al., 2013).                               and out of a process, where the total discharges to the envi-
    There are various anthropogenic sources of NMVOC                  ronment are estimated by input and output information based
emissions including industrial processes, fossil fuel combus-         on the mass conservation principle. The MB technique was
tion, biomass burning, traffic emissions, and solvent utiliza-        used to update NMVOC emission estimates for solvent prod-
tion (Li et al., 2015). Multiple emission inventories have            ucts in the United States, which were validated by ambi-
been established to quantify NMVOC emissions for China                ent NMVOC measurements (McDonald et al., 2018). The
(Li et al., 2019; Sun et al., 2018; Wei et al., 2011b). The total     successful application of the MB technique for the solvent-
NMVOC emissions were estimated to increase from 19.4 Tg               related sources provides important support in developing
in 2005 to 23.2 Tg in 2015 (Wei et al., 2011b). A more re-            more accurate emission inventories. Currently, there is still a
cent inventory suggested that NMVOC emissions increased               lack of NMVOC emission inventories specialized in solvent
from 9.8 to 28.5 Tg between 1990 and 2017 (Li et al., 2019).          use in China. In view of large discrepancies among differ-
The unprecedented increase in NMVOC emissions in China                ent studies, re-evaluation of NMVOC emission estimates are
is largely attributed to the fast urban and industrial expansion.     needed for solvent use in China using the MB technique.
In particular, NMVOC emissions from solvent use sectors                  This study focuses on six categories of solvent products
were reported to triple over the past three decades, becoming         used in residential and industrial activities including coat-
the largest emission source in China (Li et al., 2019).               ings, inks, adhesives, pesticides, cleaners, and personal care
    Emission estimates for solvent use are challenging be-            products. The MB technique is adopted to estimate NMVOC
cause of the wide spectral of stationary and fugitive sources.        emissions from these solvent products between 2000 and
Compared with other key NMVOC sources such as trans-                  2017 in China. Incorporating the source profiles, speciated
portation and fossil fuel combustion, NMVOC emissions                 NMVOC emissions for each solvent product are obtained.
from solvent use have larger uncertainties among different            Estimated NMVOC emissions from solvent use in this study
emission inventories. The estimated emissions were in the             are compared with other studies and other sources. Finally,
range of 1.9–5.8 Tg from solvent use while they were 4.9–             implications for NMVOC emission abatement in China are
6.1 Tg from transportation and 4.8–7.7 Tg from combustion             discussed in terms of ozone formation potential (OFP) and
for the year of 2005 (Bo et al., 2008; Li et al., 2019; Sun et al.,   secondary organic formation potential (SOAP).
2018; S. X. Wang et al., 2014; Wei et al., 2008, 2011b). The
large uncertainty in solvent use emissions results from dif-
ferent source categories and different emission factors (EFs)         2     Methods and data
in these estimations. Specifically, coatings are identified as
an emission category in solvent use sources. However, the             2.1    Emission estimation
sub-categories of coatings are inconsistent among different
studies (Sun et al., 2018; Wu et al., 2016; Yin et al., 2015). It     Six types of organic solvent products are considered in this
is unclear whether the emission inventories considered all of         study, including coatings, inks, adhesives, pesticides, clean-
the industrial sectors associated with coatings. Adhesives are        ers, and personal care products (Level 1). Coatings, inks, and
another important category of solvent use sources. Neverthe-          adhesives are further classified based on application fields
less, this category was missing in some emission inventories,         and/or technologies (Level 2) and solvent types (Level 3).
or only shoe-making was considered among a number of sub-             Pesticides include herbicides, insecticides, bactericides, and
categories for adhesives (Bo et al., 2008; Sun et al., 2018;          other pesticides. Cleaners include laundry, dishwashing, sur-
Wu et al., 2016; Yin et al., 2015). In addition, non-industrial       face cleaner, and industrial detergents. Personal care prod-
solvent use such as pesticide or domestic solvents were usu-          ucts are divided into four sub-categories: hair and body care,
ally not accounted for in the emission inventories (Bo et al.,        perfumes, skin care, and other cosmetics.
2008; Fu et al., 2013). Apart from the differences in cate-              Organic compounds in solvent products have dif-
gories of solvent use, the emission factors used in different         ferent volatilities, which can be characterized by ef-
studies varied significantly. For example, the EFs differed           fective saturation concentration C∗ . Organic compounds

Atmos. Chem. Phys., 21, 13655–13666, 2021                                             https://doi.org/10.5194/acp-21-13655-2021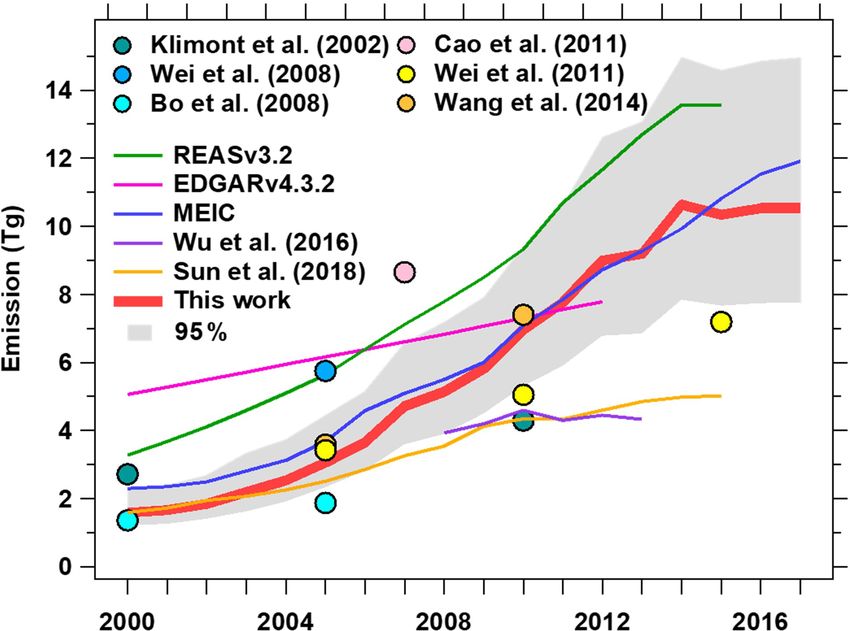
Z. Mo et al.: A mass-balance-based emission inventory of VOCs                                                              13657

can be classified into three categories according to the          ings, inks, adhesives, pesticides and cleaners, and personal
range of effective saturation concentration, namely high-         care products, respectively. Taking architectural coatings as
volatility organic compounds (VOCs: C∗ >3 × 10⁶ µg m−3 ),         an example, the VOC content of solvent- and water-based
intermediate-volatility organic compounds (IVOCs: C∗ =            coatings are obtained on two national standards (GB) for
0.3 to 3 × 10⁶ µg m−3 ) and semi-volatile organic compounds       VOC emission restrictions in China – GB18582-2008 and
(SVOCs: C∗
13658                                                       Z. Mo et al.: A mass-balance-based emission inventory of VOCs

  Then, the provincial emissions are calculated using             3     Results
Eq. (3).
                                                                  3.1    Control of NMVOC emissions
     X Tm
Em =   P · Ei ,                                            (3)
     i
        Tm                                                        The control on NMVOC emissions from solvent use were not
            m
                                                                  widely implemented in China before 2010. To slow down the
where Em is the emissions from solvent use in province m;         rapid growth in NMVOC emissions in China, the Action Plan
Ei is the emissions of solvent product i at the nation level;     for Air Pollution Prevention and Control issued by the State
and Tm is the cultivated land area, disposable income, sales      Council of China in 2013 explicitly proposed implementing
value, or building area completed in province m.                  control of NMVOC emissions from the solvent use industrial
                                                                  sources, including coatings but not the architectural coating,
2.3   Estimation of speciated emissions, OFP, and SOAP            inks, industrial adhesives (woodworking, paper converting,
                                                                  shoemaking, fiber processing, packaging, and labeling), and
Speciated NMVOC emissions are calculated by allocating            industrial detergent considered in this study (Table S7). As
the source profiles to the corresponding emission sources.        the result, control measures are required to be installed for
Source profiles of solvents use used in this study are ob-        NMVOC-emitting industrial facilities related to solvent use
tained by combining domestic profiles (e.g., H. L. Wang et        in China. The percentage of solvent use industrial facilities
al., 2014; Yuan et al., 2010) and foreign profiles (McDon-        with treatment devices (Cn in Eq. 1) has increased quickly
ald et al., 2018), following the methods proposed by Li et        in the recent years. Note that the NMVOC control technol-
al. (2014). Data sources and procedures of compiling the          ogy is still developing and not mature in China. At this time,
composite profiles of architectural coating, furniture coating,   limited information is available to determine control technol-
automobile coating, other coating, offset printing ink, letter-   ogy by specific sectors and solvent products. The percentage
press printing ink, gravure printing ink, other printing ink,     of solvent use factories with treatment facilities was deter-
shoemaking adhesive, and herbicide are provided in Text S1        mined to be 50 % in 2015 based on detailed surveys filed
and Figs. S3–S12. For products lacking a domestic source          in the centers of solvent product manufacturing in China –
profile, foreign source profiles were used.                       the Yangtze River Delta (YRD) (Lu et al., 2018; Yang et al.,
   The emissions of individual NMVOC species can be es-           2017) and Pearl River Delta (PRD) regions (Gao et al., 2015;
timated by multiplying the total NMVOC emissions by the           Cai, 2016). Considering that exhaust gas treatment levels of
weight percentage of each species, as shown in Eq. (4).           different regions are close (MEEPRC, 2017), this value is
                                                                  adopted to represent the whole country. A drastic increase
       X
Ej =       Ei × fi,j ,                                      (4)
        i                                                         (by a factor of over 15) in the annual production values for
                                                                  the organic exhaust gas treatment industry was also recorded
where Ej is the emissions of species j from all sources, Ei       between 2013 and 2017 (EGPCCEPIA, 2008–2017). Due to
is total NMVOC emissions from organic solvent product i,          50 % of solvent use factories installing treatment facilities in
and fi,j is the weight percentage of species j in the emission    2015 and the fast growth of production values for organic
of product i.                                                     exhaust gas treatment devices, we estimated the percentage
   The OFP represents the maximum ozone contribution of           of treatment facilities installed in the industrial solvent sec-
NMVOC species, which can help identify the key reactive           tor for other years, assuming slow (1 %), moderate (3.3 %),
species and sources for ozone formation. The OFP of indi-         and fast (10 %–15 %) increase rates of the percentage be-
vidual species can be calculated using Eq. (5).                   fore 2010, between 2010–2013, and after 2013, respectively
OFPj = Ej × MIRj ,                                         (5)    (Fig. 1). We then used the estimated percentage with treat-
                                                                  ment facilities as Cn in Eq. (1).
where OFPj is the OFP of species j , Ej is the emissions of          For the treatment facilities, the control efficiency varied
species j , and MIRj is the maximum incremental reactivity        significantly by adopted different technology, such as ad-
(MIR) of species j (Carter, 2010).                                sorption, absorption, catalytic combustion, photolysis, and
   The SOAP indicates the SOA formation ability of differ-        plasma. Here, we determined averaged control efficiency
ent NMVOC species, which can be characterized by SOA              (ηavg ) based on the market shares of VOC control tech-
yield (McDonald et al., 2018). Then, the SOAP of individual       niques (fn ) and their control efficiency (ηn ) (Table S10) us-
species can be calculated using Eq. (6).                          ing Eq. (7).
                                                                          X
SOAPj = Ej · YSOA,j ,                                      (6)    ηavg =       fn × η n                                        (7)
                                                                            n
where SOAPj is the SOAP of species j and YSOA,j is the
SOA yield of species j . A list of the species and their MIR      The market share of NMVOC control techniques and their
and SOA yield values used in this study can be found in Ta-       control efficiency were collected from field surveys in the
ble S9.                                                           YRD and PRD regions (Lu et al., 2018; Cai, 2016). The aver-

Atmos. Chem. Phys., 21, 13655–13666, 2021                                         https://doi.org/10.5194/acp-21-13655-2021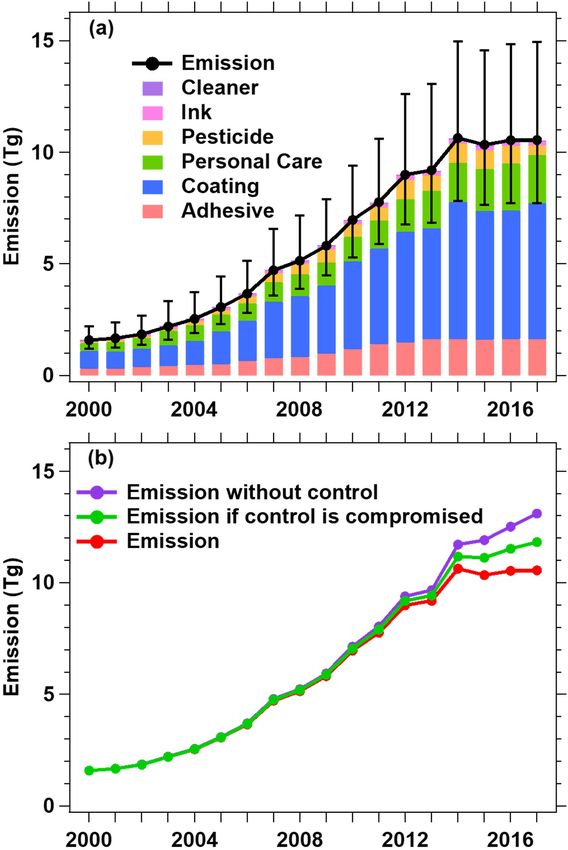
Z. Mo et al.: A mass-balance-based emission inventory of VOCs 13659
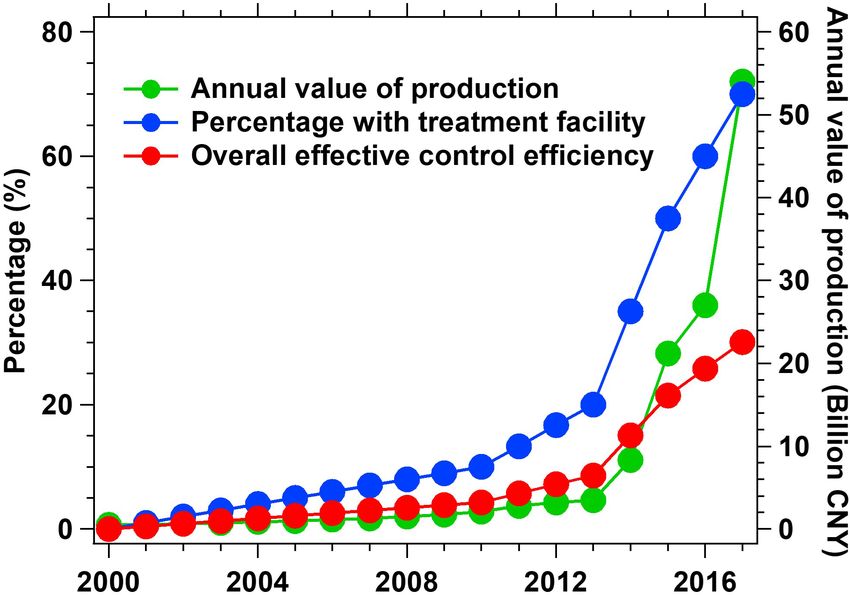
Figure 1. The annual value of production for the organic exhaust
gas treatment industry, percentage with treatment facility installed
for solvent-relating factories, and the overall effective control effi-
ciency for NMVOC emissions from industrial solvent use factories
in China.
age control efficiency was determined to be about 43 % based
on the two surveys. Finally, the overall effective control effi-
ciency (Cn × ηavg ) for different years is shown in Fig. 1 and
Table S11. The overall efficiency for industrial solvent use fa-
cilities increased moderately before 2010, with values of less
Figure 2. (a) Annual NMVOC emissions from solvent use from
than 5 %. It increased faster from 2013 at 9 % and reached
2000 to 2017 in China. (b) Three scenarios are considered: emission
30 % in 2017.
without control; emission if control is compromised considering the
lack of manual maintenance of facility; emission considering the
3.2 Total NMVOC emissions real maintenance practice of NMVOC control.
The estimated annual emissions of solvent NMVOCs in
China between 2000 and 2017 are shown in Fig. 2 and Ta-
ble S12. NMVOC emissions were found to continuously in- trol efficiency. This would be more easily achieved by adopt-
crease from 2000 to 2014 but reached a plateau afterwards. ing the NMVOC control techniques with better control effi-
The total NMVOC emissions were estimated to be 1.6 Tg ciency (e.g., catalytic combustion), as most of the industrial
(1.2–2.2 Tg at 95 % confidence interval) in 2000, increasing NMVOC facilities already have treatment facilities (70 % in
(by a factor of 6.7) to 10.6 Tg (7.7–14.9 Tg) in 2017. We 2017).
also considered another two scenarios to investigate the ef- On the basis of the best estimate of NMVOC emis-
fect of control measures in the reduction of NMVOC emis- sions, coating was the major contributor to the total solvent
sions: emission without any control (scenario 1) and emis- NMVOC emissions in most years (42 %–58 % of total emis-
sion if control efficiency is compromised by 50 % (sce- sion during 2000–2017). The NMVOC emissions from coat-
nario 2), which represents widespread lack of maintenance ings reached 6.1 Tg in 2017, an increase of 5.3 Tg (660 %)
in NMVOC treatment facilities and/or stopping running of compared with those (0.8 Tg) in 2000. Personal care products
treatment facilities to save costs. In both scenarios, contin- (emitting 2.2 Tg NMVOCs in 2017) ranked second in the
uous growth of NMVOC emissions from 2000 to 2017 was contributions to NMVOC emissions, which lacked compre-
observed. NMVOC emissions in 2017 for the two scenarios hensive estimates in previous inventories. (Wu et al., 2016;
were estimated to be 13.1 and 11.8 Tg, significantly higher Fu et al., 2013; Wei et al., 2008; Bo et al., 2008). Following
than the estimates considering the real maintenance practice were adhesives emissions, increasing from 0.3 Tg in 2000 to
of NMVOC control (i.e., the best estimate). These results in- 1.6 Tg in 2017. It was commonly used in shoemaking and
dicate the importance of NMVOC control measures in pre- furniture manufacturing, which were fast-developing indus-
venting the fast increase in NMVOC emissions from indus- tries in China. Pesticides were also an important source of
trial solvent use. The overall effective control efficiency in NMVOC emissions from solvent use, accounting for 3 %–
industrial NMVOC emissions was estimated to be only 30 %, 10 % of total emissions. Apart from coatings, personal care
leaving significant room to further increase the overall con- products, adhesives, and pesticides, NMVOC emissions from
https://doi.org/10.5194/acp-21-13655-2021 Atmos. Chem. Phys., 21, 13655–13666, 2021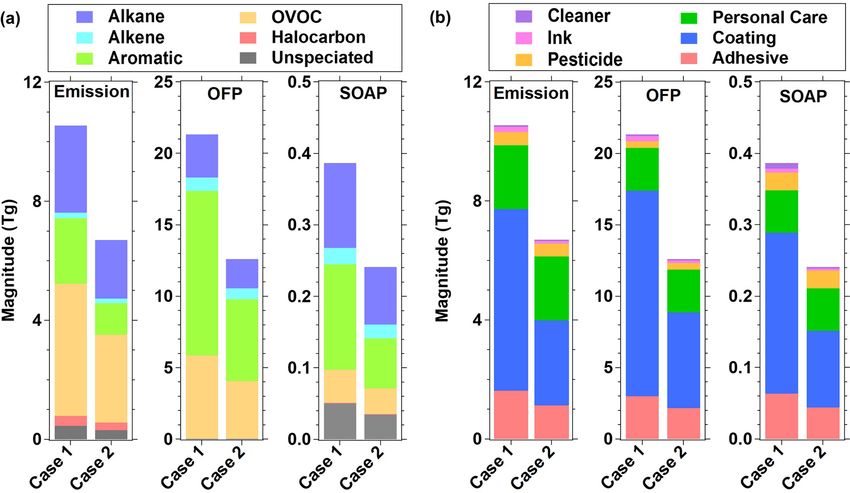
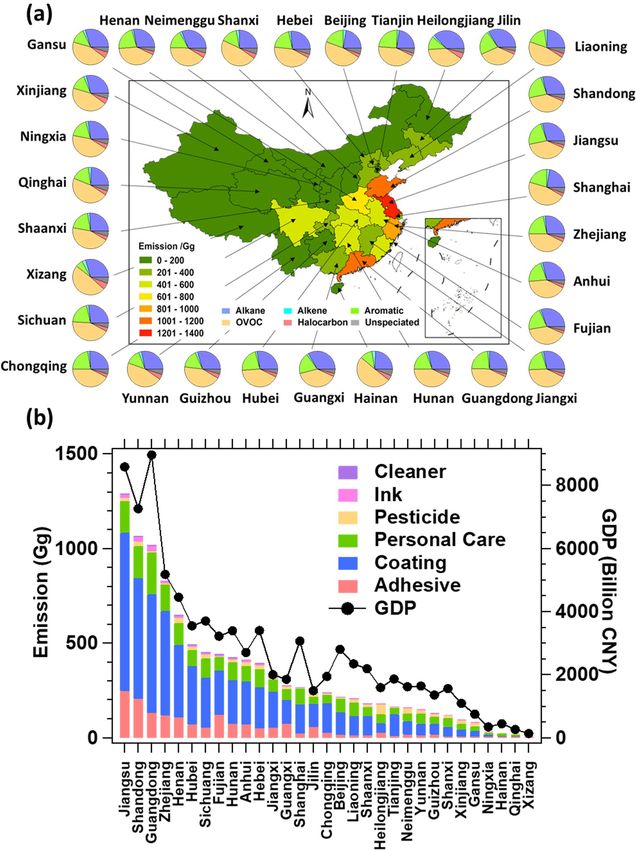
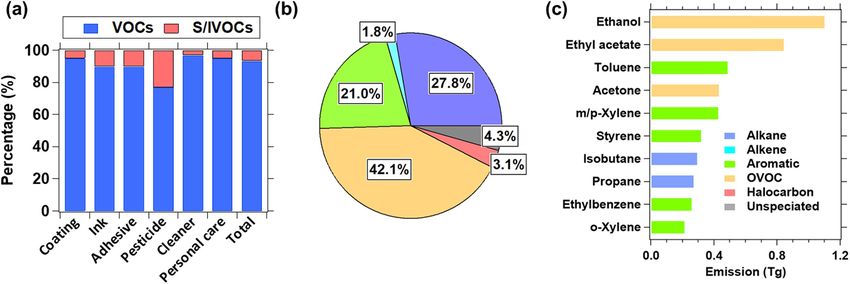
13660                                                        Z. Mo et al.: A mass-balance-based emission inventory of VOCs

inks and cleaning agents accounted for a small proportion
(2 %–5 %) of total solvent NMVOC emissions. In particular,
the production of cleaners was large in China, approaching
13 Tg in 2017. However, in view of the low solvent content
of most cleaning agents and their treatment processes (e.g.,
most S/IVOCs entered the sewage system), NMVOC con-
tent is less than 1 % in the cleaning agent (0.005g VOC g−1
cleaning agent in 2017). Emissions from industrial solvent
use were dominant (56 %) in 2017 due to the huge industrial
demand for adhesives and coatings in China. About 82 %
of NMVOCs from non-industrial sources were caused by
architectural coatings and personal care products. In sum-
mary, coatings, personal care products, adhesives, and pesti-
cides were four major NMVOC emission products, account-
ing for more than 95 % of total emissions, suggesting that
these products are key solvent sources for NMVOC control
in China.

3.3   Provincial emissions

Provincial emissions and their contributions by source in
2017 are shown in Fig. 3. Jiangsu, Shandong and Guangdong
provinces contributed the most in China, emitting 1.3 Tg
(12.2 % of solvent NMVOC emissions in China), 1.1 Tg
(10.1 %), and 1.0 Tg (9.7 %) NMVOCs, respectively. Coat-
ings dominated in the emissions of the three provinces,
accounting for 65 %, 60 %, and 61 % of solvent NMVOC
emissions in Jiangsu, Shandong, and Guangdong. Similarly,          Figure 3. (a) Spatial distributions of solvent use NMVOC emissions
with coatings as the major contributor, Zhejiang, Henan,           in China and (b) their source contributions in different provinces in
Hubei, Sichuan, Fujian, Hunan, and Anhui were also on              2017.
the top 10 list of NMVOC emissions. These provinces are
mainly located in the eastern and middle areas of China,
where the economy is developing fast and industrial activi-        cide emissions were much smaller than those of coatings and
ties are densely distributed, which are driving factors for high   adhesives (Fig. 2), total S/IVOC emissions were not signifi-
NMVOC emissions. By contrast, Xinjiang, Gansu, Ningxia,            cant (20 %) in pes-         vidual species (Fig. 4c), the top 10 species of emission were
ticides compared with other products (Table S7). As pesti-         ethanol (1.1 Tg), ethyl acetate (0.8 Tg), toluene (0.5 Tg), ace-

Atmos. Chem. Phys., 21, 13655–13666, 2021                                           https://doi.org/10.5194/acp-21-13655-2021
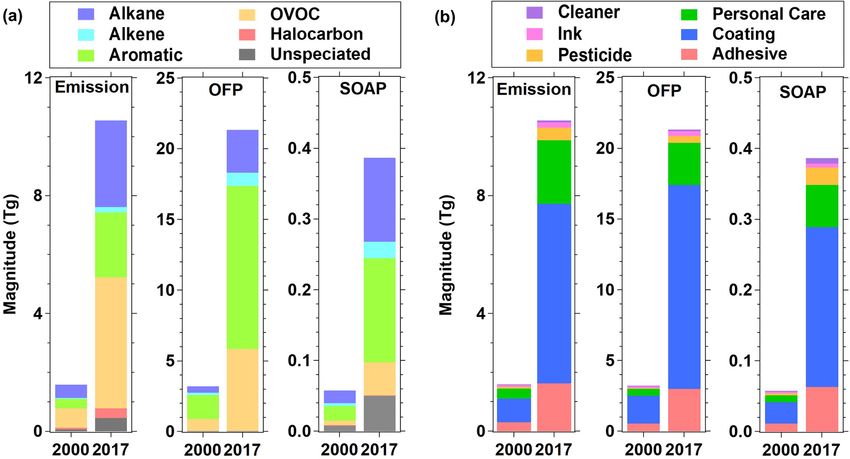
Z. Mo et al.: A mass-balance-based emission inventory of VOCs                                                              13661

Figure 4. (a) Contributions of VOCs and S/IVOCs, (b) NMVOC functional group pattern, and (b) the top 10 species in NMVOC emissions
in 2017 from solvent use.

tone (0.4 Tg), m/p-xylene (0.4 Tg), styrene (0.3 Tg), isobu-       4     Discussions
tane (0.3 Tg), propane (0.3 Tg), ethylbenzene (0.3 Tg), and o-
xylene (0.2 Tg). As a common component of daily-used sol-          4.1    Comparison with other studies
vent products, ethanol was the largest emission species from
personal care products and cleaner. This suggests that solvent     The MB-based NMVOC emissions from solvent use in
use might be another important emission source of ethanol in       this study are compared with EF-based EIs in the litera-
urban areas in addition to vehicle emissions for the regions       ture (Fig. 6), including the Regional Emission inventory in
using ethanol-containing gasoline (Khare and Gentner, 2018;        Asia (REASv3.2) (Kurokawa and Ohara, 2020), Emission
de Gouw et al., 2012).                                             Database for Global Atmospheric Research (EDGARv4.3.2,
   Comparison of emissions, OFP, and SOAP in 2000 and              2021), MEIC (Li et al., 2019), Sun EI (Sun et al., 2018)
2017 are shown in Fig. 5 in terms of NMVOC groups and              and Wu EI (Wu and Xie, 2017; Wu et al., 2016). Our es-
solvent use categories. NMVOC emissions from solvent use           timates peaked in 2014, as did those of REASv3.2, whose
increased from 1.6 Tg in 2000 to 10.6 Tg in 2017 by a factor       emissions, however, were much higher. The reason is mainly
of 6.7. OFP and SOAP increased from 3.2 to 21.3 Tg (by a           due to higher emission factors used in solvent use (SLV)
factor of 6.6) and from 0.06 Tg to 0.39 Tg (by a factor of 6.7),   and paint use (PAIN) estimates in REASv3.2. Some solvent
respectively. The similar growth factors among emissions,          source categories like pharmaceutical production and edi-
OFP, and SOAP indicate relatively small effects of emis-           ble oil production (Wei et al., 2008) were not included be-
sion structure and reactivity of NMVOCs. The largest group         cause of the lack of estimation parameters such as Wvoc for
of OFP was aromatics, accounting for 54 % of total OFP             these sources. However, their contributions are not signifi-
in 2017 (Fig. 5a). OFP from OVOCs and alkanes took up              cant (
13662                                                       Z. Mo et al.: A mass-balance-based emission inventory of VOCs

Figure 5. Contributions from (a) different source categories and (b) different NMVOC groups to emissions, OFP, and SOAP of NMVOCs
from solvent use in 2000 and 2017.

                                                                   (Fig. 7a). This was attributed to the fact that coating emis-
                                                                   sions in Sun EI only considered architecture, vehicle, and
                                                                   home appliance coating but ignored other coating industries
                                                                   (can coating, magnet wire coating, ship painting). Ink emis-
                                                                   sions were much larger in MEIC, while similar results were
                                                                   found for Sun EI and this study (Fig. 7b). The reason is
                                                                   mainly because low-emission and high-emission inks were
                                                                   considered in both Sun EI and this study, resulting in much
                                                                   lower estimates than MEIC that adopted a high and univer-
                                                                   sal emission factor. For adhesives, the estimated emissions
                                                                   in this study were higher than MEIC after 2006 (Fig. 7c).
                                                                   This might be attributed to different emission factors and in-
                                                                   creased consumption of formaldehyde-type adhesives, which
                                                                   is missing from the statistical yearbook. Note that adhesives
                                                                   were not included in Sun EI. Pesticide emissions showed a
                                                                   similar trend between Sun EI and this study but were lower
Figure 6. Comparison of NMVOC emissions from solvent use be-
                                                                   than estimates in MEIC (Fig. 7d). There was a significant
tween this study and previous estimates.
                                                                   decrease in 2017 in our work due to the fact that the pro-
                                                                   duction of pesticides had decreased and export had increased
                                                                   (Fig. S2). For personal care products, this work estimated
higher than our results. The reasons for the lower estimates       much larger emissions than MEIC and Sun EI (Fig. 7e).
in Bo et al. (2008) and Wu et al. (2016) were mainly due           MEIC and Sun EI estimated domestic solvents emissions us-
to not excluding the adhesive emissions and different meth-        ing emission factors with a unit of kilograms per capita and
ods used to estimate personal care emissions (Table S13).          population data. Therefore, the emission trends of personal
EFs of solvent-based adhesives and inks in Wei et al. (2008)       care products in MEIC and Sun EI followed the increasing
were higher than estimation parameters in our work. Differ-        pattern of China’s population (Fig. 7e). In contrast, this study
ent types of activity levels and emission factors resulted in      adopted consumption data of personal care and solvent con-
the large discrepancy in EIs. In general, different source cat-    tent used in chemical products for estimation. The dispos-
egories, EFs, and activity data collectively contribute to the     able income of households showed similar growth with our
differences among the EIs (Table S13).                             results of the emissions from personal care, suggesting more
   To further examine the emission differences, we compared        reasonable estimates in this study.
the emission estimates between this study and another two
EIs, MEIC and Sun EI, with available sub-categories of sol-
vent use (Fig. 7). Coating emissions in this study agreed well
with MEIC but were much higher than those of the Sun EI

Atmos. Chem. Phys., 21, 13655–13666, 2021                                          https://doi.org/10.5194/acp-21-13655-2021
Z. Mo et al.: A mass-balance-based emission inventory of VOCs 13663
OFP, and SOAP reduction because of the dominant propor-
tion (74 %) of solvent-based products in industrial coating.
In contrast, the reductions of adhesives and inks emissions,
OFP, and SOAP are minor due to the widespread use of low-
VOC content products, accounting for 82 % of total adhe-
sives and 65 % of inks. In general, replacing solvent-based
with water-based products would benefit the NMVOC reduc-
tions with coatings and aromatics abatement being effective
in OFP and SOAP reduction.
5 Conclusions
A NMVOC emission inventory including six categories of
solvent products was developed for the period of 2000–2017,
based on the mass balance method. Solvent use NMVOC
emissions were estimated to increase from 1.6 Tg (1.2–
2.2 Tg at 95 % confidence interval) in 2000 to 10.6 Tg (7.7–
14.9 Tg) in 2017. However, emissions leveled off between
2014 and 2017. The control efficiency of industrial sol-
vent NMVOCs was only 30 % in 2017, and there is still
room for improvement in NMVOC control efficiency. Future
emissions of NMVOCs from solvent use depend on prod-
uct consumption, product solvent type, and overall control
Figure 7. Comparisons of emission estimates for (a) coatings, (b) efficiency. The major sources of NMVOC emissions in sol-
inks, (c) pesticides, (d) adhesives, and (e) personal care products vent products were coatings, adhesives, and personal care
and cleaners (industrial detergents are not included in this figure) products, together contributing more than 90 % of the total
between this work and other studies (Li et al., 2019; Sun et al., emissions. Industrial solvent emissions were dominant due to
2018). Also shown are population (billion) and disposable income widespread use of adhesives and coatings across the indus-
of households (1013 CNY). trial sectors. Personal care products and architectural coat-
ings were major sources of non-industrial solvent emissions.
The regional distribution of VOC emissions was highly as-
4.2 Implications for NMVOC control sociated with the level of economic development. Econom-
ically developed provinces in China contributed much more
solvent NMVOCs than underdeveloped areas. Alkanes and
In order to reduce NMVOC emission from solvent use,
OVOCs were the main species emitted from solvent use, fol-
water-based products, which are regarded as environmen-
lowed by aromatics. They were mainly emitted from adhe-
tally friendly, can substitute solvent-based products in China.
sives, coatings, and personal care products. The top 10 emis-
Taking the 2017 data as an example, we assumed that all
sion species were ethanol, ethyl acetate, toluene, acetone,
solvent-based products were replaced with water-based prod-
m/p-xylene, styrene, isobutane, propane, ethylbenzene, and
ucts and evaluated NMVOC emission reduction effect. Fig-
o-xylene.
ure 8 shows the reduction of emissions, OFP, and SOAP after
OFP and SOAP from solvent use were 21.3 and 0.39 Tg in
replacing solvent-based with water-based products. NMVOC
2017 respectively. Alkanes, alkenes, and aromatics were ma-
emissions are reduced by 37 % from 10.6 to 6.7 Tg, while
jor contributors to OFP and SOAP. Compared with other sol-
OFP and SOAP are reduced by 41 % from 21.3 to 12.6 Tg
vent use categories, reducing coating emissions is more ef-
and 38 % from 0.39 to 0.24 Tg, respectively. In terms of
fective in controlling O3 and SOA pollution. Emissions from
species groups, the top three groups of NMVOC emission re-
solvent use grew quickly (with an over 5-fold increase) dur-
duction are OVOCs (reduction of 1.5 Tg, 14 % of total emis-
ing 2005–2013 and reached a plateau after 2014, which we
sions), aromatics (1.2 Tg, 11 %), and alkanes (1.0 Tg, 9 %).
attribute to the significant industrial expansion in China over
However, the top three groups of OFP and SOAP reduc-
the past decades, and effective control on solvent use in re-
tion are different from those of emissions. Aromatics (reduc-
cent years (Fig. S13). In contrast, combustion and transporta-
ing 5.8 Tg, 27 % of total OFP), OVOCs (1.8 Tg, 8 %), and
tion exhibited a decline in the past decade, mainly because of
alkanes (1.0 Tg, 5 %) are the main groups of OFP reduction,
the stringent control of NMVOCs from fuel combustion by
while aromatics (reducing 0.08 Tg, 20 %), alkanes (0.04 Tg,
industry and on-road vehicles.
10 %), and OVOCs (0.01 Tg, 3 %) contribute most to SOAP
reduction. Coatings contribute most to NMVOC emission,
https://doi.org/10.5194/acp-21-13655-2021 Atmos. Chem. Phys., 21, 13655–13666, 202113664 Z. Mo et al.: A mass-balance-based emission inventory of VOCs
Figure 8. Contributions from (a) different source categories and (b) different NMVOC groups to emissions, OFP, and SOAP. Case 1:
emissions in 2017, Case 2: emissions in 2017 after solvent-based products were replaced with water-based products.
There is more prominent emission reduction potential for Financial support. This research has been supported by the Na-
solvent use than other sources. Substituting the high-VOC tional Key R&D Plan of China (grant nos. 2019YFE0106300,
content solvent with low-solvent products is potentially an 2018YFC0213904), the National Natural Science Foundation of
effective strategy. Assuming all solvent-based products were China (grant no. 41877302), the Guangdong Natural Science Funds
replaced with water-based products in 2017, emissions, OFP, for Distinguished Young Scholar (grant no. 2018B030306037),
the Key-Area Research and Development Program of Guangdong
and SOAP were reduced by 3.9 (37 % of total emissions),
Province (grant no. 2019B110206001), and the Guangdong In-
8.7 (41 % of total OFP), and 0.15 (38 % of total SOAP) Tg, novative and Entrepreneurial Research Team Program (grant no.
respectively. It is suggested that there is still potential for 2016ZT06N263). This work was also supported by the Special
NMVOC emission reduction from solvent use in China. Fund Project for Science and Technology Innovation Strategy of
Guangdong Province (grant no. 2019B121205004). Meng Li was
supported by NOAA (grant no. NA17OAR4320101).
Data availability. Data are available from the authors upon request.
Review statement. This paper was edited by Chul Han Song and
Supplement. The supplement related to this article is available on- reviewed by three anonymous referees.
line at: https://doi.org/10.5194/acp-21-13655-2021-supplement.
Author contributions. BY and MS designed the research. ZM, RC,
BY, HC, and BCM contributed to data collection. ZM and RC per- References
formed the data analysis, with contributions from BY, HC, BCM,
ML, JZ, and MS. ZM, RC, and BY prepared the paper with contri-
Bo, Y., Cai, H., and Xie, S. D.: Spatial and temporal variation of his-
butions from other authors. All the authors reviewed the paper.
torical anthropogenic NMVOCs emission inventories in China,
Atmos. Chem. Phys., 8, 7297–7316, https://doi.org/10.5194/acp-
8-7297-2008, 2008.
Competing interests. The authors declare that they have no conflict Cai, H.: The progress of pollution control on stationary sources in
of interest. Guangdong Province, Guangdong Polytechnic of Environmental
Protection Engineering, Foshan, China, pp. 1–3, 2016.
Carter, W. P. L.: Updated maximum incremental reactivity scale and
Disclaimer. Publisher’s note: Copernicus Publications remains hydrocarbon bin reactivities for regulatory applications, available
neutral with regard to jurisdictional claims in published maps and at: https://intra.engr.ucr.edu/~carter/SAPRC/MIR10.pdf (last ac-
institutional affiliations. cess: 15 October 2020), 2010.
China Coating Industry Association: China Paint and Coatings In-
dustry Annual, China Coating Industry Association, Beijing,
China, 2000–2017.
Atmos. Chem. Phys., 21, 13655–13666, 2021 https://doi.org/10.5194/acp-21-13655-2021Z. Mo et al.: A mass-balance-based emission inventory of VOCs 13665 China Crop Protection Industry Association: China Crop Protection chemical mechanisms, Atmos. Chem. Phys., 14, 5617–5638, Industry Yearbook China Crop Protection Industry Association, https://doi.org/10.5194/acp-14-5617-2014, 2014. Beijing, China, 2001–2017. Li, M., Zhang, Q., Zheng, B., Tong, D., Lei, Y., Liu, F., Hong, C., China National Light Industry Council: China Light Industry Year- Kang, S., Yan, L., Zhang, Y., Bo, Y., Su, H., Cheng, Y., and He, book, China National Light Industry Council, Beijing, China, K.: Persistent growth of anthropogenic non-methane volatile or- 2001–2018. ganic compound (NMVOC) emissions in China during 1990– China Petroleum and Chemical Industry Association: China Chemi- 2017: drivers, speciation and ozone formation potential, At- cal Industry Yearbook, China Chemical Information Center, Bei- mos. Chem. Phys., 19, 8897–8913, https://doi.org/10.5194/acp- jing, China, 2000–2016. 19-8897-2019, 2019. de Gouw, J. A., Gilman, J. B., Borbon, A., Warneke, C., Lu, J. H., Dong, S. B., Li, W. J., Miu, X. P., and Gu, Z. Y.: Present Kuster, W. C., Goldan, P. D., Holloway, J. S., Peischl, J., Situation of VOCs Control Technologies for the Industrial Coat- Ryerson, T. B., Parrish, D. D., Gentner, D. R., Goldstein, ing Process in Zhejiang Province, Environ, Protect, Sci„ 44, 113– A. H., and Harley, R. A.: Increasing atmospheric burden of 117+121, 2018 (in Chinese). ethanol in the United States, Geophys. Res. Lett., 39, L15803, McDonald, B. C., de Gouw, J. A., Gilman, J. B., Jathar, S. H., https://doi.org/10.1029/2012gl052109, 2012. Akherati, A., Cappa, C. D., Jimenez, J. L., Lee-Taylor, J., Hayes, Duan, Y. S: China’s pesticide industry in 2017, Economic Analy- P. L., McKeen, S. A., Cui, Y. Y., Kim, S. W., Gentner, D. sis of China Petroleum and Chemical Industry, 47–49, 2018 (in R., Isaacman-VanWertz, G., Goldstein, Allen H., Harley, R. Chinese). A., Frost, G. J., Roberts, J. M., Ryerson, T. B., and Trainer, EDGARv4.3.2: Emission Database for Global Atmospheric Re- M.: Volatile chemical products emerging as largest petrochem- search, available at: http://edgar.jrc.ec.europa.eu/overview.php? ical source of urban organic emissions, Science, 359, 760, v=42, last access: 20 June 2021. https://doi.org/10.1126/science.aaq0524, 2018. Exhaust Gas Purification Committee of China Environmental Pro- Ministry of Ecology and Environment of the People’s Re- tection Industry Association: Review on the development of or- public of China: Environmental Statistics annual Report in ganic exhaust gas treatment industry in China, China Environ- 2015, available at: http://www.mee.gov.cn/hjzl/sthjzk/sthjtjnb/ mental Protection Industry, 21–27, 2008–2017. 201702/P020170223595802837498.pdf (last access: 10 Septem- Fu, X., Wang, S. X., Zhao, B., Xing, J., Cheng, Z., Liu, ber 2020), 2017. H., and Hao, J. M.: Emission inventory of primary pol- Ministry of Ecology and Environment of the People’s Republic of lutants and chemical speciation in 2010 for the Yangtze China: China’s Ecological And Environmental Status Bullet in River Delta region, China, Atmos. Environ., 70, 39–50, 2018, available at: http://www.mee.gov.cn/hjzl/sthjzk/zghjzkgb/ https://doi.org/10.1016/j.atmosenv.2012.12.034, 2013. 201905/P020190619587632630618.pdf (last access: 10 Septem- Gao, Z. J, Li, C., Zheng, J. Y., and Guo, H. X.: Evaluation of in- ber 2020), 2019. dustrial VOCs treatment techniques by field measurement, Res. Nel, A.: Air Pollution-Related Illness: Effects of Particles, Science, Environ. Sci., 28, 994–1000, 2015 (in Chinese). 308, 804, https://doi.org/10.1126/science.1108752, 2005. Hao, Y. F. and Xie, S. D.: Optimal redistribution of an urban Nishanth, T., Praseed, K. M., Kumar, M. K. Satheesh, and Valsaraj, air quality monitoring network using atmospheric dispersion K. T.: Influence of ozone precursors and PM10 on the variation model and genetic algorithm, Atmos. Environ., 177, 222–233, of surface O3 over Kannur, India, Atmos. Res., 138, 112–124, https://doi.org/10.1016/j.atmosenv.2018.01.011, 2018. https://doi.org/10.1016/j.atmosres.2013.10.022, 2014. Jin, X. M. and Holloway, T.: Spatial and temporal variability of Pearson, J. K.: European solvent VOC emission inventories based ozone sensitivity over China observed from the Ozone Mon- on industry-wide information, Atmos. Environ., 204, 118–124, itoring Instrument, J. Geophys. Res.-Atmos., 120, 7229–7246, https://doi.org/10.1016/j.atmosenv.2019.02.014, 2019. https://doi.org/10.1002/2015jd023250, 2015. Simayi, M., Hao, Y. F, Li, J., Wu, R. R., Shi, Y. Q., Xi, Z. Y., Zhou, Khare, P. and Gentner, D. R.: Considering the future of anthro- Y., and Xie, S. D.: Establishment of county-level emission in- pogenic gas-phase organic compound emissions and the increas- ventory for industrial NMVOCs in China and spatial-temporal ing influence of non-combustion sources on urban air quality, At- characteristics for 2010–2016, Atmos. Environ., 211, 194–203, mos. Chem. Phys., 18, 5391–5413, https://doi.org/10.5194/acp- https://doi.org/10.1016/j.atmosenv.2019.04.064, 2019. 18-5391-2018, 2018. Streets, D. G., Bond, T. C., Carmichael, G. R., Fernandes, S. D., Fu, Kurokawa, J. and Ohara, T.: Long-term historical trends in air Q., He, D., Klimont, Z., Nelson, S. M., Tsai, N. Y., Wang, M. pollutant emissions in Asia: Regional Emission inventory in Q., Woo, J. H., and Yarber, K. F.: An inventory of gaseous and ASia (REAS) version 3, Atmos. Chem. Phys., 20, 12761–12793, primary aerosol emissions in Asia in the year 2000, J. Geophys. https://doi.org/10.5194/acp-20-12761-2020, 2020. Res.-Atmos., 108, 8809, https://doi.org/10.1029/2002JD003093, Li, J., Xie, S. D., Zeng, L. M., Li, L. Y., Li, Y. Q., and Wu, R. 2003. R.: Characterization of ambient volatile organic compounds and Sun, W., Shao, M., Granier, C., Liu, Y., Ye, C. S., and Zheng, J. their sources in Beijing, before, during, and after Asia-Pacific Y.: Long-Term Trends of Anthropogenic SO2 , NOx , CO, and Economic Cooperation China 2014, Atmos. Chem. Phys., 15, NMVOCs Emissions in China, Earth’s Future, 6, 1112–1133, 7945–7959, https://doi.org/10.5194/acp-15-7945-2015, 2015. https://doi.org/10.1029/2018ef000822, 2018. Li, M., Zhang, Q., Streets, D. G., He, K. B., Cheng, Y. F., Em- United States Environmental Protection Agency (U.S. EPA): mons, L. K., Huo, H., Kang, S. C., Lu, Z., Shao, M., Su, H., Compilation of Air Pollutant Emission Factors (AP-42), Yu, X., and Zhang, Y.: Mapping Asian anthropogenic emis- Research Triangle Park, North Carolina, available at: sions of non-methane volatile organic compounds to multiple https://www.epa.gov/air-emissions-factors-and-quantification/ https://doi.org/10.5194/acp-21-13655-2021 Atmos. Chem. Phys., 21, 13655–13666, 2021
13666                                                               Z. Mo et al.: A mass-balance-based emission inventory of VOCs

  ap-42-compilation-air-emissions-factors           (last       access:   Wu, R. R., Bo, Y., Li, J., Li, L. Y., Li, Y. Q., and Xie, S.
  10 November 2020), 1995.                                                  D.: Method to establish the emission inventory of anthro-
Wang, H. L., Qiao, Y. Z., Chen, C. H., Lu, J., Dai, H. X., Qiao, L.         pogenic volatile organic compounds in China and its applica-
  P., Lou, S. R., Huang, C., Li, L., Jing, S. G, and Wu, J. P.: Source      tion in the period 2008–2012, Atmos. Environ., 127, 244–254,
  Profiles and Chemical Reactivity of Volatile Organic Compounds            https://doi.org/10.1016/j.atmosenv.2015.12.015, 2016.
  from Solvent Use in Shanghai, China, Aerosol Air Qual. Res.,            Yang, Q., Huang, C., Lu, B., Jing, B. L., Xia, Y., Tang, W., Lu,
  14, 301–310, https://doi.org/10.4209/aaqr.2013.03.0064, 2014.             Q., Lu, J., Xu, C., and Gu, Z. Y.: Air pollutant emission in-
Wang, S. X., Zhao, B., Cai, S. Y., Klimont, Z., Nielsen, C. P.,             ventory based on local emission source surveys in Hangzhou,
  Morikawa, T., Woo, J. H., Kim, Y., Fu, X., Xu, J. Y., Hao, J.             China, Acta Scientiae Circumstantiae, 37, 3240–3254, 2017 (in
  M., and He, K. B.: Emission trends and mitigation options for             Chinese).
  air pollutants in East Asia, Atmos. Chem. Phys., 14, 6571–6603,         Yin, S., Zheng, J., Lu, Q., Yuan, Z., Huang, Z., Zhong, L.,
  https://doi.org/10.5194/acp-14-6571-2014, 2014.                           and Lin, H.: A refined 2010-based VOC emission inventory
Wei, W., Wang, S. X., Chatani, S., Klimont, Z., Cofala,                     and its improvement on modeling regional ozone in the Pearl
  J., and Hao, J. M.: Emission and speciation of non-                       River Delta Region, China, Sci. Total Environ., 514, 426–438,
  methane volatile organic compounds from anthropogenic                     https://doi.org/10.1016/j.scitotenv.2015.01.088, 2015.
  sources in China, Atmos. Environ., 42, 4976–4988,                       Yuan, B., Shao, M., Lu, S. H., and Wang, B.: Source pro-
  https://doi.org/10.1016/j.atmosenv.2008.02.044, 2008.                     files of volatile organic compounds associated with solvent
Wei, W., Wang, S. X., and Hao, J. M.: Uncertainty analysis of               use in Beijing, China, Atmos. Environ., 44, 1919–1926,
  emission inventory for volatile organic compounds from anthro-            https://doi.org/10.1016/j.atmosenv.2010.02.014, 2010.
  pogenic sources in China, Environ. Sci., 32, 305–312, 2011a (in         Yuan, B., Hu, W. W., Shao, M., Wang, M., Chen, W. T., Lu, S. H.,
  Chinese).                                                                 Zeng, L. M., and Hu, M.: VOC emissions, evolutions and contri-
Wei, W., Wang, S. X., Hao, J. M., and Cheng, S. Y.: Projection              butions to SOA formation at a receptor site in eastern China, At-
  of anthropogenic volatile organic compounds (VOCs) emissions              mos. Chem. Phys., 13, 8815–8832, https://doi.org/10.5194/acp-
  in China for the period 2010–2020, Atmos. Environ., 45, 6863–             13-8815-2013, 2013.
  6871, https://doi.org/10.1016/j.atmosenv.2011.01.013, 2011b.            Zhong, Z., Sha, Q., Zheng, J., Yuan, Z., Gao, Z., Ou, J., Zheng,
Wu, R. and Xie, S.: Spatial Distribution of Ozone Formation                 Z., Li, C., and Huang, Z.: Sector-based VOCs emission factors
  in China Derived from Emissions of Speciated Volatile Or-                 and source profiles for the surface coating industry in the Pearl
  ganic Compounds, Environ. Sci. Technol., 51, 2574–2583,                   River Delta region of China, Sci. Total Environ., 583, 19–28,
  https://doi.org/10.1021/acs.est.6b03634, 2017.                            https://doi.org/10.1016/j.scitotenv.2016.12.172, 2017.

Atmos. Chem. Phys., 21, 13655–13666, 2021                                                  https://doi.org/10.5194/acp-21-13655-2021
You can also read