STEICO SE Half-Year Report 2020 - The green share

Page created by Mildred Parsons
 
CONTINUE READING
STEICO SE Half-Year Report 2020 - The green share
STEICO SE
Half-Year Report 2020

                                                              The green share

6M                                               2020
Sales growth and solid earnings despite corona restrictions

Natural building products for healthier living
STEICO SE Half-Year Report 2020 - The green share
Overview
    H1 2020 – STEICO Konzern

    Sales growth and solid earnings despite corona restrictions

    H1 Revenue growth in € millions                                             H1 Gross earnings growth in € millions

                                    +3.3%        144.2
    150                 139.6                                                    75                         +3.7%
                                                                                                  63.4                    65.7
    120                                                                          60

     90                                                                          45

     60                                                                          30

     30                                                                          15
     €m

                                                                                 €m
                        9

                                                  0

                                                                                                  9

                                                                                                                          0
                        01

                                                 02

                                                                                                 01

                                                                                                                          02
                     /2

                                              /2

                                                                                               /2

                                                                                                                      /2
                   6M

                                            6M

                                                                                            6M

                                                                                                                     6M
    H1 EBITDA growth in € millions                                              H1 EBIT growth in € millions

     30                                                                          15               13.7      -10.9%
                        26.0        -8.8%
                                                  23.7                                                                    12.2
     24                                                                          12

     18                                                                           9

     12                                                                           6

      6                                                                           3
                                                                                 €m
     €m

                                                                                                  9

                                                                                                                          0
                        9

                                                  0

                                                                                                 01

                                                                                                                          02
                        01

                                                 02

                                                                                               /2

                                                                                                                      /2
                     /2

                                              /2

                                                                                            6M

                                                                                                                     6M
                   6M

                                            6M

    H1 EBT growth in € millions                                                 H1 profit for the period growth in € millions

     15                                                                          15
                        13.2       -12.1%
     12                                           11.6                           12
                                                                                                    9.2     -18.2%
      9                                                                           9                                        7.5

      6                                                                           6

      3                                                                           3
     €m

                                                                                 €m
                        9

                                                  0

                                                                                                  9

                                                                                                                          0
                        01

                                                 02

                                                                                                 01

                                                                                                                          02
                     /2

                                              /2

                                                                                               /2

                                                                                                                      /2
                                                                                            6M
                   6M

                                            6M

                                                                                                                     6M

       | ADDITIONAL KPIS
                                                                                                H1 2020              FY 2019           H1 2019

          1.   Total operating revenue in € millions                                      € 142.3 million     € 287.8 million    € 140.5 million
          2.   EBITDA margin as a percentage of total operating revenue                           16.6%               19.7%              18.5%
          3.   EBIT margin as a percentage of total operating revenue                               8.6%              11.3%               9.8%
          4.   Equity ratio (as of June 30 or December 31)                                        50.0%               53.7%              51.8%
    Percentage increases and margins calculated based on non-rounded figures.

2   STEICO Half-Year
    Technisches Handbuch
                     Report
                         STEICO
                            2020 construction
Half-Year Report 2020

Despite the restrictions on public life as a result of the corona pandemic,
the STEICO Group is able to continue its growth. Revenue improved by
3.3% to € 144.2 million in the first six months of 2020. The positive
development in core markets such as Germany and the Alpine region
compensated for declining sales in markets such as the UK and Australia.
As a result of the impact of the pandemic, earnings are slightly below
the previous year but are very solid. EBITDA totaled € 23.7 million,
down 8.8%. The EBITDA margin is 16.6%. EBIT in the first six months
totaled € 12.2 million and was thus down by 10.9% compared
to the previous year. The EBIT margin amounted to 8.6%.
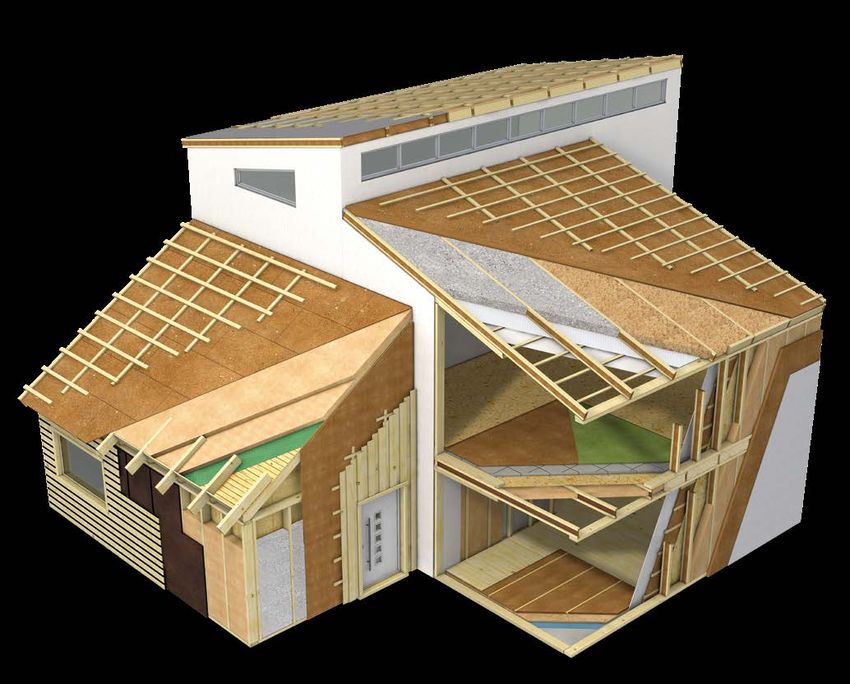
The STEICO Group is continuing to invest in expanding its production capacities
in order to continue to meet growing demand in future. At the Czarna Woda
site (Poland), another plant for stable wood fiber insulation materials from
the wet process is being built, while at the Casteljaloux site (France), a plant
for stable wood fiber insulation materials from the dry process is planned.
The management continues to take a positive view of the second half of 2020.
The European construction industry is still characterized by a high degree of
stability – in addition, the second half of the year is likely to be characterized
by positive growth impetus and catch-up effects as a result of the easing
of corona restrictions currently being implemented in many countries.
For 2020, the Board of Directors continues to expect revenues to
be between the previous year's level and plus 5% growth. Due
to the current positive growth it is forecasting an EBIT ratio of
between 8.5% and 9.5% (in terms of total operating revenue).

Company profile

STEICO develops, produces and markets ecological                  Sealing products for the building shell complete the overall
construction products made of renewable raw materials.            system.
STEICO is the global market leader for wood fiber insulation
                                                                  The STEICO Group offers its customers a unique range
materials.
                                                                  of products through to the prefabrication of complete
STEICO is positioned as a system provider for ecological          components for timber element construction.
residential construction and is the only manufacturer in the
                                                                  The Munich-based company’s products are used in new
industry to offer an integrated wooden construction system
                                                                  construction and when renovating roofs, walls, ceilings,
in which innovative wooden construction components and
                                                                  floors and facades. STEICO’s products allow the construction
ecological insulation material supplement each other.
                                                                  of future-proof, healthy buildings with a particularly high
Laminated veneer lumber and I-joists form the structural          quality of living and a healthy atmosphere. STEICO’s
components of the system. The insulation materials include        products offer reliable protection against cold, heat and also
flexible and stable wood fiber insulation panels, facade          noise, and they permanently improve the building’s energy
insulation materials, as well as cavity wall insulation made of   efficiency.
wood fibers and cellulose.

Disclaimer

This document is a translated version of the German original document. The translation has been prepared with
utmost care. However, only the German original document is binding.

                                                                                                                         STEICO Half-Year Report 2020   3
300                                                                                 45

                                                                               200                                                                                 30

    Growth of STEICO’s shares                                                  100                                                                                 15

                                                                                    0                                                                                  0

                                                                               in%                                                                                in%

                                                                                        15

                                                                                                       16

                                                                                                                      17

                                                                                                                                  18

                                                                                                                                              19

                                                                                                                                                             20

                                                                                                                                                                           19
                                                                                    20

                                                                                                   20

                                                                                                                  20

                                                                                                                                  20

                                                                                                                                             20

                                                                                                                                                            20

                                                                                                                                                                       20
                                                                                 1.

                                                                                                                                                            2.

                                                                                                                                                                   1.
                                                                                .0

                                                                                                                                                        .0

                                                                                                                                                                  .0
                                                                               01

                                                                                                                                                       11

                                                                                                                                                                  02
    A. SHARE PRICE GROWTH IN 2020                                                        STEICO‘s shares: development H1 2020                                               STEI

    STEICO’s shares started the year with a Xetra closing price of              40                                                                                 70
    € 28.50 on 2 January 2020. During the following weeks, the                                                   STEICO SE
                                                                                30                                                                                 60
    price of the shares increased significantly, and peaked for the
    reporting period at € 36.20 on 20 February. This corresponds                20                                                                                 50
    to an increase of 27.0%. When numerous restrictions were
                                                                                10                                                                                 40
    imposed on public life throughout Europe at the start of
    March, STEICO's shares were unable to escape the general                        0                                                                              30
    slump on the stock markets, and fell to an annual low of
                                                                               -10                                                                                 20
    € 18.25 on 18 March 2020.
                                                                               -20                                                                                 10
    However, it was possible to compensate for the majority of
    the losses in the following weeks. STEICO’s shares closed at a             -30                                                                                     0
    price of € 33.50 in Xetra trading on 30 June. This corresponds
                                                                               in%                                                                                in%
    to an increase of 17.5% in the first half of 2020.

                                                                                                                                                                           19
                                                                                        20

                                                                                                  20

                                                                                                                 20

                                                                                                                             20

                                                                                                                                        20

                                                                                                                                                  20

                                                                                                                                                             20

                                                                                                                                                                       20
                                                                                    20

                                                                                                  20

                                                                                                             20

                                                                                                                           20

                                                                                                                                       20

                                                                                                                                                  20

                                                                                                                                                            20

                                                                                                                                                                   1.
                                                                                 1.

                                                                                              1.

                                                                                                            2.

                                                                                                                           3.

                                                                                                                                   4.

                                                                                                                                              5.

                                                                                                                                                        6.

                                                                                                                                                                  .0
                                                                               .0

                                                                                             .0

                                                                                                            .0

                                                                                                                       .0

                                                                                                                                   .0

                                                                                                                                             .0

                                                                                                                                                       .0
    B. INVESTOR RELATIONS

                                                                                                                                                                  02
                                                                               02

                                                                                             31

                                                                                                        28

                                                                                                                      31

                                                                                                                                  30

                                                                                                                                             29

                                                                                                                                                       30
    As was the case in previous years, STEICO SE engaged in open and direct communication with the capital markets in 2020,
    and is in close contact with its shareholders. In addition to the transparency policies for the Basic Board and m:access, STEICO
    SE fulfilled its publication requirements, for example with end-to-end communication in German and English and the regular
    publication of quarterly reports. In addition, up-to-date press releases and financial reports are also always published on the
    Web site www.STEICO.com/ir. Information on key events is disseminated via a well-known institution to comply with publicity
    obligations.

    C. CAPITAL MARKET DIARY 2020
    9/10 January 2020        STEICO presented the company to institutional investors at the 23rd Oddo Forum, held by ODDO BHF in Lyon (France)
    3 February 2020          Publication of provisional figures for 2019
    11 February 2020         STEICO presented the company to institutional investors at the “HSBC ESG Conference” (Frankfurt am Main)
    13 February 2020         STEICO presented the company to institutional investors at the “Montega Fokus Investment Day”.
    28 April 2020            Publication of the 2019 STEICO annual report
    28 April 2020            Publication of STEICO’s 2020 Q1 report
    16 June 2020             STEICO presented the company to institutional investors (virtual roadshow with Metzler)
    25 June 2020             STEICO SE’s 2020 Ordinary General Meeting
    16 July 2020             Publication of STEICO’s 2020 semi-annual report
                                                                                 Technisches Handbuch STEICO construction
                             STEICO will present the company to institutional investors at the “Commerzbank Corporate Coference”
    2 September 2020
                             (Frankfurt am Main)
                             STEICO will present the company to institutional investors at the “Berenberg and Goldman Sachs Ninth German Corporate
    23 September 2020
                             Conference” (virtual conference)
    October 2020             STEICO will present the company to institutional investors at the “Fachkonferenz Technologie der Börse München”
    October 2020             Publication of STEICO’s 2020 Q3 report

    Current dates for the capital markets are published online at www.steico.com / ir.

4   STEICO Half-Year Report 2020
Half-Year Report 2020

Group management report for STEICO SE as of 30 June 2020

A. FOUNDATIONS                                                  the dry method. Both methods break down wood into
                                                                individual fibres using steam and mechanical treatment. The
I.   STEICO SE’S BUSINESS MODEL                                 fundamental difference between the two methods is that
                                                                wet fibres are processed (formed to make boards) in the wet
                                                                method, and in the dry method the fibres are dried before
1.   OVERVIEW
                                                                forming the boards. The dry method can be used to produce
The STEICO Group develops, produces and markets ecological      fibres for cavity insulation, flexible (compressible) mats or
construction products made of renewable raw materials.          stable insulation boards.
STEICO is, in its own opinion, the European market leader in
                                                                Air injected insulation
the wood-fibre insulation materials segment compared to the
relevant competitors.                                           Air injected insulation is made of loose insulation fibres or
                                                                insulation flakes which are blown into construction cavities at
STEICO is positioned as a system provider for ecological
                                                                high pressure, where they then compress. The STEICO Group
residential construction and, compared to the relevant
                                                                produces and sells air injected insulation material made of
competitors, it is the only manufacturer in the industry to
                                                                wood fibres and also cellulose flakes.
offer an integrated wooden construction system in which
insulation material and wooden construction components          Construction products: I-joists
supplement each other. These include flexible wood fiber
                                                                I-joists are supporting components which are optically very
insulation materials, stable wood fiber insulation boards,
                                                                similar to traditional double-T-joists. They comprise two
wood fiber insulation boards for facade insulation (“ETICS”),
                                                                “belts” (square timber posts made of laminated veneer
cavity insulation made of wood-fibre and cellulose as well
                                                                lumber) which are connected using a fibreboard. Some of the
as system products to insulate building shells. Construction
                                                                bridge material is purchased (OSB: Oriented Strand Board),
elements comprise I-joists and laminated veneer lumber.
                                                                but the majority is produced in-house (Natural Fiber Boards)
In addition, the STEICO Group also produces Natural Fibre
                                                                STEICO’s I-joists offer an alternative to standard construction
Boards and operates in the wood wholesale trade. The
                                                                products such as construction lumber or laminated timber in
product range in the United Kingdom also include products
                                                                terms of both their price and energy consumption.
for ceiling and floor construction.
                                                                Construction products: LVL, Laminated Veneer Lumber
The STEICO Group’s production equipment can also be used
to produce a wide variety of specialty products such as door
                                                                Laminated veneer lumber is a high-performance wood
panels, pin-boards, etc. which are sold to various industrial
                                                                material and comprises several layers of wood laminate glued
customers.
                                                                together. It is characterised by its particularly high rigidity
                                                                and ability to bear loads, while simultaneously offering high
2.   THE STEICO GROUP’S PRODUCTS AND SERVICES
                                                                dimensional stability. Laminated veneer lumber is used both
The STEICO Group is a system provider for natural               in the construction industry and also in industrial applications
construction products for insulation and construction.          (for example to produce doors and furniture). It is also a key
The core range comprises “natural wood-fibre insulation         component for I-joists (flange material).
materials”. In H1 2020 the bulk of revenues (65.6%) was
                                                                Timber wholesale
recorded with environmentally friendly wood-fibre insulation
materials and cavity insulation for building and floor          The STEICO Group operates in wood product wholesale in
insulation.                                                     Germany. These products stem from the company’s former
                                                                orientation and these operations are being continued with
The STEICO Group’s current range of products and services
                                                                a lower number of employees. The company generates
comprises:
                                                                revenues with wood products which are mostly imported
Wood-fibre insulation materials                                 from south-eastern European countries and Poland. Clients
                                                                are the wood wholesale trade and furniture industry in
STEICO insulation materials are mode of fresh soft wood.
                                                                Germany.
They are used in new buildings and renovation work,
protecting against the cold, heat and noise.

Wood-fibre insulation materials are produced by the
subsidiaries using various methods - both the wet and

                                                                                                     STEICO Half-Year Report 2020   5
Group management report for STEICO SE as of 30 June 2020

    The range of merchandise spans sawn timber through to             Building element production
    semi-finished products for furniture making (e.g. products cut
                                                                      In 2020, STEICO SE entered the market with its "Element
    to customer specifications).
                                                                      Production" division. This involves refining individual STEICO
    STEICO UK Ltd. runs wholesale operations in the United            products (construction materials and insulating materials) to
    Kingdom with wood and wooden composite boards to                  form complete components such as roof, wall and ceiling
    supplement its sales of I-joists. It has become standard          elements according to customer specifications. These
    practice on the UK market for construction companies to           elements allow work on the construction site to progress
    offer end-to-end ceiling systems - including planning, the        particularly rapidly.
    supporting structure (I-joists) and wooden composite boards
                                                                      Automation and prefabrication of end-to-end components
    to construct the floor - all from a single source.
                                                                      are ongoing trends in the construction industry.
    Special products                                                  Prefabrication / element production has been practised by
                                                                      STEICO SE's customers for a long time, but is often labour-
    The special products segment bundles all of the products
                                                                      intensive manual work. STEICO's prefabrication is based
    that the group produces itself which are not directly allocable
                                                                      on a high degree of automation, which is associated with
    to the construction sector. These include, for example,
                                                                      increases in speed and precision. The offering is geared to
    fibreboards for pinboards or door fills, as well as other
                                                                      timber construction and prefabricated house companies,
    products for industrial applications.
                                                                      which can thus achieve advantages in terms of personnel
    Natural fibre boards (hardboards)                                 deployment, economic efficiency and construction speed.
                                                                      STEICO SE will not operate as a house construction company
    The production of natural fibre boards is similar to the
                                                                      itself.
    production of wood-fibre insulation materials made using the
    wet method. The difference is that wet fibres are pressed to
                                                                      3.   PROCUREMENT
    form stable boards using particularly high pressure. Natural
    fibre boards are used in the furniture industry. Natural fibre    The fresh wood require to produce wood fibre products
    boards are used in the furniture industry where they are          is mostly procured in Poland from the Polish State Forest.
    used, for example, to form the backs of cupboards or the          In France wood is procured on the free wood market. The
    bottoms of drawers. In addition, they are used as standard        wood is sourced from sustainably managed forests from the
    construction boards on many markets, for example for roof         region surrounding the production facilities.
    boards. Within the STEICO Group, natural fibre boards are a
    key component in the production of I-joists, where they form      4.   SALES AND CUSTOMERS
    the so-called bar. Sales to external customers is no longer of
                                                                      The STEICO Group’s customers are mostly broken down
    any strategic importance due to the low margins.
                                                                      into the customer groups of wood and construction
    Miscellaneous                                                     materials traders, wood construction companies (such as
                                                                      pre-fabricated home construction companies) and DIY stores
    The Miscellaneous segment bundles various peripheral
                                                                      (in some cases via distributors) as well as industrial customers
    activities, such as ETICS accessories, vapour barriers and
                                                                      (e.g. manufacturers of laminated / parquet flooring, furniture
    other accessories such as tools for processing insulation
                                                                      manufacturers, construction material manufacturers).
    material.
                                                                      Other key customer groups include:
    Services
                                                                      • Craftsmen and wood construction companies which
    STEICO offers a range of supplementary services, such as its
                                                                        process the group’s products.
    “STEICO Academy” seminars. These seminars train craftsmen,
    architects, trade representatives and also people building        • Architects and planners, who take decisions to use
    there own home in how to use the STEICO construction                STEICO’s products when planning buildings.
    system. In addition STEICO has its own department for
                                                                      • Private and institutional builders who use STEICO’s
    technical advice for craftsmen, planners and builders. As a
                                                                        products in their buildings.
    rule services are preformed free of charge.

6   STEICO Half-Year Report 2020
Half-Year Report 2020

Group management report for STEICO SE as of 30 June 2020

II.   CONTROL SYSTEM AND SHAREHOLDER                            B. ECONOMIC REPORT
      SYSTEM
                                                                I.    OVERALL ECONOMIC AND INDUSTRY-SPECIFIC
STEICO SE is responsible for sales management, marketing,             UNDERLYING CONDITIONS
investments, product development, finance and financial
control in its position as the group’s holding company. 61.1%
                                                                1.    ECONOMIC TREND
of shares are held be the CEO / managing director Mr. Udo
Schramek, and the remaining 38.9% is in free float.             Current data from the European statistics authority Eurostat
                                                                are currently only available up to April 2020 and thus paint
                                                                an incomplete picture showing the peak of the corona
                                                                pandemic in Europe.
III. RESEARCH AND DEVELOPMENT
                                                                In Germany statistics data is also only available through to
• Supporting research work in parallel to operating the         April 2020. However, since construction activity in Germany
  Group’s own production line for laminated veneer lumber       was hardly affected even during the contact restrictions,
                                                                growth has been recorded here. From January to April
• Research activities to develop formaldehyde-free binding
                                                                revenues in the construction sector lifted by 7.0% compared
  agents for wood materials and other adhesives
                                                                to the same period of the previous year. In the particularly
• Further development of cellulose cavity insulation            relevant sub-segment of roofing and carpentry, sales growth
                                                                of 11.0% was even reported within the comparable period.1
• Developing and optimising wet method wood fibre
  insulation materials                                          The number of building permits – an important early
                                                                indicator of future construction activity – also rose again in
• Developing and optimising dry method wood fibre
                                                                Germany. Planning permission for residential accommodation
  insulation materials
                                                                was up by 4.7% from January to April 2020 compared to
• Research to optimise the fire and mouldering performance      the same period of the previous year. The approval figures
  for STEICO’s insulation materials                             for single-family houses were 1.3% higher than in the same
                                                                period of the previous year, and for semi-detached houses
• Research to optimise the heat conduction properties for
                                                                the figure was even 14.3%. The number of new permits
  STEICO’s insulation materials
                                                                is still higher than the number of completions, so that the
• Research to optimise the emission behaviour for wood          so-called construction backlog has increased further.2
  fibre insulation materials and wooden materails
                                                                The upward trend in the timber construction/pre-fab segment
• Development and pre-production of full wall, roof and         continues unabated. The Bundesverband deutscher Fertigbau
  ceiling elements produced using the STEICO construction       (Federal Association of German Prefabricated Buildings) even
  system                                                        reports a pre-fabricated construction rate of over 23.1%, up
                                                                by 11.1% compared to 2019 as a whole.3
Future R&D work will continue to focus on building the
integrated construction system.
                                                                2.    COMPETITION

                                                                With regard to wood-fibre insulation materials, the most
                                                                important competitors in the opinion of the company’s
                                                                management were Soprema with its Pavatex brand (France),
                                                                Gutex (Germany), bestwood Schneider (Germany), Hunton
                                                                (Norway) and Fibris (Poland).

                                                                1 Source: Destatis, press release 259 dated 10 July 2020
                                                                2 Source: Destatis, press release 222 dated 19 June 2020
                                                                3 Source: Bundesverband Deutscher Fertigbau e.V.,
                                                                  press release dated 11 June 2020

                                                                                                         STEICO Half-Year Report 2020   7
Group management report for STEICO SE as of 30 June 2020

    STEICO SE’s management believes that its key competitors for          2.   UNDERLYING CONDITIONS FOR PRODUCTION
    I-joists are Metsä (Finnland), Masonite (Sweden), as well as               AND SALES
    James Jones (United Kingdom).
                                                                          Production of laminated veneer lumber (LVL)
    The most important competitors for laminated veneer
                                                                          The production of laminated veneer lumber is stable and
    lumber were Metsä (Finland), Stora Enso (Finland), Pollmeier
                                                                          both plants can report high capacity utilization in regular
    (Germany), as well as MLT / Taleon Terra (Russia).
                                                                          operation.

                                                                          Production of wood fiber insulation materials

    II.   COURSE OF BUSINESS                                              Demand for wood fiber insulation materials continues to
                                                                          rise. The STEICO Group is reacting to this by adjusting its
                                                                          production capacities.
    1.    KEY EVENTS IN THE FIRST SIX MONTHS OF 2020
                                                                          At the Czarna Woda site, a further production line for wood
    Influence of Corona / Covid 19
                                                                          fiber insulation materials using the wet process is being
    As a result of the global spread of the new corona virus, the         built. The main plant components have been purchased
    STEICO Group faced challenges in the second quarter as a              second hand. It is planned to go live at the start of 2022.
    result of restrictions in public life. At times, individual markets   Production volumes are to be increased continuously to up
    were only accessible to a limited extent.                             to 135,000 m3. As the eighth line for wood fiber insulating
                                                                          materials using the wet process, the line will produce
    As a result, on 19 March 2020, the STEICO Group announced
                                                                          specialized insulating boards in specific thickness ranges, thus
    that production at the French plant in Casteljaloux had to be
                                                                          helping to boost efficiency in STEICO's production mix.
    temporarily suspended. However, after construction activity
    in France was quickly resumed, production was restarted on            At the Casteljaloux site, a production line for wood fiber
    7 April.                                                              insulation materials using the dry process is to be built. This
                                                                          is mostly a new line. It is planned to go live at the start of
    Production in Poland, on the other hand, was maintained
                                                                          2021. Production volumes are to be increased continuously
    throughout.
                                                                          to up to 200,000 m3. Wood fibre insulation materials from
    As a result of the corona restrictions, the Board of Directors        the dry process are used in particular in the building shell
    also assumed subdued growth in 2020 and on 24 April 2020              (roof and façade), with a growing market potential for these
    adjusted its forecast – with revenue between the previous             products being seen in France. Production at the Casteljaloux
    year's level and 5% growth and an EBIT ratio between 7.5%             site is particularly advantageous due to logistical advantages,
    and 8.5%.                                                             high volumes and shorter distances to customers.

    At the time of writing, the corona restrictions have been             Production of prefabricated timber construction elements
    significantly relaxed in most markets, so that construction
                                                                          The first projects are being manufactured on the production
    activity is almost unrestricted (for further information, see
                                                                          lines for prefabricated timber construction elements. After
    B.II.3. Course of business). By now the positive business
                                                                          market entry was delayed in the first half of the year – partly
    development allows prospects of an EBIT ratio between 8.5%
                                                                          due to corona restrictions - dynamic growth is expected for
    and 9.5% for 2020 as a whole.
                                                                          the second half of the year.
    Fortunately, no cases of Corona have been recorded in the
                                                                          STEICO's element production is based on a high degree of
    STEICO Group up to now. Corresponding protection concepts
                                                                          automation, which is associated with increases in speed and
    have been put in place in the individual companies.
                                                                          precision. The offering is geared to timber construction and
                                                                          prefabricated house companies, which can thus achieve
                                                                          advantages in terms of personnel deployment, economic
                                                                          efficiency and construction speed. STEICO SE will not operate
                                                                          as a house construction company itself.

8   STEICO Half-Year Report 2020
Half-Year Report 2020

                                           Group management report for STEICO SE as of 30 June 2020

                                                                                                                                                     H1 2020: Ratio revenues by products

                                                                                                                                                       Natural Fiber Boards (Hardboards) 0.9%
                                                                                                                                                       Natural Fiber Timber
                                                                                                                                                                     Boards wholesale  1.4%
                                                                                                                                                                            (Hardboards)   0.9%
                                           Energy costs                                                                                                Sales in France,Miscanellous
                                                                                                                                                                     Timber         2.7%
                                                                                                                                                                         thewholesale  1.4% market, declined slightly
                                                                                                                                                                             second largest
                                                                                                                                                             Special
                                                                                                                                                       by -1.6%   to €products 6.7%2.7%
                                                                                                                                                                       Miscanellous
                                                                                                                                                                       20.0 million. This is due in particular to the
                                           The transition from coal to biomass (for the provision of
                                                                                                                temporary
                                                                                                                       Specialrestriction
                                                                                                                                 productsof  public life as a result of the corona
                                                                                                                                          6.7%
                                           heat and steam for production) has been completed, so that
                                                                                                                pandemic     at  the beginning
                                                                                                                        I-joists 10.1%          of the second quarter. In June,
                                           regular operation in the plants can be carried out entirely
                                                                                                                however,    France   showed
                                                                                                                        I-joists 10.1%        clear signs of recovery.
                                           using renewable energy sources. A biomass pelletising plant
                                                     H1being
                                           is currently  2020:built
                                                                Development     sales
                                                                    in order to be    bytoproduct
                                                                                   able    operategroups
                                                                                                   existingin € million
                                                                                                                In the United Kingdom, the STEICO Group’s third largest
                                                                                                                                                                                   Ecological Insulatio
                                           coal-fired boilers with biomass, so that coal as a reserve           market, revenues declined by 37.4% to € 10.3 million despite       Materials
                                                             +10.3%*                                                                                                               Ecological65.5%
                                                                                                                                                                                              Insulatio
                                           energy source
                                                     105 will no longer have to be used even if the             the insecurities surrounding Brexit. This is due in particular to
                                                                                                                                                                                   Materials 65.5%
                                                                         94.5

                                           biomass boilers are overhauled.                                        Laminated
                                                                                                                the  very strictVeneer
                                                                                                                                  lockdown in the wake of the corona pandemic,
                                                                  85.7

                                                      90                                                        Lumber    (LVL)  12.5%
                                                                                                                which   was only
                                                                                                                  Laminated         relaxed in the course of June and had a
                                                                                                                                Veneer
                                           Thanks to the conversion, the STEICO Group is making a
                                                      75                                                        strong
                                                                                                                Lumberimpact       on construction activity.
                                                                                                                          (LVL) 12.5%
                                           significant contribution to climate protection and is less
                                           dependent60on price increases for coal and CO2-Certificates,
                                           so that the cost increases in the energy sector were largely
                                                      45
                                           stabilised.
                                                                                    +13.3%             -32.3%            +13.5%
                                                      30
                                                                                                       21.6

                                           3.    COURSE OF BUSINESS4
                                                                                              17.9

                                                                                                                                          +21.3%          H1-31.6%
                                                                                                                                                              2020: Ratio revenues
                                                                                                                                                                     -19.2%           by markets
                                                                                    15.9

                                                                                                              14.6

                                                      15                                                                                                                   Rest of World   0.4%
                                                                                                                                9.7
                                                                                                                         8.6

                                           During the first six months the STEICO Group’s revenues lifted                                                                          Italy 2.8%
                                                                                                                                                                           Rest of World   0.4%
                                                                                                                                          3.2

                                                                                                                                                 3.9
                                                         €m

                                                                                                                                                            3.0

                                                                                                                                                                               1.7
                                                                                                                                                                    2.0

                                                                                                                                                                                      1.3
                                           by 3.3%.                                                                                                                                   Australia Italy
                                                                                                                                                                                                 2.9%2.8%
                                                         6M       19     20         19        20       19      20        19      20       19      20        19       20        19     20
                                           In the core market Germany, construction activity was hardly                                                                     USA 3.8%
                                                                                                                                                                            Australia 2.9%
                                                                     er n

                                                                                        LV r

                                                                                                            sts

                                                                                                                               ts

                                                                                                                                                us

                                                                                                                                                                  ale

                                                                                                                                                                                    rd s
                                                                                     r ( ne

                                                                                                                                                                                 o a rd
                                                                  at io

                                                                                                                           uc

                                                                                                                                            eo
                                                                           s

                                                                                          L)

                                                                                                                                                                                      s)
                                                                                                         oi

                                                                                                                                                               les

                                                                                                                                                                               db a
                                                                m ulat

                                                                                  be n

                                           affected by the corona pandemic. Revenues on this market
                                                                       ial

                                                                                                                                                               Alpine RegionUSA
                                                                                                                                                                             4.9%3.8%
                                                                                                                         od

                                                                                                                                                                            ar Bo
                                                                                                        I-j
                                                                                m Ve

                                                                                                                                           an

                                                                                                                                                            ho
                                                                                                                       pr
                                                                     s

                                                                                                                                          ell

                                                                                                                                                                          (H iber
                                                                              Lu t e d
                                                                l in

                                                                                                                                                          rw

                                           lifted by 19.3% to € 56.7 million. The situation was similar
                                                                                                                     ial

                                                                                                                                      isc

                                                                                                                                                               Alpine Region 4.9%
                                                              ica

                                                                                                                                                                   Poland 5.1%
                                                                               ina

                                                                                                                                                                            lF
                                                                                                                                                       be
                                                                                                                    ec

                                                                                                                                      M

                                                                                                                                                                        ra

                                           in the Alpine countries (AT, CH, LI), where sales increased by
                                                           og

                                                                                                                                                  Tim
                                                                                                                Sp
                                                                              m

                                                                                                                                                                                                                                         Germany
                                                                                                                                                                     tu
                                                                           La
                                                         ol

                                                                                                                                                             Poland 5.1%
                                                                                                                                                                  Na
                                                      Ec

                                           21.8% to € 7.1 million.                                                                                           Remaining                                                                   39.9%
                                                                                                                                                                                                                                         Germany
                                                                                                                                                   Eastern Europe 6.0%
                                                                                                                                                             Remaining                                                                   39.9%
                                           4 All of the change rates have been calculated based on                                                Eastern Southern
                                                                                                                                                Remaining Europe 6.0%
                                                                                                                                                                   and
                                             non-rounded figures.                                                                                 Western  Europe 6.7%
                                                                                                                                                Remaining Southern and
                                                                                                                                               Western Europe 6.7%
                                                                                                                                            Skandinavian countries 7.0%
                                                                                                                                            Skandinavian countries 7.0%
                                                                                                                                                         United Kingdom 7.1%                                           France 13.9%
                                                                                                                                                                     United Kingdom 7.1%                               France 13.9%
                                           H1 2020: Development sales by markets in € million

                                            70     +19.3%*

                                            60
                                                           56.7
                                                    47.6

                                            50

                                            40
* Rate of change from H1 2019 to H1 2020

                                                                       -1.6%
                                                                                         -37.4%
                                            30
                                                                                                         +33.4%               +9.7%             -0.7%            +2.0%          +21.8%         +24.7%       -36.6%       -27.4%          2.9%
                                                                    20.3

                                                                           20.0

                                            20
                                                                                      16.5

                                                                                                10.3

                                                                                                                10.1

                                                                                                                                                                                                                                               Technisches Hand
                                                                                                                                  9.7

                                            10
                                                                                                                                            8.8
                                                                                                                           8.8

                                                                                                                                                   8.7
                                                                                                         7.6

                                                                                                                                                               7.2

                                                                                                                                                                      7.4

                                                                                                                                                                                       7.1

                                                                                                                                                                                                           6.5
                                                                                                                                                                                5.8

                                                                                                                                                                                                                        5.6
                                                                                                                                                                                                     5.5

                                                                                                                                                                                                                 4.1
                                                                                                                                                                                               4.4

                                                                                                                                                                                                                              4.1

                                                                                                                                                                                                                                     0.6

                                                                                                                                                                                                                                               0.6
                                            €m

                                                    19     20       19        20         19     20       19       20       19       20      19       20        19       20       19     20     19    20    19     20    19    20         19    20
                                                           y

                                                                           e

                                                                                               m

                                                                                                                                tri n

                                                                                                                        Be Eur ern

                                                                                                                             ol ern

                                                                                                                                                                     d

                                                                                                                                                                                   te rla n

                                                                                                                                                                                                     A

                                                                                                                                                                                                                 a

                                                                                                                                                                                                                              ly

                                                                                                                                                                                                                                              ld
                                                         an

                                                                                                                                                                                                                ali
                                                                         nc

                                                                                                                             un ia

                                                                                                                                                                                ch ze gio
                                                                                                                                                                    an

                                                                                                                                                                                                 US

                                                                                                                                                                                                                          Ita

                                                                                                                                                                                                                                              or
                                                                                           do

                                                                                                                                   es

                                                                                                                             Lu e

                                                                                                                                   d)

                                                                                                                                                                                       te ,
                                                                                                                          co inav

                                                                                                                                                                                     ns nd
                                                                                                                                  th

                                                                                                                          t P ast

                                                                                                                                                                                                            str
                                                     rm

                                                                       F ra

                                                                                                                          Ne op

                                                                                                                                                                    l

                                                                                                                                                                                                                                         W
                                                                                                                                                                 Po
                                                                                                                                an

                                                                                                                                                                             Lie wit e Re
                                                                                         ng

                                                                                                                                x)

                                                                                                                                                                                         in)
                                                                                                               (in er ou

                                                                                                                                                                                                           Au
                                                                                                                        ou E
                                                   Ge

                                                                                                                                                                                                                                     of
                                                                                                                              d
                                                                                     Ki

                                                                                                                             S

                                                                                                                    ith ing
                                                                                                                           an

                                                                                                                                                                               a, lpin

                                                                                                                                                                                                                                    st
                                                                                    d

                                                                                                                 W aing
                                                                                                                   cl. n
                                                                                                       Sc
                                                                                   ite

                                                                                                                (w ain

                                                                                                                                                                                                                                    Re
                                                                                                                                                                                  A
                                                                                                                        t

                                                                                                                                                                                 S
                                                                                Un

                                                                                                            an em
                                                                                                                     es

                                                                                                             pe m
                                                                                                          ro R e

                                                                                                                                                                             tri
                                                                                                                 R
                                                                                                              d

                                                                                                                                                                          us
                                                                                                                                                                          (A
                                                                                                       Eu

                                                                                                                                                                                                            STEICO Half-Year Report 2020             9
Group management report for STEICO SE as of 30 June 2020

                                            Revenues on the Scandinavian market lifted by 33.4% to                      4.      GROWTH IN THE PRODUCT SEGMENTS
                                            € 10.1 million. A significant proportion of revenues are
                                                                                                                        The trend towards ecological building products and timber
                                            generated with distributors who continue to export STEICO
                                                                                                                        construction continues unabated in all sales markets.
                                            products, for example to countries in the Middle East.
                                                                                                                        Revenue declines in individual markets are mainly due to
                                            In the remaining countries of Western and Southern Europe,                  corona restrictions in the second quarter.
                                            sales increased by 9.7% to € 9.7 million. The increase is
                                                                                                                        In the ecological insulating materials segment, an increase
                                            driven in particular by the BeNeLux countries, where corona
                                                                                                                        in sales of 10.3% to € 94.6 million was achieved in the first
                                            restrictions were not as strict as in Southern European
                                                                                                                        half of the year – proof of the continuing attractiveness of
                                            countries.
                                                                                                                        ecological building products.
                                            STEICO's production at its Polish locations was not impacted
                                                                                                                        Sales of laminated veneer lumber increased by 13.3% to
                                            by corona restrictions. Nevertheless, restrictions in public life
                                                                                                                        € 18.0 million.
                                            led to a temporarely more difficult sales situation. In Eastern
                                            European countries (excluding Poland) sales fell by 0.7% to                 In contrast, sales of I-joists declined by 32.3% to € 14.6
                                            € 8.7 million. In Poland, revenues increased by 2.0% to € 7.3               million. This was primarily due to the more difficult supply
                                            million.                                                                    of the markets in Great Britain and Australia as a result of
                                                                                                                        corona restrictions.
                                            The USA are shown separately as a sales market for the first
                                            time due to its increasing importance. The company mainly                   Sales of special products were up by 13.5% to € 9.8 million,
                                            sells special products that are used, for example, in road                  a development that is largely characterised by the sales
                                            construction. Revenues on this market lifted by 24.7% to €                  markets in the USA and the Scandinavian countries.
                                            5.5 million.
                                                                                                                        The Miscellaneous segment grew in the first six months by
                                            Due to the corona pandemic, it was temporarily not possible                 21.3% to € 3.9 million.
                                            to supply the Australian market. Accordingly, sales fell by
                                            36.6% to € 4.1 million. The main products supplied to
                                            Australia are laminated veneer lumber (LVL) and I-joists.

                                            Within the Italian market, STEICO
                                            products are primarily sold in the
                                            northern regions. Some of these regions
                                            were particularly affected by the corona
                                            pandemic. A decline in sales of 27.4%
                                            to € 4.1 million had to be recorded.               H1 2020: Development sales by product groups in € million

                                                                                                          +10.3%*
                                                                                               105
                                                                                                                 94.5
                                                                                                          85.7

                                                                                                90

                                                                                                75

                                                                                                60
* Rate of change from H1 2019 to H1 20120

                                                                                                45
                                                                                                                          +13.3%       -32.3%           +13.5%
                                                                                                30
                                                                                                                                       21.6
                                                                                                                                17.9

                                                                                                                                                                       +21.3%           -31.6%           -19.2%
                                                                                                                         15.9

                                                                                                                                              14.6

                                                                                                15
                                                                                                                                                              9.7
                                                                                                                                                        8.6

                                                                                                                                                                       3.2

                                                                                                                                                                             3.9
                                                                                                 €m

                                                                                                                                                                                        3.0

                                                                                                                                                                                                         1.7
                                                                                                                                                                                               2.0

                                                                                                                                                                                                               1.3

                                                                                                 6M       19     20       19    20     19     20        19    20       19    20         19     20        19    20
                                                                                                            er n

                                                                                                                                LV r

                                                                                                                                            sts

                                                                                                                                                              ts

                                                                                                                                                                             us

                                                                                                                                                                                              ale

                                                                                                                                                                                                               rd s
                                                                                                                             r ( ne

                                                                                                                                                                                                            o a rd
                                                                                                         at io

                                                                                                                                                           uc

                                                                                                                                                                          eo
                                                                                                                  s

                                                                                                                                  L)

                                                                                                                                                                                                                 s)
                                                                                                                                         oi

                                                                                                                                                                                          les

                                                                                                                                                                                                          db a
                                                                                                       m ulat

                                                                                                                          be n
                                                                                                              ial

                                                                                                                                                        od

                                                                                                                                                                                                       ar Bo
                                                                                                                                        I-j
                                                                                                                        m Ve

                                                                                                                                                                        an

                                                                                                                                                                                        ho
                                                                                                                                                      pr
                                                                                                            s

                                                                                                                                                                       ell

                                                                                                                                                                                                     (H iber
                                                                                                                      Lu t e d
                                                                                                       l in

                                                                                                                                                                                     rw
                                                                                                                                                     ial

                                                                                                                                                                    isc
                                                                                                      ica

                                                                                                                       ina

                                                                                                                                                                                                       lF
                                                                                                                                                                                   be
                                                                                                                                                   ec

                                                                                                                                                                   M

                                                                                                                                                                                                    ra
                                                                                                     og

                                                                                                                                                                               Tim
                                                                                                                                                Sp
                                                                                                                   m

                                                                                                                                                                                                tu
                                                                                                                 La
                                                                                                  ol

                                                                                                                                                                                              Na
                                                                                                 Ec

                                10          STEICO Half-Year Report 2020
Half-Year Report 2020

      Group management report for STEICO SE as of 30 June 2020

      The timber wholesale segment fell by 31.6% to € 2.0                 III. NET ASSETS, FINANCIAL POSITION AND
      million. This development is largely influenced by the corona            RESULTS OF OPERATIONS
      restrictions in the UK. On the UK market STEICO operates a
      timber wholesale and sells products to supplement its I-joists.     As a result of the reclassifications there may be differences
                                                                          compared to the previous year’s figures.
      Sales of natural fibreboards (hardboard) declined by 19.2%
      to € 1.3 million. In particular, this development reflects the
                                                                          1.   RESULTS OF OPERATIONS
      fact that fibreboards are increasingly being used within the
      company as a component for I-joists and that sales to third         In total, the STEICO Group’s revenues lifted by 3.3% to
      parties are of no strategic importance.                             € 144.2 million in the first half of the year (previous year:
                                                                          € 139.6 million) which is due to both the high demand for
                                                                          environmentally friendly insulation materials as well as the
                                                                          increases in laminated veneer lumber.

                                                                          In the first half of the year, there was a reduction of € 1.9
                                                                          million in inventories of finished and unfinished goods. Stocks
                                                                          that were built up as planned during the winter months are
                                                                          sold off continuously during the construction season. Total
                                                                          operating revenue amounted to € 142.3 million (previous
                                                                          year: € 140.5 million).

                                                                          At 55.6%, the cost of materials ratio has returned to normal
                                                                          following an increase in the first half of 2019 (57.0%). The
                                                                          transition in heat production from coal to biomass has had
                                                                          an impact here.

                                                                          The personnel expenses ratio in the first six months was
                                                                          17.8% (previous year: 17.3%) and thus grew at a higher than
                                                                          average rate.

                                                                          Amortisation of intangible fixed assets and depreciation of
                                                                          tangible fixed assets amounted to € 11.5 million (previous
                                                                          year: € 12.2 million). It should be noted that this item rose
                                                                                    sharply in the previous year due to a special effect.
H1 2020: Ratio revenues by products                                                 In addition, the rise in the price of CO2 certificates
                                                                                    has had a significant impact on this item. The costs
Natural Fiber Boards (Hardboards) 0.9%                                              for the requisite CO2 certificates are capitalized
Natural Fiber Timber
              Boards wholesale  1.4%
                     (Hardboards)  0.9%                                             as other assets upon acquisition. When the CO2
                Miscanellous 2.7%
              Timber wholesale 1.4%                                                 certificates are later consumed, a corresponding
      Special products  6.7%2.7%
                Miscanellous                                                        write-down is made, which increases this item. By
      Special products 6.7%                                                         switching from coal to biomass, this effect will no
       I-joists 10.1%                                                               longer be noticeable in 2020, as significantly fewer
       I-joists 10.1%                                                               CO2 certificates will be needed.

                                                                                    Other operating expenses totalled € 16.7 million on
                                                              Ecological Insulation
                                                              Materials             31 December 2019 (previous year: € 13.1 million).
                                                              Ecological65.5%
                                                                         Insulation
                                                                                    The margin is 11.7% (previous year: 9.3%). This
                                                              Materials 65.5%
  Laminated Veneer                                                                  increase is due to factors including higher expenses
 Lumber (LVL)Veneer
  Laminated   12.5%                                                                 from exchange rate differences.
 Lumber (LVL) 12.5%
                                                                                   The financial result totals € -0.6 million (previous
                                                                                   year: € -0.5 million). Consolidated net income for
                                                                                   the first six months totaled € 7.5 million (previous
                                                                                   year: € 9.2 million).

 H1 2020: Ratio revenues    by markets
                 Rest of World   0.4%
                         Italy 2.8%
                 Rest of World   0.4%                                                                                                         11
                                                                                                               STEICO Half-Year Report 2020
                 Australia Italy
                            2.9%2.8%
                  USA 3.8%
Charts

     Group management report for STEICO SE as of 30 June 2020

     Q2 – viewed in isolation                                           3.    LIQUIDITY

     Revenues of € 69.7 million were recorded in the second
                                                                       H1 2020: Cash flows in € millions
     quarter (previous year: € 68.6 million) This corresponds to
     an increase of 1.6%. Total operating revenues amounted to
                                                                         50
     € 69.8 million (previous year: € 69.7 million)                                                        13.8       -22.5
                                                                         40
     Gross profits amounted to € 31.9 million (previous year:
                                                                                                 9.4
     € 32.9 million).                                                    30
                                                                                     22.1                                         0.7        21.3
     EBITDA in the second quarter fell by 10.4% to € 11.6                20
     million (previous year: € 12.9 million). EBIT fell by 12.5%
                                                                         10
     to € 6.2 million (previous year: € 7.1 million). The EBITDA

                                                                         €m
     margin is 16.6% (previous year: 18.6%), the EBIT margin is
     8.9% (previous year: 10.1%).

                                                                                                        tiv om

                                                                                                        tiv om

                                                                                                                  ge

                                                                                                           rio t
                                                                                                           rio t

                                                                                                        tiv om

                                                                                                        pe ts a
                                                                                                        pe ts a

                                                                                                               es

                                                                                                               es

                                                                                                                d
                                                                                                                d

                                                                                                               es

                                                                                                             an
                                                                                                   ac fr

                                                                                                   ac fr
                                                                                                   ac fr

                                                                                                 th len
                                                                                                 th len

                                                                                                           iti

                                                                                                           iti
                                                                                                           iti

                                                                                                          ch
                                                                                              ing ow

                                                                                                 g w
                                                                                                 g w
     2.   FINANCIAL POSITION AND NET ASSETS

                                                                                             tin flo
                                                                                            cin flo

                                                                                             of uiva
                                                                                             of iva

                                                                                                     ed
                                                                                                      fl

                                                                                                    e
                                                                                                    e
                                                                                          rt qu

                                                                                                 lat
                                                                                         er sh

                                                                                          es h
                                                                                         an sh

                                                                                       en h eq
                                                                                                 s
                                                                                   o p Ca

                                                                                     i n v Ca
                                                                                    sta e

                                                                                    fin Ca

                                                                                              re
     Total assets increased slightly as of 30 June 2020 to around
                                                                                  e sh

                                                                                           at

                                                                                          ge

                                                                                th cas
                                                                                          d
                                                                               th ca

                                                                                     an
     € 365.3 million compared to 31 December 2019 (€ 354.6

                                                                                    d
                                                                                    d

                                                                                  ch

                                                                                   e
                                                                                 an
                                                                                an

                                                                              Ex

                                                                             sh
                                                                        sh

     million).

                                                                          Ca
                                                                       Ca

     In line with the ongoing investment projects, property, plant
     and equipment increased to € 251.3 million (31 December
                                                                        Cash flow from operating activities
     2019: € 249.4 million).
                                                                        During the past six months, the STEICO Group recorded a
     The increase in receivables and other assets to € 47.8 million           Fertigbauquote in Deutschland
                                                                        cash flow from operating activities of € 9.4 million (2019
     is due to the higher order volumes in the summer months,
                                                                        as a whole:
                                                                                23    € 43.4 million). During the first six months of
     as was also the case in previous years (31 December 2019:
                                                                        the year the cash flow from operating activities is generally
     € 34.3 million).                                                           22
                                                                        impacted by a particularly high level of trade receivables and,
     On 30 June 2020 the item cash in hand and bank balances            as a result,
                                                                                21 the high volume of business due to construction
     amounted to € 21.3 million (31 December 2019: € 22.1               activities in the summer months.                                            +10,7%
                                                                               20                                                                           19,7
     million). This downturn is due to the ongoing capital
                                                                        Cash flow from investing activities
     expenditure.                                                              19
                                                                                                                                        +4,7%
                                                                        The cash flow from investing activities totaled € -22.5 million
     Equity and liabilities are characterised by an increase in                 18                                                      17,8
                                                                        in the first six months of 2020 (2019 as a whole:+4,9%
                                                                                                                             € -49.5
     liabilities to banks to € 126.1 million (31 December 2019:                                                                   17,0
                                                                        million)17and is mostly due to payments +3,2%
                                                                                                                   made for investments
     € 107.8 million). This is due to the ongoing investment                                            +2,6 %
                                                                        in property, plant and+1,3
                                                                                                equipment.
                                                                                                   %         The largest16,2
                                                                                                                         blocks of
     projects, which are financed via the existing syndicated credit            16                             15,7
                                                                        investment in this context 15,3
                                                                                                     are expenditures for the expansion
     agreement.                                                                            15,1
                                                                        of element
                                                                                15 production, the construction of an electric turbine
     On 30 June 2019 equity amounted to € 182.6 million                 and measures to increase capacity and efficiency.
                                                                               %

     (31 December 2019: € 190.3 million). This corresponds
     to an equity ratio of around 50.0% (31 December 2019:
                                                                                          11

                                                                                                    12

                                                                                                              13

                                                                                                                         14

                                                                                                                                   15

                                                                                                                                              16

                                                                                                                                                         17
                                                                                        20

                                                                                                  20

                                                                                                             20

                                                                                                                       20

                                                                                                                                  20

                                                                                                                                            20

                                                                                                                                                       20

     53.7%). The lower equity ratio is solely due to the change in
     the PLN/EUR exchange rate compared with the 2019 balance
                                                                                    Baugenehmigungen für Ein- und Zweifamilienhäuser in Fertigbauweise
     sheet date.
                                                                                    (überwiegend Holzbau). Quelle: Bundesverband Deutscher Fertigbau e.V.

                                                                              Technisches Handbuch STEICO construction

12   STEICO Half-Year Report 2020
Half-Year Report 2020

Group management report for STEICO SE as of 30 June 2020

Cash flow from financing activities                                 D. OPPORTUNITY AND RISK REPORT,
                                                                       FORECAST
The cash flow from financing activities was positive in
the first six months at € 13.8 million (2019 as a whole:            The comments in the opportunity and risk report and in the
€ 8.9 million). This item is characterised by receipts and          forecast are, by their very nature, associated with a certain
payments from funds from the syndicated loan to finance             degree of forecasting uncertainty. Please refer to STEICO's
investment projects and dividend payments.                          2019 Annual Report for a detailed presentation of risks and
                                                                    opportunities.
As of 30 June 2020 the STEICO Group’s cash and cash
equivalents totaled € 21.3 million (start of the period:
€ 22.1 million). This is deposited in current accounts. The
group pursues a risk-minimising investment approach which           I.   FORECAST
ensures that liquidity is guaranteed until it is used for further
investments.                                                        The management continues to take a positive view of the
                                                                    second half of 2020. The European construction industry is
                                                                    still characterized by a high degree of stability – in addition,
                                                                    the second half of the year is likely to be characterized by
IV. NON-FINANCIAL PERFORMANCE INDICATORS
                                                                    positive growth impetus and catch-up effects as a result of
                                                                    the easing of corona restrictions currently being implemented
Environmental protection
                                                                    in many countries.
As a sales company with an extensive product range of
                                                                    For 2020, the Board of Directors continues to expect
environmentally friendly products, the STEICO Group attaches
                                                                    revenues to be between the previous year’s level and plus 5%
great importance to having a low environmental impact
                                                                    growth. Due to the current positive growth it is forecasting
and saving natural resources. This includes the sustainable
                                                                    an EBIT ratio of between 8.5% and 9.5% (in terms of total
procurement of raw materials as well as the conversion of
                                                                    operating revenue).
the internal energy supply from fossil to renewable energy
sources. Detailed information on the STEICO Group's
environmental protection activities can be found in the
STEICO Sustainability Report at www.steico.com or in the
STEICO Annual Report 2019.

Staff

As of 30 June 2020 the STEICO Group had an average of
1,807 employees (without suspended employees) (previous
year: 1,778). The STEICO Group’s employees play a key role
in the group’s long-term success. STEICO companies aim to
acquire highly qualified staff and keep them in the group.
This is based on an open corporate culture, which is based on
flat hierarchies, respect and a willingness to perform. Training
activities are actively promoted to reinforce employee loyalty.

C. REPORT ON EVENTS AFTER THE
   BALANCE SHEET DATE
There were no special events between 30 June 2020 and the
date on which this report was published.

                                                                                                         STEICO Half-Year Report 2020   13
STEICO Half-Year Report 2020

                                    This page does not have any content for technical reasons

14   STEICO Half-Year Report 2020
Half-Year Report 2020

Consolidated income statement 1 January - 30 June 2020

                                                                                                6M 2020               6M 2019
                                                                                                       €                     €

 1.   Revenues                                                                            144.163.570,43        139.571.990,17
 2.   Increase in finished goods and work in progress                                      -1.941.333,65            867.256,15
 3.   Other own work capitalised                                                               75.125,19             27.197,94
                                                                                          142.297.361,97       140.466.444,26

 4.   Other operating income                                                                2.559.599,78          3.010.142,04

                                                                                          144.856.961,75       143.476.586,30

 5.   Cost of materials
      a) Cost of raw materials, consumables and
         supplies and for purchased goods                                                  -78.988.477,29       -79.707.616,05
      b) Cost of purchased services                                                           -171.117,18          -411.627,67

 6.   Gross profits                                                                        65.720.108,52        63.357.342,58

 7.   Personnel expenses
      a) Wages and salaries                                                                -20.415.662,93       -19.657.107,08
      b) Social security and expenses for retirement benefits                               -4.918.184,37         -4.613.897,39
 8.   Amortization of intangible fixed assets and depreciation of tangible fixed assets    -11.485.329,75       -12.276.188,07
 9.   Other operating expenses                                                             -16.667.785,00       -13.105.112,51

 10. EBIT                                                                                  12.210.405,23        13.705.037,53

 11. Other interest and similar income                                                        251.445,23            386.367,50
 12. Interest and similar expenses                                                           -853.736,48           -883.217,45
 13. Financial result                                                                        -602.291,25           -496.849,95

 14. Earnings before taxes                                                                 11.608.113,98        13.208.187,58

 15. Income taxes                                                                           -2.843.100,04         -2.855.275,30

 16. Earnings after taxes                                                                   8.765.013,94        10.352.912,28

 17. Other taxes                                                                            -1.275.277,63         -1.195.503,50

 18. Consolidated net income for the period                                                 7.489.736,31          9.157.408,78

 19. Profit carried forward from previous year                                             67.425.018,21         48.158.835,09
 20. Consolidated profits                                                                  74.914.754,52        57.316.243,87

                                                                                                            STEICO Half-Year Report 2020   15
STEICO Consolidated Balance Sheet as of 30 June 2020

          | ASSETS
                                                                                                        30 June 2020     30 June 2019
                                                                                                                  €                €

     A,    NON-CURRENT ASSETS
           I,     Intangible assets
                  1, Acquired concessions. industrial property rights and similar rights and assets
                     as well as licenses for such rights and assets,                                      871,637.29     1,872,870.59
                                                                                                         871,637.29     1,872,870.59

           II,    Property. plant and equipment
                  1, Land. land rights and buildings including
                     buildings on third-party land                                                     69,283,819.94    60,229,003.77
                  2, Technical plant and machinery                                                    106,282,594.08   114,088,461.58
                  3, Other assets. operating and office equipment                                       2,222,485.95     2,504,605.93
                  4, Advances made and assets under construction                                       73,556,548.79    59,487,698.36
                                                                                                      251,345,448.76   236,309,769.64
           III,   Financial assets
                  1, Interests in affiliated companies                                                      2,004.04         2,101.38
                  2, Loans to affiliated companies                                                         13,913.82        29,414.53
                  3, Other loans                                                                            8,000.00       211,700.00
                                                                                                           23,917.86      243,215.91

                                                                                                      252,241,003.91   238,425,856.14

       B, CURRENT ASSETS
           I,     Inventories
                  1, Raw materials. consumables and supplies                                           19,908,720.24    17,981,799.56
                  2, Work in progress                                                                   1,317,966.67     2,033,544.00
                  3, Finished goods and merchandise                                                    18,301,253.20    15,538,536.24
                  4, Advance payments made                                                                137,308.50        42,004.58
                                                                                                       39,665,248.61    35,595,884.38

           II,    Receivables and other assets
                  1, Trade receivables                                                                 30,627,437.41    28,613,388.82
                  2, Receivables from affiliated companies                                                  1,723.11           301.14
                  3, Other assets                                                                      17,187,172.35    17,078,506.58
                                                                                                       47,816,332.87    45,692,196.54

           III,   Securities
                  Other securities                                                                        385,655.41       137,419.15

           IV,    Cash in hand and bank balances                                                       21,292,087.42    16,914,353.73

                                                                                                      109,159,324.31    98,339,853.80

       C, DEFERRED INCOME                                                                               3,149,780.87     3,303,261.20

      D, DEFERRED TAX ASSETS                                                                             711,629.59      1,176,375.47

                                                                                                      365,261,738.68   341,245,346.61

16   STEICO Half-Year Report 2020
Half-Year Report 2020

STEICO Consolidated Balance Sheet as of 30 June 2020

     | EQUITY AND LIABILITIES
                                                                    30 June 2020          30 June 2019
                                                                              €                       €

A.    EQUITY
      I.     Subscribed capital                                    14.083.465,00         14.083.465,00
      II.    Additional paid-in capital                           104.911.923,60        104.911.923,60
      III.   Retained earnings
             Other retained earnings                                7.050.000,00          7.050.000,00
      IV.    Difference in equity from currency translation       -18.387.911,23         -6.726.090,99
      V.     Consolidated profits                                  74.914.754,52         57.316.243,87
                                                                  182.572.231,89        176.635.541,48

B.    PROVISIONS
             1. Provisions for pensions and similar obligations     2.496.091,05           3.215.365,33
             2. Provisions for taxes                                2.654.417,20           2.368.790,33
             3. Other provisions                                   12.382.484,98          11.392.578,59
                                                                   17.532.993,23         16.976.734,25

C.    LIABILITIES
             1. Liabilities to banks                              126.103.613,00        110.505.682,00
             2. Advance payments received on account of orders         51.476,77              32.073,69
             3. Trade payables                                     17.580.536,32          19.164.690,19
             Liabilities to affiliated companies                    6.030.000,00                   0,00
             4. Other liabilities                                  14.297.004,58          16.582.740,68
                                                                  164.062.630,67        146.285.186,56

D.    PREPAID EXPENSES                                                 38.237,89              6.701,53

E.    DEFERRED TAX LIABILITIES                                      1.055.645,00          1.341.182,79

                                                                  365.261.738,68        341.245.346,61

                                                                              STEICO Half-Year Report 2020   17
STEICO Consolidated cash flow statement for H1 2020

                                                                                                                          01.01.-30.06.2020 01.01.-31.12.2019
                                                                                                                                         €                 €

     I.     CASH FLOW FROM OPERATING ACTIVITIES
            1.         Earnings for the period (consolidated net income/loss)                                                7,489,736.31     22,787,040.87
            2.   +/-   Amortization/depreciation of non-current assets                                                      11,485,329.75     24,223,735.44
            3.   +/-   Increase/decrease in provisions                                                                       2,675,990.31        -261,326.74
            4.   +/-   Other non-cash expense/income                                                                           -75,125.19        -129,394.58
            5.   -/+   Increase/decrease in inventories, trade receivables and other
                       assets that are not allocated to investing or financing activities                                  -10,294,554.39     -10,257,315.19
            6.   +/-   Increase/decrease in trade payables and other liabilities that are not allocated to investing or
                       financing activities                                                                                 -1,360,359.50       5,230,133.88
            7.   +/-   Gains/losses from the disposal of non-current assets                                                     16,653.29         -48,905.46
            8.   +/-   Interest expense/income                                                                                 602,291.25       1,057,809.23
            9.   +/-   Income tax expense/income                                                                             2,843,100.04       6,118,284.98
            10. -/+    Income tax payments                                                                                  -3,970,773.54      -5,358,499.50
            11. =      Cash flow from operating activities                                                                  9,412,288.33      43,361,562.93

     II.    CASH FLOW FROM INVESTING ACTIVITIES
            1.   -     Payments made for investments in intangible non-current assets                                         -707,579.63      -3,478,144.25
            2.   +     Proceeds received from disposals of items of property, plant and equipment                               36,589.45        147,919.73
            3.   -     Payments made for investments in property, plant and equipment                                      -22,236,809.08     -46,814,788.64
            4.   +     Proceeds received from disposals of financial assets                                                    167,228.47          36,471.53
            5.   -     Payments made for investments in financial assets                                                              0.00         -4,884.62
            6.   +     Interest received                                                                                       251,445.23         654,565.24
            7.   =     Cash flow from investing activities                                                                -22,489,125.56     -49,458,861.01

     III.   CASH FLOW FROM FINANCING ACTIVITIES
            1.   +     Proceeds received from taking out (financial) loans                                                  24,667,652.00     27,105,387.00
            2.   -     Payments made from redeeming bonds and (financial) loans                                             -6,337,554.00     -12,903,680.00
            3.   -     Interest paid                                                                                        -1,007,016.74      -1,817,871.44
            4.   -     Dividends paid to shareholders of the parent company                                                 -3,520,866.26      -3,520,866.25
            5.   =     Cash flow from financing activities                                                                 13,802,215.00       8,862,969.31

     IV. CASH AND CASH EQUIVALENTS
            1.         Net change in cash and cash equivalents                                                              -1,555,175.55       2,765,671.23
            2.   +/-   Exchange-rate related change in cash and cash equivalents                                            22,121,885.20         592,344.10
            3.   +     Cash and cash equivalents - start of period                                                          21,292,087.42     18,763,869.87
            4.   =     Cash and cash equivalents - end of period                                                           21,292,087.42      22,121,885.20

18   STEICO Half-Year Report 2020
Half-Year Report 2020

STEICO Notes to the consolidated financial statements

I.   GENERAL INFORMATION ON THE                                    longer apply, these are written up according to Section 253
     CONSOLIDATED FINANCIAL STATEMENTS                             (5) sentence 1 of the HGB.

                                                                   Inventories are measured at cost. Items with impaired
1.   LEGAL FOUNDATIONS                                             marketability are written down to their lower fair value.

The regulations set out in Sections 294 ff. of the                 As a rule, receivables and other assets are carried at face
Handelsgesetzbuch (HGB - German Commercial Code)                   value.
apply for the consolidated financial statements. The
                                                                   In order to cover the risk of default, individual and lump-sum
consolidated financial statements are prepared based on legal
                                                                   write-downs are formed for receivables to the extent
requirements.
                                                                   required. When forming individual write-downs, the company
                                                                   takes into account the fact that some receivables are covered
2.   CONSOLIDATED ACCOUNTING AND VALUATION
                                                                   by commercial credit insurance.
     METHODS
                                                                   Securities under current assets are carried at acquisition cost
The Group applies the principles of the German Commercial
                                                                   or at their lower fair value.
Code for its accounting and valuation methods. According to
Section 308 (1) of the HGB, the assets and liabilities included    Cash in hand and bank balances are carried at face value.
on the consolidated balance sheet are subject to a uniform
                                                                   Expenses prior to the balance sheet date that relate to
valuation in line with the valuation methods which apply for
                                                                   expenses for a limited period after the balance sheet date are
the parent company’s annual financial statements.
                                                                   carried as prepaid expenses. The accounting option offered
The consolidated balance sheet and consolidated income             in Section 250 (3) Sentence 1 of the HGB to form a discount
statement are classified according to Sections 266, 275 (2) of     has been used. The item is reversed using the straight-line
the HGB in connection with Section 298 of the HGB.                 method in line with time.

The following individual accounting and valuation methods          Deferred tax assets result from temporary differences
were applied:                                                      between tax losses carried forwards and consolidation. The
                                                                   tax relief resulting at an individual company level has been
Internally generated intangible assets are capitalised at cost
                                                                   capitalised according to the option offered in Section 274 in
and subject to scheduled amortisation over their expected
                                                                   connection with Section 306 of the HGB.
useful lives. Patents, concessions, licenses and software are
written down over 2-5 years, rights of usufruct are written        Provisions for pensions are calculated on the balance sheet
down over 20 years.                                                date in line with Section 253 (2) of the HGB using the
                                                                   projected unit credit method based on an average market
Property, plant and equipment is valued at cost according
                                                                   interest rate and an assumed residual period of 15 years.
to Section 253 of the HGB in connection with Section 255
                                                                   This is announced by Deutsche Bundesbank in line with the
of the HGB, less scheduled depreciation in line with the
                                                                   corresponding legal provisions. On the balance sheet date
standard useful lives in the industry.
                                                                   this liability was netted with the re-insurance in line with
Buildings are depreciated using the straight-line method,          Section 246 (2) Sentence 2 of the HGB. The netted assets are
with both the straight-line and declining balance methods          valued at fair value according to Section 253 (1) Sentence 4
being used for machines. Office equipment and IT hardware          of the HGB.
is written down using both the straight-line and declining
                                                                   Provisions for taxes and all other provisions are formed for
balance methods.
                                                                   all recognizable risks and uncertain liabilities in the amount
Low-value items of property, plant and equipment have              required for fulfillment according to prudent commercial
been written off immediately through profit and loss since         judgement. The amount required for fulfillment is calculated
1 January 2011.                                                    taking future price and cost increases into account.

As a rule, financial assets are carried at cost or, in the event   Provisions with a remaining term of more than one year are
of permanent impairment, at their lower fair value on the          discounted over their remaining term in line with the average
balance sheet date.                                                market interest rate for the past seven fiscal years (Section
                                                                   253 (2) Sentence 1 of the HGB).
If the reasons for maintaining a lower carrying amount no
                                                                   Liabilities are included at their repayment amounts.

                                                                                                        STEICO Half-Year Report 2020   19
STEICO Notes to the consolidated financial statements

     Deferred tax liabilities result from temporary differences       4.   SUPERVISORY BOARD
     to the carrying amounts in the tax base for the companies
                                                                      STEICO’s Supervisory Board comprises 4 members.
     included.
                                                                      Mr. Udo Schramek, Munich, Chairman, Managing Director
     3.   CURRENCY TRANSLATION                                        and Chairman of the Supervisory Board

     Receivables and liabilities denominated in foreign currencies    Professor Dr. h. c. Heinrich Köster, Stephanskirchen, Deputy
     are translated using the exchange rate on the date of the        Chairman of the Supervisory Board, President of the
     transaction. Assets and liabilities denominated in foreign       Rosenheim University of Applied Sciences
     currencies with a residual period of less than one year are
                                                                      Ms Katarzyna Schramek, Munich, attorney
     subsequently valued on the balance sheet date using the
     average spot exchange rate on the balance sheet date.            Dr. Jürgen Klass, Munich, attorney

     Foreign statements prepared in foreign currencies for the
                                                                      5.   DIRECTORS
     Group’s subsidiaries in Poland and England are translated
     using the “modified balance sheet date method” set out in        STEICO SE’s Board of Directors comprises 6 members.
     Section 308a of the HGB.
                                                                      Mr. Udo Schramek, Munich, Chairman and Managing
     With the exception of equity, items on the balance sheet are     Director of STEICO SE - responsible for R&D, quality
     translated using the rate on the balance sheet date; items       assurance, marketing, purchasing, business sector
     in the income statement are translated using the average         development, application technology, IT, legal and HR.
     exchange rate for the fiscal year; equity is translated using
                                                                      Mr. Uwe Lange, Berga, Managing Director for line
     the historical rate.
                                                                      construction and investment project maagement.
     The parent company’s functional currency is the group’s
                                                                      Mr. Thorsten Leicht, Landshut Managing Director for
     currency (euros).
                                                                      Processes and Quality Management, Production, Quality and
     Differences in the consolidation of liabilities resulting from   Sustainability Management
     exchange rates are taken directly to equity under Currency
                                                                      Dr. David Meyer, Munich, Managing Director for finance,
     translation differences.
                                                                      accounting & controlling and investor relations.
     The exchange rates for PLN/€ are:
                                                                      Mr. Milorad Rusmir, Kirchheim, Managing Director for wood
     Closing rate on 30 June 2020:           4.45600                  wholesale
     Average rate in H1 2020: 		             4.43608
                                                                      Mr. Tobias Schindler, Sistrans (Austria), Managing Director for
     The exchange rates for GBP/€ are:                                Sales.

     Closing rate on 30 June 2020:           0.91243
     Average rate in H1 2020: 		             0.87583

20   STEICO Half-Year Report 2020
You can also read