Country fiche on pension for the Republic of Slovenia - the 2021 round of projections for the Ageing Working Group, September 2020 - version ...
←
→
Page content transcription
If your browser does not render page correctly, please read the page content below
Country fiche on pension for the Republic of Slovenia – the
 2021 round of projections for the Ageing Working Group,
                     September 2020
                      (version 30.3.2021)

                              1
Table of content
1.      Overview of the pension system ........................................................................................... 3
     1.1.      Description ......................................................................................................................... 3
     1.2.      Recent reforms of the pension system included in the projections ....................... 9
     1.3.      Description of the actual “constant policy” assumptions used in the projection
               11
2.      Overview of the Demographic and labour forces projections ....................................... 13
     2.1.      Demographic development ........................................................................................... 13
     2.2.      Labour force..................................................................................................................... 14
3.      Pension projection results.................................................................................................... 17
     3.1       Extent of the coverage of the pension schemes in the projections ..................... 17
     3.2.      Overview of projection results ..................................................................................... 18
     3.3. Description of main driving forces behind the projection results and their
     implications for main items from a pension questionnaire ............................................... 20
     3.4.      Financing of the pension system ................................................................................ 26
     3.5.      Sensitivity analysis......................................................................................................... 27
     3.6. Description of the changes in comparison with the 2006, 2009, 2012, 2015, 2018
     and 2021 projections ................................................................................................................. 30
4.      Description of the pension projection model and its base data ................................... 32
     4.1.      Institutional context in which those projections are made..................................... 32
     4.2.      Assumptions and methodologies applied ................................................................. 32
     4.3.      Data used to run the model........................................................................................... 32
     4.4.      Reforms incorporated in the model ............................................................................ 33
     4.5.      General description of the model(s)............................................................................ 33
     4.6.      Additional features of the projection model .............................................................. 34
Methodological annex ................................................................................................................... 35

                                                                          2
1.      Overview of the pension system

1.1.    Description

Pension and disability insurance system in Republic of Slovenia (1. pillar) is based on inter-
generational contract and is therefore a pay-as-you-go system. The system is uniform and
mandatory for all employed persons and other persons generating certain income from
employment or other gainful activity, while inactive persons can join the system voluntarily. They
are all included in the compulsory insurance scheme under the same act, i.e. the Pension and
Disability Insurance Act (ZPIZ-2), and covered by the same insurance provider - the Institute of
Pension and Disability Insurance of Slovenia (ZPIZ).

Pension system in general includes, besides 1. pillar, also occupational pension scheme and
second non mandatory private scheme.

Compulsory insurance – first pillar

The compulsory insurance scheme includes old age and early pensions, disability pensions,
survivors’, widow/ers’ and partial pensions. The system covers also the disability insurance
rights1, rights on assistance and attendance allowance, part of a widow/ers’ pension and other
rights (annual grant). Outside the compulsory insurance the system covers also special rights
for farmers and military pensions, part of the military widow/ers’ pension, advance pension
payment and other pensions and rights under special acts. The structure of pensioners
according to the type of pensions is changing, with increasing share of old age and early
pensioners.

The last major reform of pension system was introduced in 2013. The right to an old-age pension
depends on two parameters which must be met cumulatively; the age of the insured person and
the pension qualifying period. The retirement age was gradually raised to 65 for both genders,
with the transition period expired in 20192. The conditions for acquiring an old-age pension are
therefore equalized for men and women3 (the table below). In exceptional circumstances the
retirement age could be lower due to child care, compulsory military service or inclusion in the
insurance scheme before the age of 184. Actual retirement age5 has started raising notably after
the last reform. In the case of old age pensions (with partial pensions) in the year 2019 reached
slightly about 60 years for women and 61 years and 7 months for men. However, the average
retirement age of new pensioners without early retirement In the year 2019 reached 60 years
and 8 months for women and 62 years and 6 months for men

The latest changes of the pension system in 2019 are described in detail in next chapter.

1 The disability insurance include occupational rehabilitation, reassignment work on a part-time basis for
no less than four hours daily or twenty hours weekly, reimbursement of travel expenses and benefits from
disability insurance: for the duration of occupational rehabilitation, temporary benefit, right to disability
benefit and right to partial benefit.
2
  Different transitional periods take into consideration various pensions qualifying periods.
3
  This is reasonable due to the longer lifespan of women and consequently longer pension receipt span,
as well as the necessity to equalise the genders formally. The different conditions for retirement in the
past contributed to lower pensions for women due to the shorter pension qualifying period.
4
  See Country Fiche on Pension Projections, Slovenia, 2013.
5
  The retirement age for entering the old age pension without other pensions and rights under special acts.

                                                     3
Table 1: Transitional periods for different pension qualifying periods
Transitional The transitional period to The transitional period to 65 The transitional period to 60 retirement
periods reach 65 retirement age and retirement age with at least 20 age to 40 years of contribution6
15 year contribution period years of contribution*
Men Women Men Women Men Women Contribution
period, women
2013 65Y 63 Y 6M 63Y 6 61Y 6M 58Y 4M 58Y 38Y 4M
2014 64Y 64Y 62Y 58Y 8M 58Y 4M 38Y 8M
2015 64 Y 6M 64Y 6 62Y 6M 59Y 59Y 8M 39Y
2016 65Y 63Y 59Y 4M 59Y 39Y 4M
2017 63Y 6M 59Y 8M 59Y 4M 39Y 8M
2018 64Y 59Y 8M
2019 64Y 6M
Source: Pension and Disability Insurance Act (ZPIZ-2)
* When reaching the retirement age 65 for both genders in 2020, this provision will be abolished.
Table 2: Qualifying condition for retiring
2019 2030 2040 2050 2060 2070
Statutory retirement age - men 65 y 65 y 65 y 65 y 65 y 65 y
Statutory retirement age - women 64,5 y 65 y 65 y 65 y 65 y 65 y
Contributory period -
40 y 40 y 40 y 40 y 40 y 40 y
Qualifying condition men
for retiring with a full Retirement age -
60 y 60 y 60 y 60 y 60 y 60 y
pension Minimum men
requirements Contributory period -
40 y 40 y 40 y 40 y 40 y 40 y
women
Retirement age -
60 y 60 y 60 y 60 y 60 y 60 y
women
Early retirement age – men* 60 y 60 y 60 y 60 y 60 y 60 y
Early retirement age – women* 60 y 60 y 60 y 60 y 60 y 60 y
18 %
Penalty in case of earliest retirement (early 18% 18% 18% 18% 18%
age pension)
Qualifying condition 12 % 9% 9% 9% 9% 9%
for retirement without (old age
a full pension Bonus in case of late retirement pension)
Minimum contributory period - men 15 y 15 y 15 y 15 y 15 y 15 y
Minimum contributory period - women 15 y 15 y 15 y 15 y 15 y 15 y
Minimum residence period - men n.e. n.e. n.e. n.e. n.e. n.e.
Minimum residence period - women n.e. n.e. n.e. n.e. n.e. n.e.
Source: ZPIZ
Note: *Statutory and early retirement age are the same. The difference is in the definition of the
contributory period. For early retirement the total pension qualifying period includes also purchased
contributory period.
The time spent in pension is increasing. In 2000, the average time spent in retirement for women
was 17 years and 1 month, while in the year 2016 it was 24 years and 1 month and in the year
2019 it was 24 years and 11 month. Similarly, in 2000 average time spent in retirement for men
was 14 years and 9 months, while in both 2016 and in 2019 it was 17 years and 7 months.
6
Particularly for persons who began to work early in life – the effect of the structural changes in the
economy in the long run.
4The impact of the reform is evident also in gradually increasing contributory periods but only for
women. In 2019, the average contributory period of new pensioners increased in comparison
with 2016 – the increase for women was 1 year and 10 months while the decrease for men was
8 months.
In the year 2019 85% of women and 68.4% of men completed 40 years of pensionable age.
The ratio of insured persons to pensioners decreased from 1.8 in year 2000 to 1.45 in year 2016.
In 2019 the ratio increased again and reached 1.55 due to labour market recovery - the number
of insured persons increased from 2016 to 2019 at an average annual rate of 2.5% - new
pensioners were increasing at average annual rate of just 0.3%.
When calculating the pension base for an old-age pension or an early pension the period of 24
most favourable consecutive years of insurance from 1 January 1970 onwards are taken into
accounts. The current period of 24 years was reached in the transition period that started in
2013 with the 19 years, increasing one year annually.
The lowest pension base is set by 76.5% of the gross wages reduced by average rate of paid
taxes and contributions. The maximum pension base is limited to 4 times of the minimum
pension base. On October 1, 2017 an amended Pension and Disability Insurance Act (ZPIZ-C),
which provides a guaranteed pension amount to all those who contributed to the pension system
(1st pillar) for the time required to obtain a full pension, came into force. This amount is indexed
and in December 2019 could not be less than 538.53 EUR (555,76 EUR in 2020). According to
the data there were 55,269 pensioners who received it.
Until December 31, 2019 the accrual rate was set to 1.25% for each year after contributory
period of 15 years (for the first 15 years the accrual rate was 26% for men and 29% for women)
and reached for 40 contributory years 57.25% of the pension base for men and 60.25% of the
pension base for women. A special transition period for women was set until 20227.
From January 1, 2020, when the amendment to the pension legislation came into force, the
accrual rate is set to 1.36 % for each year after contributory period of 15 years (for the first 15
years the accrual rate is 29,5 % for men and women) and reaches 63.5% of the pension base
for men and women for 40 contributory years. A transition period of six years was set to raise
the assessment rate for men to 63.5%.
An insured person may acquire the right to early retirement already at age 60, if he or she attains
at least 40 years of the pension qualifying period (with purchased period included). However, it
must be emphasized that due to the renewed system of permanent deductions, early retirement
affects the amount of pension received. A pension with regard to the pension qualifying period
achieved is lowered by 0.3% (maximum 18%) for each month of retirement before the age of
65. Since the statutory age was raised gradually to 65 and the pension qualifying period for early
retirement was also raised gradually (from 38 to 40 years for women), deductions were
determined correspondingly.
The positive stimulation for staying active longer time is provided with bonuses. Until December
31, 2019, the pensioner could accrue additional 1% for each three months of work after fulfilment
of 60 years of age and completion of 40 years of pensionable service without purchasing years
(including transitional periods), i.e. additional 4% per year against the normal yearly accrual rate
of 1.25% (from 1 January 2020 1.5% for every 6 months of work after fulfilling the retirement
7
See Country Fiche on Pension Projections, Slovenia, 2013.
5conditions, i.e. additional 3% per year). This bonus is available for maximum of 3 years, which
means that a person prolonging his career for 3 years can accrue additional 12% (reduced to
9% by the novel from January 1, 2020). In addition, an insured person who meets the conditions
for an early or old-age pension and remains insured will receive monthly payments of 20% (40%
from January 2020) of the early or old-age pension, but only if insured persons remains insured
40 hours per week (this condition was added in 2016).
Pensions are indexed to 60% of the increase in the average gross salary and to 40% of the
average increase in the cost of living (i.e. inflation). The pension indexation should not fall below
half of the increase of the cost of living. In the year 2019 the pensions were indexed twice,
regularly by 2.7% and 1.5% due to yearly increase of GDP by 4.1% .
The total contribution rate for pension and disability insurance is 24.35% of gross wage without
ceiling. The employee´s contribution rate is 15.50% and the employer´s contribution rate is
8.85%.
In overall, the positive economic developments in last years and the impact of last pension
reform have reduced the share of pension expenditures in GDP from above 11% in 2013, to
9.96%8 in 2019.
Survivor and widow(er)’s
The pension and disability insurance shall also cover the rights arising in the event of death of
the insured person. Those pensions are received by the widow or widower, his children,
stepchildren and other children without parents of the insured person who died.
The rules for survivor pensions: if the partner dies the base for survivor pension is his/her
pension or if he/she was employed (and has fulfilled the conditions for disability pension), the
pension is calculated with the same assumptions as it would become disabled (1st category). If
survivor partner is already retired and already receives his/her own pension (or exceeds the age
of 57 years (2020), or is completely incapable for work or has to take care of children), this
pension is compared with the 70% pension of the deceased partner and if it is lower he/she can
get 70% of the pension of the deceased partner. If it is higher, he/she can get a partial survivor
pension – 15% of survivor pension – in addition to his/her pension (with two limitations: a) this
partial pension should not exceed 11.7% of the minimum pension assessment base (from 1st
January 2020 this limitation is set to 104.70 EUR), and b) the sum of both pensions (his/her own
+ the partial survivor pension) should not exceed old age pension of a man, calculated from the
highest pension assessment base and 40 years of pensionable period (2,094.02 EUR from 1st
January 2020).
If there are children left, for one child family pension is 70% of pension of deceased
father/mother, for two children it is 80%, for three children it is 90%, and for 4 and more children
it is 100%. The widow(er) counts the same as one child (mother + one child = 80%).
8
The percentage correspond to the definition used in the model.
6Occupational insurance
More precisely this system should be called “mandatory” supplementary pension system as its
purpose was and still is to replace the old ‘insurance period with increase (bonus)’ and is
intended for people working in demanding jobs and professions where due to the specifics of
their work they cannot be expected to work until their full retirement age. This system provides
certain categories of workers with a right to early retirement and so-called bridging over pension.
Occupational insurance covers the compulsory admission to the occupational retirement
provision, and the rights and obligations arising from the insurance in the event of old-age and
death determined on the basis of the contributions paid there into.
The basis for the payment of contributions for the occupational retirement provision is the
insured person’s salary or salary compensation. Occupational insurance pension plan
determines uniform occupational insurance contribution in amount of 9.25% of an insured
person’s salary. In addition, for the transitional period from January 1, 2017 to December 31,
2021, the uniform occupational insurance contribution rate for all jobs is set at 8% of the
occupational insurance base, except for insured persons without insurance period with an
increase, until December 31, 2000, for which the contribution rate is:
• in the workplace from groups 1 and 2: 8.2% of the occupational insurance base;
• in the group 3 workplace: 8.4% of the occupational insurance base;
• in the workplace from groups 4 and 5: 8.8% of the occupational insurance base from
1.1.2019 onwards (between 1.1.2017 and 1.1.2019 it is 8.00%).
The occupational insurance guarantees the right to an occupational pension. Occupational
pension is a benefit which ensures an individual a certain income from the moment he/she
leaves the labour market until he/she meets the conditions for retirement under the compulsory
pension and disability insurance. The amount of occupational pension depends on the amount
of funds deposited on a person’s personal account, and of the expected length of the period of
receiving the occupational pension. The occupational pension may not fall below the old-age
pension which the insured person would have received under a compulsory pension and
disability insurance.
A beneficiary receives occupational pension in monthly amounts from the time of the acquisition
of the occupational pension until the fulfilment of conditions for the acquisition of an early
retirement benefit or an old-age pension under the compulsory insurance, depending on the
beneficiary’s choice.
Conditions for acquiring the right to an occupational pension are:
• the years of pensionable service together with the added pensionable service amount to 42
years and 6 months in accordance with the provisions, and if the funds collected on their
personal account suffice for the pay-out of the occupational pension or
• when their years of pensionable service together with the added pensionable service amount
to no less than 40 years and when, depending on the level of the job they attain certain age
(52 to 56).
An insured person who fulfilled the conditions for the entitlement to an old-age pension, an early
retirement benefit, widow(er)’s pension or disability pension prior to enforcing the right to an
occupational pension have the right to the pay-out of the surrender value or may request that
7the funds are transferred free-of-charge to the supplementary insurance where the insured
person shall acquire the right to a supplementary pension.
In May 2020 there were 48,297 insured persons in occupational insurance and there were 302
occupational pensions’ beneficiaries. The amount of collected resources in the occupational
insurance fund in May 2020 was 794 million EUR.
However, before the new legislation the employees on the jobs with difficult conditions (arduous
& hazardous) and security and defence forces had the same formal status as other old age
pensioners within the pillar 1. The only difference was that they could retire earlier and with
shorter contributory period.
Special pension schemes
Special pensions are defined as in Box II.1.2 of European Commission (DG ECFIN), Economic
Policy Committee (Ageing Working Group) (2019) ‘The 2018 Ageing Report: Economic and
Budgetary Projections for the EU Member States (2016-2070)’. The occupational insurance
scheme described above is part of the special pension schemes reported in previous round of
projections. The old special schemes for farmers and military are projected separately and are
phasing out. Other special schemes or favorable conditions for pensions defined by different
laws and for different groups (police, judiciary ect.) are also phasing out. All these categories
are included in the projections.
Supplementary insurance
Voluntary supplementary pension insurance represents collecting of funds on personal accounts
of persons insured under this form of insurance with the purpose of providing them, upon
attaining certain age or in other cases, defined by the pension scheme, with supplementary
pensions or other rights stipulated by Pension and Invalidity Insurance Act.
Supplementary insurance represents the depositing of funds on the personal account of a
member of such form of insurance with the aim of ensuring additional income for the person
when he/she acquires the rights under the compulsory pension and disability insurance (early
retirement benefit or old-age pension, disability pension, widow/widower’s pension or
occupational pension). Only an insured person or beneficiary of the rights arising from the
compulsory pension insurance may join the supplementary insurance.
This form of insurance may be established as collective insurance with an employer, who
partially or completely funds the insurance for all his employees, or by entering an individual
insurance retirement plan under which every member pays his/her own premium and may join
it independently.
Pension scheme (plan) must be approved by the minister, responsible for labour. Only then the
payer of the supplementary insurance premium is entitled to tax relief for the premiums paid.
The two rights ensured by this form of insurance are as follows:
• the right to supplementary old-age pension and
• the right to early supplementary old-age pension.
8Insured person may also (under certain conditions) demand the withdrawal of all the funds on
his/her personal account in one payment (if the funds do not exceed EUR 5,000) .
A pension fund may be established and managed by a pension company, an insurance
company and banks.
The pension fund’s management company shall manage the collected funds:
• in compliance with the life-cycle investment policy of a Member or
• in compliance with the investment policy ensuring guaranteed return on net contributions.
To ensure adequate level of pensions, the participation in supplementary pensions should be
increased in the future. In December 2019 there were 560,722 persons participating in the
insurance. In 2019 the share of persons in supplementary pensions was 58.2% of the total
number of persons in the compulsory system. In the end of 2019 the amount of resources in the
supplementary funds was around 2.6 billion EUR (2.1 billion EUR in 2016). The average
premium paid into supplementary pension insurance was 77.50 EUR by pension company,
58.51 EUR by insurance companies and 58.46 by umbrella pension funds.
If the voluntary supplementary pension insurance remains unchanged in the next decades, only
a small share (4.3% of all employed person) will be receiving the pension rent higher than 10%
of their old age pensions form the 1st pillar. Beside the relatively low share of insured persons,
the main problem are the low shares of insured persons in younger cohorts and thus the short
period of premium payments. An introduction of the mandatory 2nd pillar for all employed
persons would have an important positive impact on the increase in the net replacement rates,
but the assumed premiums amounting to 4% of gross salaries would, in some scenarios,
increase the labour costs. Consequently, it is very unlikely that such a scenario would obtain a
green light.
Social assistance
National means tested pension rights used to be national (state) pensions in the past. In 2012
this type of pension was redefined and moved from the pension system to the social assistance
legislation. As such they do not represent pension related expenditures and are excluded from
the projections.
1.2. Recent reforms of the pension system included in the projections
At the end of year 2019, amendments to the Pension and Disability Insurance Act were adopted.
The Act entered into force on January 1, 2020. Legislative changes pursue two basic goals:
• the extension of employment and
• the provision of an adequate income for a safe age or the improvement of the social position
of all beneficiaries of compulsory pension and disability insurance.
Key amendments to the legislation:
9• Dual status - upgrade of possibilities to combine pension with income from work:
Insured persons who have fulfilled the conditions for an old-age pension (60 years of age and
40 years of pensionable service without purchased periods) are entitled to receive 40% of the
old-age pension to which they would be entitled on the day of fulfilment of the conditions for the
first three years of further inclusion in compulsory full-time insurance. At the end of this period,
if they remain in compulsory full-time insurance, they are entitled to a 20% old-age pension.
• Favourable valuation of years after meeting the conditions for retirement:
A favourable valuation of 3% per year has been set for a maximum of 3 additional years of
insurance for those individuals who have already met the conditions for old-age retirement (60
years of age and 40 years of pensionable service without purchased periods).
• Increasing the total accrual rate for 40 years of pension period to 63.5% for both genders:
The old-age pension is assessed from the pension base in a percentage depending on the
length of the pension period. For 15 years of insurance period, it is assessed in the amount of
29.5% of the base. For each subsequent year, however, 1.36% is added, with no upper limit.
For a 40-year completed pension period, the pension is set at 63.5% for both genders.
- for men: gradual increase of the percentage rate from 57.25% in 2019 (previous pension
law) to 63.5% in 2025. After 2025 it remains at 63.5%.
- for women: in the previous law the total accrual rate for women with 40 years of
contributory period would decrease from 63.5% in 2019 to 60.25% in 2023 and then it
would stabilize on that level. With the new pension law it remains at 63.5% in 2020 and
onwards. With new pension low minor changes are also for contributory periods between
15 and 39 years - for example, for 15 years it was 29% in 2019 whereas in 2020 and
onwards it is 29.5%).
• Determination of additional accrual rate for child care:
An insured person (male or female) who cared for a child (born or adopted) in the first year of
his or her life may receive an additional accrual rate of 1.36% per child (for up to three children
– i.e. in total up to 4.08%) when claiming a pension.
• Higher accrual rate in the case of assessment of disability pension in case of disability due
to injury at work or occupational disease:
The assessment has so far been considered to be set in the amount of the assessment
percentage that applies to a man with 40 years of pensionable service, which means that it has
risen from the current 57.25% to 63.5%.
• New minimum assessment of disability pension for insured persons who became disabled
before reaching the age of 65:
The disability pension for these insured persons is at least 41% of the pension base, for both
genders. (Before: 36% for men and 39% for women.)
• Widow’s and survivor’s pension:
10The lowest basis for the assessment of a widow’s or survivor’s pension is a pension assessed
at least in the amount of 38% of the pension base (before: 33%).
1.3. Description of the actual “constant policy” assumptions used in the projection
In the last round of projections (AR2018), there were just few individuals taking up the possibility
to continue working after they fulfil the retirement conditions, although the stimulus was strong.
Namely, already from 2013 an individual who continued to work was receiving 20% of the
pension (that she or he would receive in the case of retirement) and the accrual rate was
increased by 4 percentage points for each year of additional work (up to three years) beyond
the full working career. Thus, for working three years longer an individual received 12
percentage points higher total accrual rate, which means about 20% higher pension.
Nevertheless, after having this option available for three years, in 2015 only 2,000 individuals
were involved in this option. Also in 2016, for which the data was available when preparing
AR2018, the number was only 4,000 and the jump could be only one-year event. Therefore, in
AR2018 this effect was not separately modelled. It was assumed there will not be much
individuals using this option. Namely, already before 2013 there was a high stimulus in form of
high accrual rates for prolonging work after fulfilling retirement conditions but it was very rarely
used.
However, in the meantime there is a steady trend of increasing number of individuals who
continue working. These individuals who receive a fraction of a pensions are not accounted as
old-age, disability or survivor pension(er)s. The number of such individuals increased to 10,000
in 2019. Also, as explained, in 2020 the percentage of pension individuals receive while working
has been raised from 20% to 40% (for up to 3 years and then 20%), which is expected to further
motivate individuals to continue working. In this round of projections (AR2021) it is now assumed
that the number of people that continue working will increase by 1,000 each year, reaching
12,600 in 2025. After 2025 no further increase in share of people taking up this option is
assumed. After 2025 the number fluctuates with the number of people at retirement age. It is
further assumed that in average individuals stay in employment for additional 1.8 years, which
results in 21.4 thousand individuals in 2025 and then it fluctuates in line with the number of
people who enter this option, as described earlier. However, the individuals who voluntarily
prolong the employment are in the model treated as employees and not as pensioners (although
they are rewarded with 40% of the pension, which they would receive in the case they would
retire). This is in line with the Pension fund who does not include those pensions in the reported
total number of pensions when they sum up the pension categories into the total number of
pensions. Still, the number of those pensions is followed and reported by the Pension fund.
Thus, in the model those individuals are reported as employees and not (at the same time) also
as pensioners. This has to be kept in mind when interpreting the coverage ratios. In 2019 these
expenditures were representing 0.04% of GDP in 2019 but they are projected to increase to
0.20% of GDP in 2070 – due to the higher number of individuals using this option and receiving
40% instead of 20% of the pension that they would receive in the case they would retire.
Nevertheless, those amounts are distributed to the individuals who retire, therefore also these
pension expenditures are included in the pension expenditure projections.
The results show that this improves the sustainability of pension expenditures in the beginning
of the projection period, but eventually the impact becomes negative when increasing share of
individuals receive substantially higher pensions. However, the results included here (pension
expenditures as % of GDP) do not show the entire picture. There is positive effect on the amount
11of collected contributions (including pension and health contributions) that are paid on wages of
people who continue to work. Furthermore, higher personal income tax is collected which
improves the public. If we consider the total impact of this measure (working longer), then the
net impact on sustainability is clearly positive. We have informed about that measure the
European commission, who modified the employment rates accordingly.
122. Overview of the Demographic and labour forces projections
2.1. Demographic development
Just like other European countries Slovenia is facing demographic changes that require
entire society to adapt. Life expectancy is rising, the number of births is decreasing and net
migration is conditioned by economic cycle. In next decades, the number of working age
population will strongly decrease and the number of elderly will strongly increase.
Demographic change will reduce the supply of labour and is already affecting labour market
trends. In the coming years, the pace of these changes will only intensify. According to
EUROPOP2019 population projections, the population of Slovenia is going to rise slowly until
2024 and then fall by 8% by 2070. By 2070 the age structure is expected to change substantially.
While the number of children (0–14 years) and people in working age (20–64) will decrease by
20% each, the share of the elderly will increase by 40% (2070 compared to 2019). The increase
in the number of the elderly will be driven by 1) larger generations born between the end of WWII
and 1980 and 2) the increasing life expectancy.
Table 3: Main demographic variables
change
peak peak
2019 2030 2040 2050 2060 2070 2019-
value year
2070
Population (thousand) 2.088 2.105 2.080 2.041 1.987 1.936 2115,1 2024 -152,1
Population growth rate 0,7 -0,1 -0,1 -0,2 -0,3 -0,2 0,7 2019 -0,9
Old-age dependency ratio 33,2 43,5 51,0 59,9 61,7 58,8 62,3 2056 25,5
(pop 65+ / pop 20-64)
Old-age dependency ratio 12,9 17,4 22,4 26,2 30,5 30,6 31,2 2065 17,7
(pop 75+ / pop 20-74)
Ageing of the aged (pop 80+ / 26,9 27,4 33,9 36,5 41,2 45,4 45,4 2070 18,6
pop 65+)
Men - Life expectancy at birth 78,7 80,3 81,8 83,3 84,6 85,9 85,9 2070 7,2
Women - Life expectancy at 84,5 85,8 87,1 88,2 89,4 90,4 90,4 2070 5,9
birth
Men - Life expectancy at 65 18,1 19,2 20,3 21,3 22,3 23,2 23,2 2069 5,1
Women - Life expectancy at 22,0 23,0 24,0 25,0 25,9 26,8 26,8 2070 4,8
65
Men - Survivor rate at 65+ 86,1 88,4 90,1 91,6 92,8 93,9 93,9 2070 7,8
Women - Survivor rate at 65+ 93,3 94,3 95,1 95,8 96,3 96,8 96,8 2070 3,6
Men - Survivor rate at 80+ 56,8 62,7 67,5 71,8 75,6 79,0 79,0 2070 22,1
Women - Survivor rate at 80+ 75,6 79,3 82,3 84,8 87,1 89,0 89,0 2070 13,4
Net migration (thousand) 15,7 4,5 4,6 4,9 5,2 5,2 15,7 2019 -10,5
Net migration over population 1,1 -2,2 -1,6 -1,0 -0,9 -1,2 20,0 2024 -2,3
change
Source: Eurostat and Commission services
The age-dependency ratio has been rising rapidly in recent years due to the declining number
of working-age population and the increasing number of elderly. This situation intensified around
2012 not only because large post-war generations were going from working age to age 65+ but
also because smaller cohorts born in early 1990s started joining the working-age population. In
2019 24.9 children and 32.7 elderly (together 57.6) depended on 100 people in working age.
Slovenia is currently not exceeding the EU average, but the values of ageing indicators will start
to increase in the future and they will peak during 2050s. Projections show that the number of
the elderly will continue to increase until 2054, when the generations born in the 1980s (with
13still almost 27,000 children born annually, compared to the 1990s when this number was 19,500)
will be transitioning into old age. In 2019 there were already 1.3 times more older people than
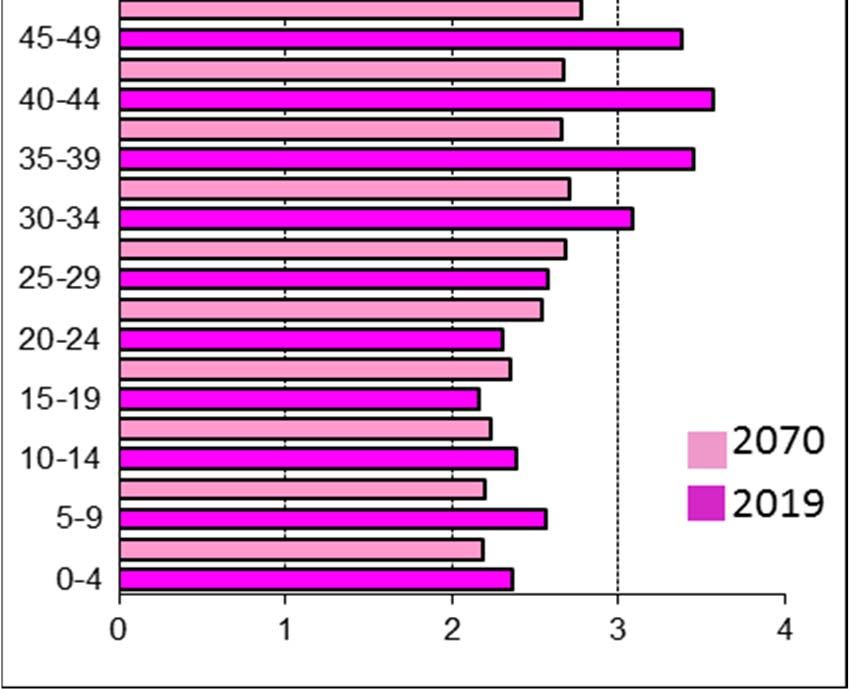
children in Slovenia (in 2070 there will be 2.3 times more older people).
Figure 1: Age pyramid of Slovenian population 2019 vs 2070
Source: Eurostat and Commission services
2.2. Labour force
Table 4 summarises the developments of participation and employment rates of elderly workers
in the period 2019-2070. The participation and employment rates for elderly have substantially
improved in the base year (2019) compared to the base year in the previous round (2016), but
they are still low, particularly at the beginning of the observed period. In 2019 the participation
and employment rates for the age group 55–64 are 50.3% and 48.0% respectively. The higher
rates in the base year is a result of strong economic growth in last years and elderly staying
longer in the labour market. By 2034 the projected participation and employment rates will
increase to 64.6% and 60.8%, respectively. Thereafter, they are almost stable until the end of
the projection period when they reach 64.6% and 60.7%, respectively. Compared to the AR2018
projections both rates are higher in the end of the projected period.
14Table 4: Participation rate, employment rate and share of workers
peak peak change
2019 2030 2040 2050 2060 2070
value year 2019-2070
Labour force participation rate 20-64 79.9 82.5 82.2 83.1 83.5 83.0 83.6 2057 3.1
Employment rate of workers aged 20-64 76.4 77.9 77.5 78.4 78.8 78.3 78.9 2057 1.9
Share of workers aged 20-64 in the labour 95.6 94.4 94.3 94.3 94.4 94.3 95.6 2019 -1.3
force 20-64
Labour force participation rate 20-74 68.4 68.9 68.4 67.5 69.2 69.9 70.0 2067 1.5
Employment rate of workers aged 20-74 65.5 65.1 64.6 63.8 65.4 66.1 66.2 2067 0.6
Share of workers aged 20-74 in the labour 95.7 94.5 94.5 94.5 94.5 94.5 95.7 2019 -1.2
force 20-74
Labour force participation rate 55-64 50.3 63.6 63.7 62.9 64.1 64.6 65.1 2066 14.3
Employment rate of workers aged 55-64 48.0 59.8 59.9 59.2 60.3 60.7 61.3 2066 12.8
Share of workers aged 55-64 in the labour 95.4 94.0 94.1 94.0 94.0 94.1 95.4 2019 -1.3
force 55-64
Labour force participation rate 65-74 4.6 8.0 9.5 9.3 9.1 9.4 9.7 2044 4.8
Employment rate of workers aged 65-74 4.6 8.0 9.5 9.3 9.1 9.4 9.7 2044 4.8
Share of workers aged 65-74 in the labour 100.0 100.0 100.0 100.0 100.0 100.0 100.0 2067 0.0
force 65-74
Median age of the labour force 41.0 43.0 42.0 41.0 42.0 42.0 43.0 2027 1.0
Source: Eurostat and Commission services
Tables 5a and 5b show the dynamic of the careers lengths and duration of retirement for men
and women. The average effective age of retirement increases in the projected period by 0.9
years for men and 0.8 years women.
Table 5a: Labour market effective exit age and expected duration of life spent at
retirement – MEN
peak peak change
2020 2030 2040 2050 2060 2070
value year 2020-2070
Average effective retirement age 61.6
(administrative data)*
Average labour market exit age (CSM)** 62.1 63.0 63.0 63.0 63.0 63.0 63.0 2028 0.9
Contributory period 39.2 39.1 39.5 39.4 39.5 39.5 39.5 2062 0.3
Duration of retirement*** 20.3 20.8 21.9 23.0 24.1 25.0 25.0 2070 4.7
Duration of retirement/contributory period 0.5 0.5 0.6 0.6 0.6 0.6 0.6 2070 0.1
Percentage of adult life spent in 31.5 31.6 32.7 33.8 34.9 35.7 35.7 2070 4.2
retirement****
Early/late exit***** 5.5 2.0 1.8 1.5 1.5 1.5 5.5 2020 -4.0
Source: Commission services
15Table 5b: Labour market effective exit age and expected duration of life spent at
retirement – WOMEN
peak peak change
2020 2030 2040 2050 2060 2070
value year 2020-2070
Average effective retirement age 60.0
(administrative data)*
Average labour market exit age (CSM)** 62.0 62.8 62.8 62.8 62.8 62.8 62.8 2030 0.8
Contributory period 38.9 39.0 39.2 38.9 39.0 39.1 39.5 2034 0.2
Duration of retirement*** 24.6 24.8 25.8 26.8 27.7 28.6 28.6 2070 4.0
Duration of retirement/contributory period 0.6 0.6 0.7 0.7 0.7 0.7 0.7 2070 0.1
Percentage of adult life spent in 35.9 35.6 36.5 37.4 38.2 39.0 39.0 2070 3.1
retirement****
Early/late exit***** 6.3 1.8 1.5 1.3 1.4 1.2 6.9 2021 -5.0
Source: Commission services
* The effective retirement age shows the age at which people on average start receiving an old-age
pension benefit. It is calculated on the basis of the administrative data for 2019 (see Annex Tables A4a
and A4b); ** The labour market exit age as calculated based on Labour Force Survey data for the base
year and estimated by the Cohort Simulation Model thereafter; *** ‘Duration of retirement’ is calculated as
the difference between the life expectancy at the average labour market exit age and that exit age itself;
**** The ‘percentage of adult life spent in retirement’ is calculated as the ratio between the duration of
retirement and the life expectancy minus 18 years; ***** Early/late exit is the ratio between those who
retire and are below the statutory retirement age and those who retire at the statutory retirement age or
above.
In Slovenia the average effective exit age is low whereas the longevity is relatively high,
therefore duration of retirement is high. This is a key driver of high pension expenditures relative
to GDP under no-policy change scenario. The pressure could be potentially mitigated with
indexation, but this is not the case for the moment, since the indexation is relatively high –
pensions are in 60% linked to the growth of wages and in 40% to inflation.
163. Pension projection results
3.1 Extent of the coverage of the pension schemes in the projections
In the model are included old age pension, disability pension, survival pensions, widower
pensions and “others pensions” that include former schemes for farmers’ and military pensions.
The expenditures include also annual allowances for pensioners as social security type of
expenditure. The projections do not cover the two private pillars in place in Slovenia, due to the
lack of data. Total accumulated assets under these schemes are currently relatively small,
individuals can choose among several insurance providers (with no central data available) or
data on actual contributors may be inacurate (for instance, if people change jobs and the new
employer no longer supports the private scheme, these individuals are still counted, despite their
no longer being active contributors). For these reasons, mandatory collective supplementary
pensions for public employees, non-mandatory collective supplementary pensions (private
sector) - based on collective agreements and private non-mandatory individual supplementary
pensions (private and public sector) are not included in the projections.
Conversely, special pensions are fully covered by the projections. In particular, occupational
insurance schemes for difficult conditions (arduous and hazardous jobs), security and defence
forces (military and police personnel), state employees of all branches and farmers, are all
covered by the projections. In particular, the model includes special compulsory (occupational)
pensions for workers in high risk occupations (arduous and hazardous jobs) once they fulfil the
condition for retirement in the first pillar, private and public sectors. Like mentioned above, the
two groups of special pensions gradually phasing out (farmers and civil servants are also
included). Combined, military and farmers schemes represent only 0.3% of the total number of
pensions and 0.05% of pension expenditure to GDP in the base year 2019. In particular, in 2019,
the number of pensions was 2039 for military and 124 for farmers’ pensions. Other special
schemes that cover retirement conditions were defined in different laws for different groups
(military, police, judiciary,…). They are gradually all phasing out and they are covered in the old
age pensions (number and expenditures).
Both Eurostat and AWG public pension expenditure include the same expenditure; the minor
difference between the two data sets is explained by the different accounting principles used
(cash flow principle in case of AWG data and ESA principle in case of Eurostat data).
Table 6: Eurostat (ESSPROS) vs. Ageing Working Group definition of pension
expenditure (% GDP)
change
2009 2010 2011 2012 2013 2014 2015 2016 2017 2018 2009-
2018
Eurostat total pension expenditure 10.6 11.0 11.2 11.3 11.5 11.2 10.9 10.6 10.1 : :
Eurostat public pension : : : : : : : : : : :
expenditure (A)
Public pension expenditure : :
(AWG: outcome) (B)
10.6 11.0 11.2 11.4 11.7 11.4 11.1 10.8 10.3
Difference Eurostat/AWG: (A)-(B) 0.0 0.0 0.0 -0.1 -0.2 -0.2 -0.2 -0.2 -0.2 : :
Expenditure categories not : : : : : : : : : : :
considered in the AWG definition
- [please specify] : : : : : : : : : : :
- [please specify] : : : : : : : : : : :
-… : : : : : : : : : : :
Source: Commission services and Member states
173.2. Overview of projection results
The total gross public pension expenditure rises from 10% of GDP in 2019 to 16.1% in 2057
and slightly decreases to 16.0% in 2070. Until 2030 the expenditures increase only slightly,
because of increasing employment rates, especially at higher age groups, including the longer
stay in employment that is by assumption fostered by the increasing benefit from 20% to 40%
of pension. Also, the demographic situation worseness less in EUROPOP2019 than in the
previous round (ESSPOP2015). A strong increase from 2030 till 2053 is driven by demographic
development. Compared to the previous round there will be additional increase because of the
higher benefit ratio due to higher accrual rates coming from the pension amendments in 2020.
Also, the impact of staying longer in the labour market will eventually turn negative, because the
increasing share of pensioners will receive higher pensions. In particular, baby-boom
generations and generations up to 1980-s (when the fertility was still above the replacement
level), will represent pensioners, whereas young cohorts born during the low fertility in last
several decades will be on the labour market. In the last decade of the projection period the
demographic pressure will slightly decrease, but less than this was the case in previous round.
Compared to the 2018 projections the pension expenditure as % of GDP are higher because of
the net effect of the following drivers:
• legislative changes in pension system described earlier – especially because of higher
accrual rates that will increase by around 10% compared to the previous round of
projections after the transition period 2020-2025 is over.
• different demographic projections, that will have lower pressure on pension expenditures
in the first part of the projection period (compared to AR2018 projections), but it will turn
to higher pressure towards the end of the projection period.
• different starting point and positive impact of the strong economic growth in last years
(2016–2019) including high GDP, lower number of pensioners and pension expenditures
than projected in AR2018 – this will contribute to lower pension expenditures relative to
GDP compared to the AR2018.
• other (macroeconomic assumptions, modelling the impact of individuals staying longer
on the labour market, changes in the model etc.).
The difference between gross and net pension in Slovenia is insignificant because small
percentage of pensions are eligible for personal income tax.
Table 7: Projected gross and net pension spending and contributions (% of GDP)
peak peak change
Expenditure 2019 2030 2040 2050 2060 2070
value year 2019-2070
Gross public pension expenditure 10.0 10.8 13.6 15.7 16.1 16.0 16.1 2057 6.0
Private occupational pensions : : : : : : : : :
Private individual mandatory : : : : : : : : :
pensions
Private individual non-mandatory : : : : : : : : :
pensions
Gross total pension expenditure 10.0 10.8 13.6 15.7 16.1 16.0 16.1 2057 6.0
Net public pension expenditure* 9.9 10.7 13.4 15.5 15.9 15.8 16.0 2057 5.9
Net total pension expenditure* 9.9 10.7 13.4 15.5 15.9 15.8 16.0 2057 5.9
peak peak change
Contributions 2019 2030 2040 2050 2060 2070
value year 2019-2070
Public pension contributions 9.3 9.3 9.3 9.3 9.3 9.3 9.3 2019 0.0
Total pension contributions 9.3 9.3 9.3 9.3 9.3 9.3 9.3 2019 0.0
Source: Commission services
18The pension expenditures as % of GDP level-off in this round but not in AR2018. This is because
of different Eurostat population projections – the dependency ratio is now lower than in AR2018
in the first part of the projection period, whereas it is higher towards the end of the projection
period.
Total public pension spending on old age and early pensions rises from 7.8% of GDP in 2019
to 12.9 % in a peak year 2057 and in 2070 reaches 12.9% of GDP (what is 1 p.p. higher than
in previous projection). These pensions represent by far the largest share in total pension
expenditures and they are driven by the factors explained above.
Disability pension expenditures in % of GDP is first increasing because the number of persons
with disability pensions increases due to demographic development – i.e. increasing number of
individuals in higher age groups. Eventually, around 2050, the number of disability pensioners
start to decrease again because of the declining number of elderly. In Slovenia the disability
pensions are not eventually translated into old-age pensions. Instead, disability pensioners keep
their status until they die, therefore their number depends also on the number of elderly, instead
of only following the pattern of working age population. In the model it is assumed that
probabilities of being disability pensioner slightly decreases over time. The rationale behind this
assumption are a better health and safety at work, structure of the job types and stricter use of
the eligibility criteria for disability pensions which leads to less people using this “exit” path to
(disability) retirement. From 2003 the criteria for disability retirement is the individual’s
occupation instead of his or her concrete job. Therefore, attempts are made to find an adequate
job within the individual’s occupation instead of granting the person the disability pension
because he or she can’t work on the previous job any more. From 2006 the criteria for disability
pensions are strived to be synchronized across all disability commissions in Slovenia.
Furthermore, often a part-time employment is used instead of granting disability pension
immediately. All those measures, together with increasing safety at work and improving
medicine, have contributed to the continuously falling number of disability pensions in Slovenia
in the past, despite the population ageing. Therefore, we assume that also in the future
probabilities of being disability pensioner slightly decrease over time. Still, the demographic
impact prevails and drives the results, so in total the number of disability pensioners is increasing
until 2050’s and then it starts to decline.
For survivor and widowers pensions the similar approach has been used as for the disability
pensions. We slightly reduce the probability of survivors/widowers pensions by arguing that
individuals (particularly women because of higher employment rates and wages) will be entitled
to their own pension instead of the spouse. Again, the demographic factors determine the
number of pensioners – first increasing and eventually decreasing number of elderly.
The actual number of survivor and disability pensions in 2019 (the base year in AR2021) is lower
than in the AR2018 projections. Projections build on the actual number (and retirement rates) of
pensioners in 2019 and therefore they are shifted downwards.
Old schemes for the farmers’ and military pensions are included under other pensions. Both
types of pensions are phasing out – they include the old scheme for farmers that is phasing out
19and the farmers who treated in the current system as regular old age pensioners. Under the
military pensions are remaining war veterans.
Table 8: Projected gross public pension spending by scheme (% of GDP)
peak peak change
Pension scheme 2019 2030 2040 2050 2060 2070
value year 2019-2070
Total public pensions 10.0 10.8 13.6 15.7 16.1 16.0 16.1 2057 6.0
Old-age and early 7.8 8.6 10.8 12.6 12.8 12.8 12.9 2057 5.1
pensions
Flat component : : : : : : : : :
Earnings-related 7.8 8.6 10.8 12.6 12.8 12.8 12.9 2057 5.1
Minimum pensions : : : : : : : : :
(non-contributory) i.e.
minimum income guarantee
for people above 65
Disability pensions 1.07 1.11 1.37 1.58 1.63 1.56 1.6 2057 0.5
Survivors' pensions 1.08 1.12 1.36 1.54 1.61 1.56 1.61 2060 0.5
Other pensions 0.05 0.00 0.00 0.00 0.00 0.00 0.05 2020 -0.1
Peak Peak change
Special pension schemes 2019 2030 2040 2050 2060 2070
value year 2019-2070
Country-specific
scheme 1 [please specify]
Country-specific
scheme 2 [please specify]
…
Source: Commission services
3.3. Description of main driving forces behind the projection results and their
implications for main items from a pension questionnaire
The main upward driver of pension expenditure remains dependency ratio. The old-age
dependency ratio (P65+/P20-64*100) increases from 33.2 in 2019 to 58.8 in 2070, peaking in 2056
with 62.3.
Through most of the projection period (except in the last decade), the coverage ratio lowers the
pension expenditure as % of GDP. The employment rates are increasing during the projection
period, therefore they have positive effect on sustainability of the pension system. In the new
projections the activity rates are slightly higher than in the previous projections, therefore the
negative impact of this factor on pension expenditure in 2019-2070 is greater than in AR2018.
However, the 2016 to 2019 period, in which the impact was strongly negative, is already the
past, therefore cumulative negative effect for 2019-2070 period is now lower (-1.8 pps) than it
was for 2016-2070 period (-2.1 pps) in AR2018.
During the projection period, the benefit ratio contributes to the increase in pension expenditure
relative to GDP due to the policy measure. The changes in pension legislation introduced in
2020 are substantially increasing accrual rates. The transition period for men starts in 2020 and
the final level will be reached in 2025. For women, the changes are in a form of preventing drop
in accrual rates that were foreseen by 2023. For women, the final new set of accrual rates is
implemented already in 2020. At the beginning of the projection period the benefit ratio is still
decreasing because of the drop from 100% to 60% indexation of real growth of pensions to the
real growth of wages in the past. Therefore, elderly in higher ages who were facing 100%
indexation during their retirement period (and therefore having high pension) are gradually dying
20off. On the other hand, pensioners who retired after 2013 are (and will be) facing 60% indexation
and therefore they will have lower pensions.
The replacement rate is strongly increasing between 2019 and 2025 because of increasing
accrual rates due to the described changes in the pension legislation. Some additional increase
during the projection period comes from slightly increasing contributory period. Increasing
replacement rate gradually translates into higher benefit ratio as there are more and more
individuals with higher accrual rates among all pensioners.
Table 9: Factors behind the change in public pension expenditures between 2019 and
2070 (in percentage points of GDP) – pensioners
2019-30 2030-40 2040-50 2050-60 2060-70 2019-70
Public pensions to GDP 0.9 2.7 2.1 0.4 -0.1 6.0
Dependency ratio effect 3.0 1.9 2.4 0.5 -0.8 7.0
Coverage ratio effect* -1.2 -0.2 -0.5 -0.2 0.3 -1.8
Coverage ratio old-age -0.2 0.0 -0.1 0.0 0.1 -0.3
Coverage ratio early-age -2.9 0.3 0.4 -0.9 0.1 -3.0
Cohort effect -2.1 -1.5 -3.3 -0.7 1.6 -5.9
Benefit ratio effect -0.4 1.0 0.5 0.2 0.3 1.4
Labour market effect -0.3 0.0 -0.2 0.0 0.1 -0.4
Employment ratio effect -0.2 0.1 -0.2 -0.1 0.1 -0.3
Labour intensity effect 0.0 0.0 0.0 0.0 0.0 0.0
Career shift effect -0.1 -0.1 0.0 0.1 0.0 -0.1
Residual -0.2 0.1 0.0 0.0 0.0 -0.2
* Subcomponents of the coverage ratio effect do not add up necessarily.
Source: Commission services
The employment ratio effect is the main driver of labour market effect and it lowers the pension
expenditure relative to GDP. The positive impact comes through somewhat higher employment
rates of those in prime age but even more due to staying longer in the labour market, which
holds especially for women. Slight improvement is also because of entering the labour market
earlier. During the projection period 2020 to 2070 the effect (i.e. relative change) is about the
same in both AR2018 and AR2021. However, the strong negative impact of -0,5 pps for 2016-
2019 period is present only in AR2018, therefore the cumulative negative impact for the entire
projection period is lower in AR2018 than in AR2021.
Table 10: Replacement rate at retirement (RR), benefit ratio (BR) and coverage by
pension scheme (in %)
change
2019 2030 2040 2050 2060 2070 2019-2070
(pps)
Public scheme (BR) 31% 30% 32% 33% 34% 34% 3
Coverage 100.0 100.0 100.0 100.0 100.0 100.0 0.0
Public scheme: old-age earnings 33% 32% 35% 36% 36% 37% 4
related (BR)
Public scheme: old-age earnings 33% 37% 38% 38% 38% 38% 4%
related (RR)
Coverage 73.0 73.9 74.3 74.4 74.3 75.3 2.3
Private occupational scheme : : : : : : :
(BR)
Private occupational scheme ; ; ; ; ; ; ;
(RR)
Coverage : : : : : : :
Private individual schemes (BR) ; ; ; ; ; ; ;
21Private individual schemes (RR) ; ; ; ; ; ; ;
Coverage : : : : : : :
Total benefit ratio : : : : : : :
Total replacement rate : : : : : : :
Source: Commission services
Table 10 shows the evolution of replacement rate at retirement and benefit ratios. The
interpretation of the values depends on the average wage used for calculation. In Slovenia net
pension principle is in place as the pension rating base is calculated in net terms. When
comparing net and gross pension, there is no significant difference as only small percentage of
pensions are eligible for personal income tax. Contributions for health insurance are calculated
separately and paid out directly by the Institute for pension and disability insurance and therefore
not deducted from the pensions. This is also the main reason why the ratios of the pension (first
pension and average pensions) to the gross average wage of the economy and gross average
wage at retirement are relatively low. In this view the net replacement rate would be higher.
The public scheme benefit ratio is lower than old age related benefit ratios because the public
scheme benefit ratio includes not only old age pensions but also disability, widowers, survivor
and other pensions that are lower than old-age pensions. Therefore, the total average for all
those pensions combined is lower than for old-age pensions. The average pensions are
increasing slower during the projected period than the wages, because already mentioned
changes in the indexation of pensions (only 60% of the increase of the wages).
The projected total number of pensioners is lower than in previous projection due to the lower
number of actual pensioners in 2019 compared to the AR2018 projections for the year 2019.
The administrative data from the Pension and Disability Insurance Institute of Slovenia show
that the number of disability and survivor pensioners is steadily decreasing in Slovenia – this
was also the case between the 2016 (base year in AR2018) and 2019 (base year in AR2021).
In Slovenia, the labour market conditions were very favourable in 2019. The increase in the
number of contributors was from 891,000 in 2016 (base year for AR2018) to 961,000 in 2019
(base year for AR2021). This increase is in line with the increase of the number of employees
in this period (923,000 projected for 2019 in AR2018 and 983,000 as a base year in AR2021).
Table 11: System dependency ratio and old-age dependency ratio
change
2019 2030 2040 2050 2060 2070
2019-2070
Number of pensioners (thousand) 622.6 688.0 758.0 789.3 771.0 743.2 120.6
(I)
Employment (thousand) (II) 982.6 962.1 918.8 855.7 824.6 813.9 -168.7
Pension system dependency ratio 63.4 71.5 82.5 92.2 93.5 91.3 28.0
(SDR) (I)/(II)
Number of people aged 65+ 418.6 519.2 581.9 628.2 621.5 588.8 170.2
(thousand) (III)
Working age population 20-64 1260.5 1194.7 1141.3 1047.9 1006.9 1002.2 -258.3
(thousand) (IV)
Old-age dependency ratio 33.2 43.5 51.0 59.9 61.7 58.8 25.5
(OADR) (III)/(IV)
System efficiency (SDR/OADR) 1.9 1.6 1.6 1.5 1.5 1.6 -0.4
Source: Commission services
The numbers in Tables 12a and 12b are obtained by dividing the number of pensions (not
pensioners) by the number of (inactive) people. As in explanations to previous projections the
numbers are above 100% for: i) many pensions are paid to the pensioners abroad (especially
to ex-Yugoslavia’s republics) and the model does not differentiate between the number of
22You can also read