HEALTH EQUITY IN HAWKE S BAY - UPDATE 2016 - Hawkes Bay District Health Board
←
→
Page content transcription
If your browser does not render page correctly, please read the page content below
HEALTH EQUITY
 IN HAWKE S BAY
  TACKLING HEALTH INEQUITIES

  WE HAVE ALL GOT A ROLE TO PLAY

        UPDATE 2016
       www.ourhealthhb.nz
SUMMARY 04
         KEY FINDINGS 07
         INTRODUCTION 08
         TACKLING HEALTH INEQUITIES 09
         HEALTH OUTCOMES 12
         SOCIAL AND
         ECONOMIC FACTORS 18
         HEALTH BEHAVIOURS 28
         HEALTH CARE 36

         McElnay C 2016, Health Equity in Hawke’s Bay, Hawke’s Bay District Health Board.
         Acknowledgements: Lisa Jones
         Photography www.ankh.co.nz
2 HEALTH EQUITY REPORT 2016
3
SUMMARY

         TO TACKLE:
         To deal with a difficult or
         complex problem,
         to lead the initiative and go
         on the offensive

4 HEALTH EQUITY REPORT 2014
“Should we look for technical solutions and educate
people and patients about healthy behaviour?
Or should we… seek to create the conditions for
people to lead fulfilling lives, free from poverty and
drudgery? In my view we should do both.”
                                            Marmot 2015

Health Inequities are differences in health outcomes        Tackling behaviours – support people, whānau and
that are avoidable or preventable – and therefore           communities to live healthier lives – this includes
unfair. But they are not inevitable. We can make a          supporting programmes which engage and motivate
difference with a determined and focused effort that        people and whānau, as well as working with
addresses underlying causes and provides better,            communities to help make healthy choices easier and
closer to home health services. This means working          more accessible.
across the whole community to make sure living
                                                            Tackling social and economic factors – work together
conditions that support health are distributed fairly. It
                                                            to focus on better economic development and social
requires “tackling” and “going on the offensive”.
                                                            inclusion across Hawke’s Bay; support increases in
This “Tackling Health Inequities” report is a mixture of    minimum wage towards a living wage; tackle housing
good news and bad news. Thirteen of the 18 indicators       issues.
reviewed show improvements. Inequity has decreased
                                                            Tackling health care – assess the impact on health
and we are seeing progress in areas where effective
                                                            equity when designing health programmes or service
and targeted health services are making a difference.
                                                            changes, provide care that’s easy to reach and in the
However the powerful impact of social and economic          community, ask about social conditions and make
factors on health means for many other areas either         sure people are supported with referrals to agencies
progress is slow or worsening.                              that can help with income, social support and housing
                                                            improvements.
We still don’t fully understand the relationship
between health promoting behaviours and
disadvantage, but this report profiles one local
                                                            Dr Caroline McElnay,
initiative, Iron Māori, which demonstrates that
                                                            Health Equity Champion
behaviour change is possible if it’s supported
                                                            Director of Population Health
appropriately.
                                                            June 2016
This sets out an on-going challenge for us all if we
are serious about eliminating health inequity. It re-
emphasises the need to work closely with people,
whānau, communities and other agencies, as a team,
to build healthier and fairer communities. We need
a game plan to tackle the multiple determinants of
health:

                                                                                                                    5
If the current trends
continue there will be no
difference in health care
preventable death rates
between Māori and non-
Māori in the next one to
two years.

6 HEALTH EQUITY REPORT 2016
                              Photo courtesy HB Today
KEY FINDINGS
INEQUITY GAP IN DEATHS THAT COULD HAVE                       the effect of geography on this measure – Māori in
BEEN PREVENTED (AVOIDABLE DEATHS) NEARLY                     Hawke’s Bay can expect to live on average six years less
GONE                                                         than Māori in Otago. This variation is likely to be due
We have seen significant and continued reduction in          to underlying social and economic living conditions
deaths, which could have been prevented by either            and inequalities rather than any significant variation in
prevention or early treatment programmes or better           health services. It matters more where you live if you
access to medical care. Known as avoidable mortality         are Māori than if you are non-Māori
and amenable mortality indicators if the current trends      OF GREAT CONCERN ARE THE AREAS WHERE
continue there will be no difference in health care          HEALTH INEQUITY APPEARS TO BE WORSENING
preventable death rates between Māori and non-               OR STATIC
Māori in the next one to two years.                          All five areas highlighted in this report have strong
HOSPITAL ADMISSIONS FOR 0-4 YEAR OLDS, THAT                  social and economic links.
COULD HAVE BEEN AVOIDED, ARE REDUCING                        • ACUTE RESPIRATORY (BRONCHIOLITIS)
Ambulatory sensitive admissions for 0-4 year olds are          Admissions amongst children are increasing and
the number of hospital admissions which could have             are associated with poor housing conditions;
been avoided by prevention programmes in primary
                                                             • SMOKING AMONGST MĀORI WOMEN
care or better access to treatment in primary care in
                                                               REMAINS HIGH. Of all Māori women giving birth
this age group. We are seeing less of these admissions
                                                               in the past year 43 percent were smokers – at the
and good progress in reduction of inequity. This is
                                                               current slow rate of decrease it will be another
mostly due to specific health programmes such as
                                                               15 years before rates are the same as non-Māori.
the introduction of the rotavirus (a virus which causes
                                                               Helping women to stop smoking remains a priority
diarrhoea and dehydration in infants and young
children) vaccine into the childhood immunisation            • OBESITY IN FOUR YEAR OLDS has increased
schedule and a local management programme for skin             since 2009 with significant variation across
infections.                                                    communities. Nearly 12 percent of children living
                                                               in places like Camberley and Tamatea are obese
TEENAGE PREGNANCY RATES DECREASING
                                                               compared to less than 1 percent of four year olds
Teenage pregnancy rates have also decreased. This
                                                               living in places like Havelock North Central and
is largely due to improved access to primary care
                                                               Poraiti.
contraceptive and sexual health services. This is due to
more general practices able to offer free services for       • There has been no improvement in the ORAL
young people and a social media awareness raising and          HEALTH OF FIVE YEAR OLDS with Māori or
education campaign.                                            Pasifika children, or children living in less affluent
                                                               communities, having significantly more dental
AT LEAST 50 YEARS BEFORE EQUITY IN LIFE
                                                               decay.
EXPECTANCY BETWEEN MĀORI AND NON-MĀORI
IS ACHIEVED IF CURRENT TRENDS CONTINUE                       • The widening gap and increase in VIOLENT
We predict it will take at least 50 years before equity        CRIME in Hawke’s Bay compared to the rest of
in life expectancy between Māori and non-Māori is              New Zealand is a marker of underlying community
achieved if current trends continue. The variation in life     and social issues. Research tells us that the more
expectancy for Māori across New Zealand highlights             unequal societies are the more likely they are to
                                                               experience higher rates of violent crime.

                                                                                                                        7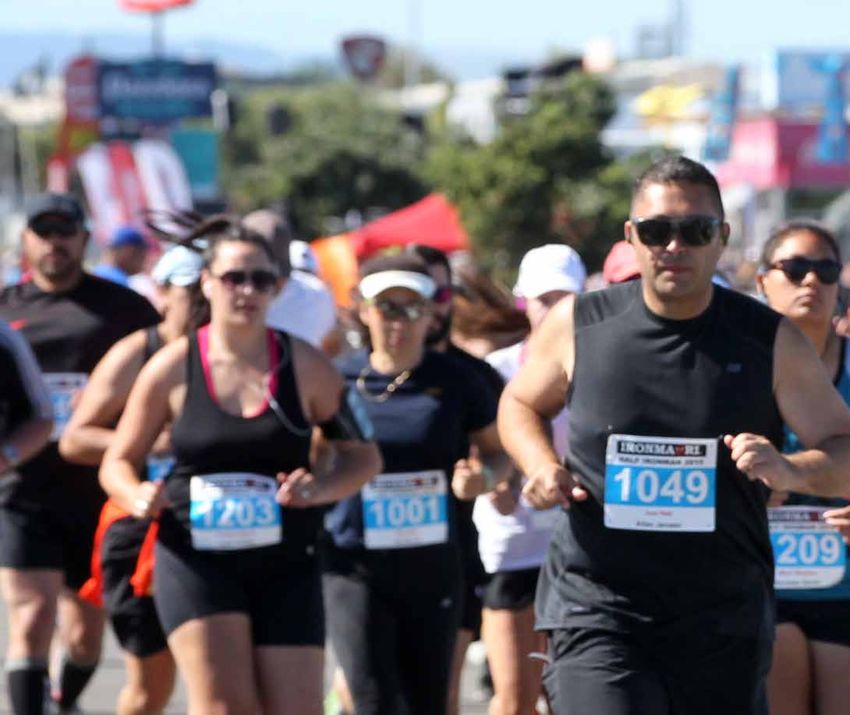
Hawke’s Bay is a great place to live. But
not everyone in Hawke’s Bay has the
same opportunity to be healthy.

INTRODUCTION
Hawke’s Bay is a great place to live. But not everyone     Quality of life is important but when there are still
in Hawke’s Bay has the same opportunity to be              significant differences in the length of life by ethnicity
healthy. Stark health inequities exist in some parts       that tells us that we need to do something about this
of our community with some groups having better            major health inequity. A quarter of all deaths among
health outcomes than others. For Hawke’s Bay to have       Māori in Hawke’s Bay occur before the age of 50,
the brightest future possible we need to collectively      mostly from preventable or treatable causes.
eliminate these health inequities.
                                                           “You haven’t told me anything I don’t already
So started my last report released in October 2014.        know – I live and work in communities where
This update gives us a chance to see how we are
                                                           health inequities are stark.”
progressing on some of the key areas of health
inequity.                                                  Many community groups told me that my report
The response to the 2014 report was mostly positive        wasn’t news to them – and my response was that
with many community groups, health professionals,          my report wasn’t directed at them – but at the many
local government and central government agencies           others in our community who don’t know about health
and media showing interest.                                inequities, and who don’t realise the contribution
                                                           that they too can make to improving health and well-
However not everyone was receptive or positive about
                                                           being in Hawke’s Bay. They may be business owners
the report. The feedback I received varied:
                                                           generating employment, teachers working with young
“This isn’t health equity – most of these                  Māori and Pasifika who may be struggling to achieve
diseases are due to poor lifestyle choices                 qualifications, philanthropists keen to give back to
made by some.”                                             their community. We all have a role in reducing
                                                           health inequity and the solutions lie amongst us all
Health inequities are differences in health outcomes
                                                           collectively.
which are avoidable or remediable – in other
words they are not inevitable. Not all differences in      “Your report missed many aspects of health
health outcome are avoidable, but when avoidable           such as mental well-being and domestic
differences are seen consistently between different        violence – they have a powerful impact on
groups of people, no matter how those groups are
                                                           health in our community and there must be
defined then those differences are inequitable.
                                                           inequities there.”
Many lifestyle choices such as smoking, drinking
alcohol, lack of exercise or poor eating are strongly      One of the biggest problems in trying to describe
linked with socioeconomic status and income. While         health equity and its drivers is the lack of good
ultimately people are responsible for the choices they     population health data in areas such as mental health,
make, many of those choices are influenced by factors      domestic violence, and whānau focused data. We
outside that person’s control. We need to dig deeper       need to develop better measures of well-being in
into what those influences are and help to make a          our community including how to better describe the
difference. We cannot assume that if only people knew      health of whānau and communities in a more holistic
what to do to improve their health they would do it –      way. Also some data sources are not updated annually
and if they didn’t then they must be lazy, disinterested   for example the Census and the New Zealand Health
and deserve all that befalls them consequently. I          Survey. There is also often a delay in some data
explore this in more detail in the next chapter.           releases – mortality data can be three years old by the
“Why are you focusing so much on deaths                    time the DHB receives it, thereby limiting our ability to
                                                           be up-to-date. Any health equity report can only ever
and length of life – surely it’s the quality of
                                                           be a snapshot of what is happening in the community.
life that’s important?”
8 HEALTH EQUITY REPORT 2016
“Your report missed many aspects of health such as mental
well-being and domestic violence – they have a powerful
impact on health in our community and there must be
inequities there.”

Future reports will look in more detail at these other    In this update I want to explore tackling health
areas. In addition the importance of whānau and on        behaviours in more detail.
whānau ora has long been identified as an important       When we look at the difference in healthy behaviours
component and a key driver of Māori development.          within a community we often see less healthy
Health equity for Māori therefore needs to consider       behaviours amongst communities which are less well
whānau health equity.                                     off. There have been many attempts to explain why
“What is the DHB going to do about this?                  this is so. It’s clearer when risk factors are linked to
This shows your services aren’t up to scratch             the unaffordability of essentials such as housing and
with the rest of the country.”                            heating. It’s more complicated when we look at risk
                                                          factors such as smoking, obesity or alcohol. How much
This DHB should of course aim and strive to provide       of this is due to informed personal choice and how
the best quality health services that it can and ensure   much due to other factors (linked in some way to social
equitable access to that health care – so that health     disadvantage) which actually stops people from making
needs are met in a timely, and high quality way. I        more healthy choices?
highlighted in my 2014 report the particular issues
                                                          Most people know smoking harms health and about
around access to primary care, especially amongst
                                                          the importance of good food and regular exercise. The
45-64 year olds and the barriers that the cost of going
                                                          reasons people continue to smoke and that obesity
to a general practice can create. However addressing
                                                          continues to increase do not stem from ignorance.
many of the causes of ill-health lie outside the direct
                                                          Advice is useful but it is not how much people know
control of the DHB. This is why Hawke’s Bay DHB is
                                                          that determines whether they behave as the advice
working closely with other agencies across Hawke’s
                                                          suggests. What we fail to understand are the barriers
Bay, including businesses and the economic sector, to
                                                          that are stopping people from taking up those healthy
develop ways of tackling these issues together.
                                                          behaviours.
                                                          Empowerment is about knowing you have control
TACKLING HEALTH INEQUITIES:                               over many aspects of your health, about valuing the
CHANGING BEHAVIOUR                                        changes you can make and about then making those
There are many factors which influence health and         changes. Research has shown that empowerment is
therefore many ways of addressing health inequities.      often absent in less well-off communities often then
These factors can be categorised into four main areas:    resulting in a belief that change isn’t possible or they
  Health behaviours – such as use of tobacco,             can’t make changes to their health. This may help
  nutrition, physical activity, alcohol                   explain some of the variation we see in patterns in
                                                          healthy behaviour.
  Health care – both access to care and receipt of high
                                                          Tackling health inequities and helping to change
  quality health care
                                                          behaviours therefore requires both a supportive
  Social and economic factors – where education           environment and empowerment framework.
  and income are two of the biggest determinants of
                                                          • First by making healthy choices the easy choices
  health
                                                            (for example: knowledge, availability and cost,
  Physical environment – the quality of our air, water      supportive environment)
  and other environmental factors that can directly       • Secondly by empowering people to make decisions
  influence our health and well-being.                      that will positively influence their health and well-
Tackling health inequities requires a combination           being.
of approaches and broad community effort and
leadership. Solely focusing on one area will not get us
the health equity we want.

                                                                                                                     9
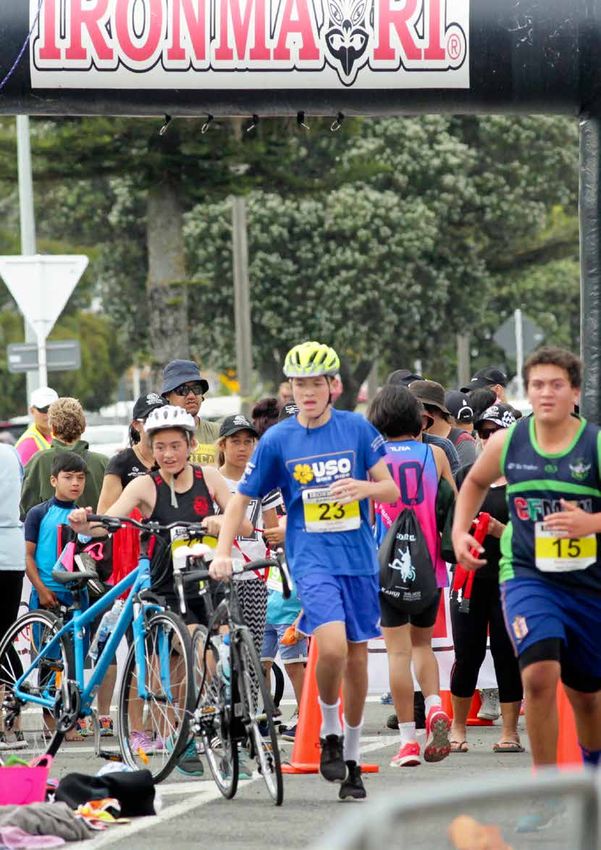
IRON MĀORI                                                   Empathy and trust are not just words on a mission
                                                             statement; Lee says that Iron Māori is real .
A local example of an empowerment model is Iron
                                                                “People stand up at the info evenings and talk
Māori. I spoke to Heather Skipworth the founder of
                                                               about their life story - this resonates with people
Iron Māori and fellow trustee Lee Grace about Iron
                                                               who are in that position. They may be living with
Māori and its Kaupapa.
                                                               drugs and violence and alcohol at the moment but
Iron Māori was first established in 2009. It offers            they see someone who was doing that two years
triathlon-style swim, run, and cycle events in a variety       ago talking about how their lives changed. This
of distance ranges for both individuals and for teams.         openness and vulnerability is really powerful.”
It’s very popular both within Hawke’s Bay and across
                                                             Whanaungatanga and the inclusiveness of Iron Māori
New Zealand.
                                                             is an essential part of the physical training
For many of its participants it has proved to be
                                                               “Even with the practical training side of things
life changing with many going on to achieve other
                                                               there are barriers that individuals have to overcome
personal goals in education, employment and
                                                               to feel included. For some people simply wearing
improved health and mental wellbeing.
                                                               togs for the first time in front of a bunch of people
Heather’s original concept for Iron Māori came out             is hard. But with a lot of laughter and humour it
of her own sense of achievement she experienced on             doesn’t take long for people to come in and they are
completing her first Iron Man event. At the time she           comfortable.”
was working with some clients with weight problems
                                                             Trust, being inclusive and having a lot of empathy are
and she wanted to help them get that same sense of
                                                             key to Iron Māori’s strength. But so too is the belief in
achievement and accomplishment in reaching their
                                                             people.
goals.
                                                               “We say we can take you and we will have you
  “When you complete something that’s hard,                    swimming… we believe you - you can do it and
  arduous, takes a lot of tenacity and it’s something          we keep believing in them even when they don’t.
  that people don’t expect you to be able to do, you           Someone else believes in them enough that they
  grow from that. That transcends an event and                 keep doing it and when they do it they feel great!”
  ends up in other aspects of your life – how you
                                                             The health benefits are side benefits that come about
  think about yourself and how you expect more of
                                                             as people realise smoking or too much alcohol doesn’t
  yourself. There is a shift in peoples thinking from ‘I
                                                             fit into an active lifestyle. But the change comes
  can’t do this’, ‘this is the mould I’m in’ ‘…this is how
                                                             from them – no-one is telling them to stop – they
  life has been’ towards realising that all of those are
                                                             want to change and Iron Māori gives them a belief in
  changeable.”
                                                             themselves to change the things they thought they
Iron Māori does this by creating an accepting and            couldn’t.
supportive environment for those who register for            “I can kick that habit because I don’t want it.”
one of their events. This starts right from the very first   Heather and Lee have also seen people going back into
meeting where people share their stories and ‘you are        study and getting into training or employment.
surrounded by a lot of people who can accept you for            “This is not about rules – or saying you can’t smoke
your whole person’.                                            or drink - it’s a positive drive as opposed to reducing
This non-judgemental aspect is emphasised:                     the negative. They have a reason to want to change
   “You can go to doctors and even if he’s not                 and they are supported by others who are doing the
  judgemental he’s going to say you are overweight –           same.”
  you need to lose some weight. We never tell people           “By accomplishing a goal in a supportive way and
  they are obese. We never concentrate on their                feeling really good …opens up a whole world of ‘I
  health issues. We just include them and the health           can do that’ – it’s about confidence to go and do
  issues slowly slip away without even having talked           things.”
  about them.”

10 HEALTH EQUITY REPORT 2016
Role models are important – and what Iron Māori a Kaupapa – this is your life, this is part of your
provides is for people who are achieving their personal lifestyle and a way of living. We never say it’s a
goals, not drinking and spending more time with their programme – even if you leave Iron Māori your
families to be positive role models for others. journey still continues – it has no end. “
“We don’t get bogged down in the why or the There are other programmes in our community which
theory or the latest study on motivation to change. support empowerment and motivation to change.
We just do it and we try to understand people. They vary in detail but the central theme is about
We know what’s really powerful is when you hear giving back control to people to make changes in their
someone speak and they are telling your story, and lives and the lives of their whānau. These types of
the time is right - then that’s your motivation. programmes and a resolve to provide an environment
“We never tell anyone they are on a programme to support healthy choices will have a positive impact
– because programmes begin and end. This is on behaviours and the choices that people make.
11
Photo courtesy HB TodayCHAPTER 1.0
HEALTH
OUTCOMES
At the current rate of change in life
expectancy equity for Māori won’t be
reached for another nearly 50 years.
12 HEALTH EQUITY REPORT 2016At the current rate of change in life expectancy
equity for Māori won’t be reached for another
nearly 50 years.
LIFE EXPECTANCY – HOW LONG WE LIVE
There is no updated life expectancy data, by District Māori and non-Māori is 8.2 years for males and 7.7
Health Board, since the last Health Equity 2014 report years for females. This is one of the largest gaps in life
- that was for the period 2008-10. However recent expectancy across New Zealand, which varies from one
analysis by Statistics New Zealand calculates life year in Otago to nine years in Northland. This variation
expectancy by territorial authority regions for 2012- in gap is due to the variation in life expectancy for
14 and also compares the results with 2005-07. The Māori across the country, rather than any variation in
Hawke’s Bay territorial region is very similar to the life expectancy for non-Māori. Māori in Hawke’s Bay
Hawke’s Bay DHB boundaries and this analysis provides can expect to live on average six years less than Māori in
us for the first time a comparison of how we do in Otago. This variation in life expectancy for Māori across
relation to other parts of New Zealand and how life New Zealand will be heavily influenced by social and
expectancy has changed over this seven year period. economic factors rather than health behaviours and local
Life expectancy at birth has increased in all regions in health service provision.
New Zealand since 2005–07, with Hawke’s Bay Analysis of trends in life expectancy between 2005-07
increasing the most - by 1.5 years for males and 1.2 and 2012-14 by ethnicity and gender shows that the
years for females. Hawke’s Bay however remains in the biggest gains in life expectancy across New Zealand
bottom quartile of the 16 territorial authority regions. were for Māori males in Hawke’s Bay and for Māori
The gap in life expectancy in Hawke’s Bay between females in Hawke’s Bay, along with gains in the
Taranaki, Tasman and West Coast regions.
LIFE EXPECTANCY IN HAWKE’S BAY REGION, BY ETHNICITY AND GENDER, 2012-14, YEARS
HAWKE’S BAY LIFE EXPECTANCY GAP NEW ZEALAND LIFE EXPECTANCY GAP
Males 78.6 years 79.5 years
3.8 years 3.7 years
Females 82.4 years 83.2 years
Māori Male 71.7 years 73.0 years
8.2 years 7.3 years
Non - Māori Male 79.9 years 80.3 years
Māori Female 75.9 years 77.1 years
7.7 years 6.8 years
Non - Māori Female 83.6 years 83.9 years
Māori Female 76 years Māori Male 72 years
Non-Māori Non-Māori Male 80 years
Female 84 years
131.0 HEALTH OUTCOMES
The 1.4 years reduction in life expectancy gap between Good progress appears to have been made in Hawke’s
Māori and non-Māori males in Hawke’s Bay is also the Bay over the past seven years, especially compared to
largest reduction observed across the regions in New other regions. However at the current rate of change
Zealand. in life expectancy equity for Māori won’t be reached
for another nearly 50 years.
Gap
GAP IN YEARS BETWEEN MĀORI ANDinNON-MĀORI
years between Maori
LIFE EXPECTANCY BY & non-Maori
GENDER AND REGION 2012-14
life expectancy by gender & region 2012-14
Northland
Gap (years)
MALE
0 - 2.0 Auckland
2.1 - 3.0
3.1 - 4.0
Waikato
4.1 - 5.0 Bay of Plenty
Gisborne
5.1 - 6.0
6.1 - 7.0
Taranaki
Hawke's Bay
7.1 - 8.0
Manawatu-Wanganui
8.1 - 9.0
9.1 - 10.0
Nelson Wellington
Tasman Marlborough Northland
West Coast
Auckland
Canterbury
Waikato
Bay of Plenty
Gisborne
Otago
Taranaki
Hawke's Bay
Southland
Manawatu-Wanganui
Wellington
Nelson
Gap in years Tasman Marlborough
Region Male Fem ale
Northland 9.3 8.6
Auckland 7.4 6.8 West Coast
Waikato 8.1 7.5 Gap (years)
Bay of Plenty 8.4 7.8 Canterbury FEMALE
Gisborne 9.0 8.4
0 - 2.0
Haw ke's Bay 8.2 7.7
Taranaki 6.1 5.3 2.1 - 3.0
Manaw atu-Wanganui 7.2 7.0 3.1 - 4.0
Wellington 5.6 5.3 Otago
4.1 - 5.0
Tasman 2.7 2.4
Southland
Nelson 2.7 2.3
5.1 - 6.0
Marlborough 3.0 2.9 6.1 - 7.0
West Coast 2.9 2.5
7.1 - 8.0
Canterbury 2.8 2.6
8.1 - 9.0
Otago 1.2 1.0
Southland 4.4 4.1 Source: Stats NZ subnational life expectancy tables 2015.
14 HEALTH EQUITY REPORT 2016COMPARISON OF PREMATURE DEATHS IN HAWKE’S BAY BETWEEN 2006-10 AND 2008-12
DEATHS UNDER 75 YEARS DEATHS UNDER 50 YEARS
2006-2010 2008-2012 2006-2010 2008-2012
Māori 77.0% 73.2% 26.3% 24.8%
Pasifika 52.4% 63.4% 23.8% 29.0%
Other 31.9% 31.3% 5.1% 5.2%
Quintile 5 56.5% 54.5% 16.1% 14.8%
Quintile 1 20.6% 20.8% 4.4% 3.9%
HB Total 38.7% 38.0% 9.2% 8.5%
PREMATURE DEATHS or because of effective treatment and health care. Deaths
due to these diseases or conditions can be counted
Premature deaths are deaths before the age of 75 years.
and expressed as a rate. Any difference in these rates
In Heath Equity 2014 I highlighted the inequity in the
by ethnicity or by area of residence can therefore be
proportion of premature deaths before 75 years but
considered to be a health inequity.
also, more shockingly, in deaths before the age of 50
years for both Māori and Pasifika in Hawke’s Bay. The The equity gap in avoidable deaths is
latest figures for 2008-12 show improvements with a reducing and should close by 2017 if
small decrease in the percentage of Māori dying before current trends continue. Avoidable death
the age of 50 years but an increase for Pasifika people rates are still two times higher amongst
(numbers are very small). Māori and amongst people living in
A quarter of the deaths in our Māori Quintile 5 areas in Hawke’s Bay.
communities occur before the age of 50 The top cause of avoidable death across all ethnic groups
compared to only 5 percent in our non- remains ischaemic heart disease (heart attacks), accounting
Māori non-Pasifika communities. Most of for about 20 percent of all avoidable deaths. The top
cause of avoidable death for Māori women is lung cancer,
these deaths are avoidable. followed by ischaemic heart disease. The top cause of
death for non-Māori women remains breast cancer. Road
AVOIDABLE DEATHS traffic injuries and diabetes continue to be significant
Nearly three-quarters of all deaths before the age of 75 causes of death amongst Māori. Suicide is a significant
years are avoidable either because of disease prevention cause of death for all ethnicities.
HAWKE’S BAY AVOIDABLE MORTALITY AGE STANDARDISED RATE PER 100,000 BY ETHNICITY
500
450
400
Māori
Age standardised rate per 100,000
350
Other
300
250
200
150
100
50
0.0
2006 2007 2008 2009 2010 2011 2012
Source: Ministry of Health National Mortality Collection
151.0 HEALTH OUTCOMES The equity gap in avoidable deaths is reducing and should close by 2017 if current trends continue. 16 HEALTH EQUITY REPORT 2016
TOP CAUSES OF
                  AVOIDABLE DEATHS                        MĀORI MALES            OTHER MALES          MĀORI FEMALES             OTHER FEMALES
                  Ischaemic heart disease                     26.6% (1)               22.3% (1)            15.6% (2)                   12.3% (3)
                  Road traffic injuries                       12.5% (2)               4.5% (6)              3.9% (8)                      –
                  Lung cancer                                 10.3% (3)               17.7% (2)            22.4% (1)                   13.6% (2)
                  Diabetes                                     8.2% (4)               3.5% (9)              8.3% (4)                   2.8% (9)
                  Suicide & self-inflicted injuries            6.0% (5)               8.3% (3)              5.4% (6)                   3.2% (8)
                  Complications infant perinatal period        4.1% (6)                  –                      –                         –
                  Cerebrovascular disease                      3.8% (7)               5.7% (5)              5.4% (6)                   7.8% (5)
                  COPD (respiratory disease)                   3.4% (8)               4.1% (8)              5.9% (5)                   6.9% (6)
                  Breast cancer                                     –                    –                  8.3% (3)                   14.1% (1)
                  Colorectal cancer                            3.1% (9)               7.9% (4)                  –                      11.9% (4)
                  Melanoma skin                                     –                 4.2% (7)                  –                      4.5% (7)
                  Stomach cancer                              2.5% (10)                                         –                         –

          POTENTIAL YEARS OF LIFE LOST (PYLL)
          Another way of looking at premature deaths is to                             • being in a car involved in a transport accident
          calculate the average years a person would have                                (Māori 4.6 times and Pasifika 3 times higher)
          lived if they had not died prematurely. This method                          • lung cancer (Māori 3 times higher)
          emphasises the importance of causes of death which                           • diabetes (Māori 5 times and Pasifika 3.5 times
          occur at earlier ages because there are more potential                         higher)
          years of life lost (PYLL).                                                   In the time period 2008-12 a set of conditions coded
          The most recent time period studied (2008-12)                                as “Other accidental threats to breathing” emerged as
          shows that there have been reductions in PYLL and                            a top cause of PYLL for Māori (Māori 17 times higher).
          a reduction in inequity for Māori and people living                          This latter grouping includes Sudden Unexplained
          in Quintile 5 areas. However Māori rates are still 2.0                       Death in infancy (SUDI). A small number of deaths at
          times, Pasifika rates 2.9 times and people living in                         an early age (these deaths all occurred in the first year
          Quintile 5 1.8 times higher than the rest of Hawke’s                         of life) will result in large numbers of potential years of
          Bay.                                                                         life lost. SUDI rates in Hawke’s Bay have been falling
          The top conditions to target to reduce health inequity                       but a spike was seen in 2010-11. This spike was noticed
          continue to be:                                                              and led to local maternity and early child care services
          • ischaemic heart disease (heart attacks) (Māori 4                           implementing a Safe Sleep programme focused on the
             times and Pasifika 3 times higher),                                       prevention of SUDI.

          TOP CAUSES OF POTENTIAL YEAR OF LIFE LOST (2008-12) BY ETHNICITY
                      1200
                                                                                                                                            Māori

                      1000                                                                                                                  Pasifika
                                                                                                                                            Other
PYLLASR per 100,000

                       800

                       600

                       400

                       200

                         0
                              Ischeaemic
                                     Car occupant         Suicide       Lung cancer      Diabetes    Digestive organ   Breast cancer      Accidental
                             heart disease
                                     in transport                                                        cancer                           threats to
                                       accident                                                                                           breathing
     Source: Ministry of Health National Mortality Collection                  CONDITION
                                                                                                                                                    17 17
CHAPTER 2.0
SOCIAL AND
ECONOMIC
FACTORS
This section looks at some social
and economic factors which can influence
health and where possible looks at
the distribution of those across the
community.
18 HEALTH EQUITY REPORT 2014CHILDREN LIVING IN HOUSEHOLDS
RECEIVING BENEFITS
There has been a decrease in the percentage of olds in Hawke’s Bay compared to 18 percent in New
children in Hawke’s Bay living in households receiving Zealand (at end June 2015).
a working age main benefit although these figures are There are however still clear disparities by ethnicity,
still higher than for New Zealand as a whole. Twenty particularly for Māori, with the most recent figures
eight percent of 0-4 year olds live in households for 2015 showing 42 percent of Māori children aged
receiving a working age benefit compared with 21 0-4 years living in such households compared to 15.3
percent for New Zealand and 23 percent of 0-14 year percent of non- Māori non-Pasifika children.
PERCENT OF CHILDREN (0-4 YEARS) LIVING IN A HOUSEHOLD DEPENDENT ON A MAIN BENEFIT BY ETHNICITY
(AS AT END OF JUNE YEAR)
60.0
Māori
Other
50.0
Pacific
40.0
30.0
%
20.0
10.0
0.0
2011 2012 2013 2014 2015
Source: Ministry of Social Development
PERCENT OF CHILDREN LIVING IN HOUSEHOLDS DEPENDENT ON A MAIN BENEFIT BY ETHNICITY 2015.
ETHNICITY HB 0-4 YEARS NZ 0-4 YEARS HB 0-14 YEARS NZ 0-14 YEARS
Māori 42.4% 36.9% 36.4% 25.4%
Pacifika 15.6% 18.5% 15.2% 14.5%
Other 15.3% 11.9% 13.0% 9.0%
TOTAL 28.3% 20.6% 22.8% 17.8%
Source: Ministry of Social Development
192.0 SOCIAL AND ECONOMIC FACTORS
25.9 PERCENT OF
YOUNG MĀORI ARE
NOT IN EDUCATION,
EMPLOYMENT OR
TRAINING COMPARED
TO 9.1 PERCENT OF
EUROPEAN YOUNG
PEOPLE.
20 HEALTH EQUITY REPORT 2016
2014YOUNG PEOPLE NOT IN EDUCATION,
EMPLOYMENT OR TRAINING (NEET)
Young people not in employment, education, or The proportions of young people who are NEET in
training (NEET) are young people aged 15–24 years Hawke’s Bay fluctuate, as do the national rates.
who are unemployed (not part of the labour force) The most recent figures show that 25.9 percent of
and not engaged in education or training. These young Māori are not in education, employment or
young people are at greater risk of a range of negative training compared to 9.1 percent European young
outcomes including poorer health, depression, or early people.
parenthood. This is an indicator where there have
been consistent differences in the rates of NEET by Given the fluctuating data it is difficult to determine
ethnicity, with Māori rates often between 2-3 times whether this gap is closing or not.
higher than non- Māori rates.
HAWKE’S BAY REGION NOT IN EMPLOYMENT EDUCATION OR TRAINING (NEET) RATE 15-24YRS (PERCENT) 2009-15
45
Māori
European
40
35
30
25
Neet rate %
20
15
10
5
0.0
2009.03
2009.06
2009.09
2009.12
2010.03
2010.06
2010.09
2010.12
2011.03
2011.06
2011.09
2011.12
2012.03
2012.06
2012.09
2012.12
2013.03
2013.06
2013.09
2013.12
2014.03
2014.06
2014.09
2014.12
2015.03
2015.06
Source: Household Labour Force Survey – Statistics NZ
212.0 SOCIAL AND ECONOMIC FACTORS
There is good evidence to
show that work is generally
good for physical and mental
health and well-being.
22 HEALTH EQUITY REPORT 2016
2014UNEMPLOYMENT
There is good evidence to show that work is generally locally and nationally do seem to have decreased since
good for physical and mental health and well-being September 2012. At 7.2 percent in June 2015 Hawke’s
and being unemployed does tend to be associated Bay rates are just higher than the New Zealand average
with poorer physical and mental health. of 5.7 percent.
Being unemployed is defined as all people in the European unemployment rates have been relatively
working-age population who during the reference stable at around 6 percent since September 2012.
week were without a paid job, available for work, and Māori rates have decreased substantially since
had either actively sought work in the prior four week March 2014 averaging out at around 12.5 percent for
period, or had a new job to start within the next four the past period December 2014 to June 2015 with a
weeks. reduction in the equity gap.
Unemployment rates in Hawke’s Bay have fluctuated
over the period March 2009 to June 2015 and both
HAWKE’S BAY REGION 2009-2015 - QUARTERLY UNEMPLOYMENT RATE PERCENTY
30
Māori
European
25
Unemployment rate %
20
15
10
5
0.0
2009.03
2009.06
2009.09
2009.12
2010.03
2010.06
2010.09
2010.12
2011.03
2011.06
2011.09
2011.12
2012.03
2012.06
2012.09
2012.12
2013.03
2013.06
2013.09
2013.12
2014.03
2014.06
2014.09
2014.12
2015.03
2015.06
Source: Household Labour Force Survey – Statistics NZ
232.0 SOCIAL AND ECONOMIC FACTORS
CHILDHOOD DISEASE LINKED WITH
SOCIOECONOMIC CONDITIONS
There are many childhood diseases that are known Hawke’s Bay was significantly lower than the New
to be linked to socioeconomic conditions with much Zealand rate.
higher rates or worse outcomes seen in those children There has been a reduction locally in the admission
living in the most socioeconomically deprived areas. rates for Māori and Asian / Indian with fluctuation in
Most of these conditions are infectious and respiratory Pasifika rates. There remains a marked disparity in
diseases and many can be directly linked to cold admission rate by ethnicity but substantial closing
damp houses and overcrowding. The Health Equity of the gap in admission rates between Māori and
report 2014 highlighted that admission rates for these European / other children.
conditions had increased in Hawke’s Bay since 2006 for
all ethnic groups but particularly for Pasifika children Unfortunately NZCYES have not provided data on
with a widening in health equity gap for both Pasifika trends in admissions for the individual diseases in this
and Māori. category.
Updated data from the NZ Child and Youth It is not clear if this decrease in admissions is due to
Epidemiology service (NZCYES) show that In Hawke’s an improvement in living conditions or due to other
Bay for the period 2009-13 the overall rate of factors such as vaccination programmes and earlier
admissions for all conditions with a social gradient in treatment in primary care.
HOSPITAL ADMISSIONS FOR MEDICAL CONDITIONS WITH A SOCIAL GRADIENT, PER 1000, 0-14 YEARS OLD, BY
ETHNICITY, HAWKE’S BAY VS NEW ZEALAND, 2000-13
140 Māori
European/Other
Medical admissions per 1,000 children 0-14years
120 Pacifika
Asian/Indian
100
80
60
40
20
0
2000
2001
2002
2003
2004
2005
2006
2007
2008
2009
2010
2011
2012
2013
2000
2001
2002
2003
2004
2005
2006
2007
2008
2009
2010
2011
2012
2013
NEW ZEALAND HAWKE’S BAY
Source: New Zealand Child & Youth Epidemiology Service
24 HEALTH EQUITY REPORT 2016Over the period 2010-14 Hawke’s Bay had higher rates
ACUTE BRONCHIOLITIS
of bronchiolitis admissions than the New Zealand
Acute bronchiolitis is a one of the diseases in the average (111.1 per 1000 compared to 84.6 per 1000,
list of medical conditions with a social gradient for a relative rate of 1.3 times higher). Admission rates
admissions to hospital. It is a viral infection of the have been generally increasing since 2001 but have
airways and occurs mainly amongst infants under one decreased for Māori and Pasifika children over the
year old. It is the most common cause of hospital past 5-6 years (with an increase for Pasifika children
admission in this age group and tends to occur most in 2014-15). However there continues to be inequity
frequently in late winter. In 2014-15 there were 283 with higher rates of bronchiolitis amongst Māori (3
children admitted to hospital with this condition in times) and Pasifika (4 times) children and amongst
Hawke’s Bay, of whom 180 were Māori, 65 Other children from Quintile 5 areas (4 times) – these are
ethnicity and 38 Pasifika. all statistically significantly higher rates.
There are a number of risk factors which increase the
likelihood of infection such as prematurity, congenital
heart disease, immune deficiency, household
overcrowding, poverty, lack of breastfeeding, maternal
smoking during pregnancy and exposure to tobacco
smoke in the home.
ACUTE BRONCIOLITIS ADMISSIONS 0-14 YEAR OLDS HBDHB
3500 HB Māori
HB Other
3000 HB Pacific
HB Total
2500
2000
Rate per 100,000
1500
1000
500
0
2
3
4
5
6
7
8
9
0
1
2
3
4
5
/0
/0
/0
/0
/0
/0
/0
/0
/1
/1
/1
/1
/1
/1
01
02
03
04
05
06
07
08
09
10
11
12
13
14
20
20
20
20
20
20
20
20
20
20
20
20
20
20
Source: Ministry of Health National Minimum Dataset
252.0 SOCIAL AND ECONOMIC FACTORS
The rate of serious assaults
resulting in injury in Hawke’s
Bay is twice the New Zealand
average.
26 HEALTH EQUITY REPORT 2016
2014PREVALENCE OF VIOLENT CRIME
The links between crime and health are complex. to the police and is may vary due to changes in police
Violent crime may result in temporary or permanent crime reporting procedures. It is also only available at
disability and in some cases death. Some victims a Hawke’s Bay level, not by ethnicity or socioeconomic
of crime may suffer psychological distress and decile.
subsequent mental health problems. Crime and fear of Hawke’s Bay rates of violent crime continue to be
crime can also alter people’s lifestyles and impact on higher than the New Zealand average and are twice
their physical and psychological health. There is also the rate for New Zealand as a whole. Over the last
concern about homicide and suicide by people with five years there has been a slight increase in the rates
mental illness. of assault resulting in injury in Hawke’s Bay with a
NZ Police data has been analysed to try to ascertain reduction nationally resulting in a widening of the gap
the prevalence of violent crime in Hawke’s Bay. The in equity between Hawke’s Bay and New Zealand as
data only includes violent offences which are reported a whole.
RECORDED SERIOUS ASSAULT RESULTING IN INJURY OFFENCE RATE PER 10,000 POPULATION
HAWKE’S BAY AND NZ
50.0 Hawke’s Bay
New Zealand
45.0
40.0
35.0
Rate per 10,000 population
30.0
25.0
20.0
15.0
10.0
5.0
0.0
96
97
98
99
00
01
02
03
04
05
06
07
08
09
10
11
12
13
14
19
19
19
19
20
20
20
20
20
20
20
20
20
20
20
20
20
20
20
Source: New Zealand Statistics
27CHAPTER 3.0
HEALTH
BEHAVIOURS
The measures in this section look at
health behaviours. These are known risk factors
which have a direct influence on
health and can change through changes
in behaviour.
28 HEALTH EQUITY REPORT 2014TOBACCO USE AMONGST YOUNG
PEOPLE Smoking is an addiction largely taken up in childhood
In the Health Equity Report 2014 tobacco use was and adolescence, so it is crucial to reduce the number
highlighted as the single biggest underlying cause of of young people taking up smoking in the first place.
inequity of death rates and ill-health in Hawke’s Bay. Most current and ex-smokers say that they started
In particular the high rate of smoking amongst Māori smoking regularly before they were 18 with many
women giving birth was highlighted and declared a smoking regularly before the age of 16.
public health crisis, given the effects that smoking has The percentage of year 10 students who are regular
both for the mother and on the health of her infant smokers has been dropping consistently since the first
with lasting impacts into adulthood. survey in 1999 when 28.6 percent of students across
The main source of information on smoking rates New Zealand were regular smokers compared to only
6 percent in 2014. The latest survey indicates that 8.7
comes from the census but this will not be updated
percent of year 10 students in Hawke’s Bay are regular
until 2018. However the latest Ministry of Health
smokers. This is statistically higher than the 6 percent
funded ASH (Action on Smoking and Health) Year 10
for New Zealand.
survey results are available (2014). This survey is an
annual questionnaire of around 30,000 students across This decrease has been seen across all ethnic groups
with a narrowing of the gap in prevalence noticeable
New Zealand. It is conducted in schools throughout
since 2006. Māori continue to have higher rates of
the country and is one of the biggest surveys of its
regular smokers (17 percent) with the lowest rates
kind. It has been going for 16 years and gives us seen amongst Asian students (2 percent) and 5 percent
a valuable and robust insight into rates of youth European.
smoking.
HAWKE’S BAY DHB YEAR 10 FEMALES PERCENT REGULAR SMOKERS
60.0
HB Māori
European and other
50.0
Pasifika
Asian
40.0
% Regular smokers
30.0
20.0
10.0
0.0
99
00
01
02
03
04
05
06
07
08
09
10
11
12
13
14
19
20
20
20
20
20
20
20
20
20
20
20
20
20
20
20
Source: Action on Smoking and Health (ASH)
293.0 HEALTH BEHAVIOURS Reducing smoking rates amongst
Māori women must remain a key
health equity target.
Year 10 girls are more likely to be regular smokers than Twenty three percent of all women who had a baby
year 10 boys. Nearly 20 percent of Māori girls aged at a Hawke’s Bay DHB facility during 2014-15 were
15 years are regular smokers this is six times the current smokers with big differences seen both by
rates of smoking amongst European girls and twice ethnicity and by deprivation.
the rate amongst Māori males (11 percent). Pasifika
Pregnant women who are Māori or who
girls are also more likely to be regular smokers but the
rate is 1.7 times that of European girls.
live in a Quintile 5 area are five times
more likely to be smokers than non-
Improvements continue to be seen and the gap in
Māori or women living in a Quintile 1
smoking rates for both boys and girls by ethnicity
is closing. Tackling smoking rates amongst young
area.
Māori women remains a key health priority and is an Forty three percent of all Māori women
area where more innovative and whānau-inclusive giving birth were smokers compared to
approaches will be required. 8.6 percent of non-Māori non-Pacific
Tobacco use in pregnancy women; 32 percent of women living in
Smoking in pregnancy has well known detrimental Quintile 5 compared to 6 percent living
effects for the growth and development of the baby in Quintile 1.
and health of the mother. These include complications
during labour and an increased risk of miscarriage, Rates of smoking amongst pregnant women peaked in
2010-11 and have been very slowly decreasing since
premature birth, stillbirth, low birth-weight and
then. If the percentage of Māori women who are regular
sudden unexpected death in infancy.
smokers, or the percentage of women living in Quintile 5
Encouraging pregnant women to stop smoking during areas, declines at the same rate as it has since 2010-11
pregnancy may also help them kick the habit for good, (nearly 10 percent reduction over 5 years) equity won’t
and thus provide health benefits for the mother and be achieved for at least 15 years.
reduce exposure to second-hand smoke by the infant. Reducing smoking rates amongst Māori women must
remain a key health equity target.
PERCENT OF SMOKER STATUS OF WOMEN DELIVERING IN HBDHB FACILITIES BY ETHNICITY 2006-07 TO 2014-15
60.0%
HB Māori
European and other
50.0%
Pasifika
Total
40.0%
30.0%
20.0%
10.0%
0.0%
7
8
9
0
1
2
3
5
5
/0
/0
/0
/1
/1
/1
/1
/1
/1
06
07
08
09
10
11
12
13
14
20
20
20
20
20
20
20
20
20
Source: HBDHB Data Warehouse
30 HEALTH EQUITY REPORT 2016OBESITY IN FOUR YEAR OLD CHILDREN
There has been an increase in the prevalence of four years old. Height and weight are collected at the
obesity in four year olds since 2009 (5.8 percent) and time of the check and this provides an opportunity to
a widening in inequities. assess if the child has a healthy weight.
The World Health Organization (WHO) regards In 2015 6.5 percent children who had a B4 school
childhood obesity as one of the most serious global check were assessed as being obese (1 in 16). Of the
public health challenges for the 21st century. Obese 143 children assessed as obese, 89 were Māori, 35
children and adolescents are at an increased risk of Other and 19 Pasifika. Obesity prevalence was three
developing various health problems, and are also more times higher amongst Māori children (10.5 percent)
likely to become obese adults and have a higher risk and nearly six times higher amongst Pasifika children
of morbidity, disability and premature mortality in (16.5 percent) compared to Other children (2.9
adulthood. percent). There is a clear socio-economic gradient
The B4 school check is part of the Well Child schedule in prevalence with 11.6 percent of four year olds in
of childhood milestone checks. It generally occurs just Quintile 5 obese compared to 0.4 percent in Quintile 1
before the child begins school when the child is aged (four times higher).’
PREVALENCE OF OBESITY : FOUR YEAR OLDS
18%
HB Māori
Other
16%
Pasifika
14%
12%
Prevalence %
10%
8%
6%
4%
2%
0%
2009 2010 2011 2012 2013 2014 2015
Source: B4school data base. Health Hawke’s Bay
313.0 HEALTH BEHAVIOURS
There has been no improvement
in the percentage of four year
olds who are a healthy weight.
32 HEALTH EQUITY REPORT 2016Healthy weight prevalence rates
Using healthy weight data is an alternative to focusing
on obesity. Children with a healthy weight are children
who are not overweight, obese nor underweight.
Our aim is to increase this proportion and reduce
inequities. In 2015 approximately 70 percent of four
year olds had a healthy weight, with no improvement
since 2009. 63 percent of Māori children and 53
percent of Pasifika children assessed had a healthy
weight.
PREVALENCE OF HEALTHY WEIGHT : FOUR YEAR OLDS
90%
80%
70%
60%
Prevalence %
50%
40%
30%
Māori
20%
Other
Pasifika
10%
0%
2009 2010 2011 2012 2013 2014 2015
Source: B4school data base. Health Hawke’s Bay
33Urgent attention is needed to
3.0 HEALTH BEHAVIOURS reduce inequity in this area. Healthy
nutrition needs to be supported
all the way from during pregnancy
though to infants and children.
ORAL HEALTH OF FIVE YEAR OLDS
There has been no improvement in the past five There are significant and widening inequities in
years for any ethnicity and a widening of inequity. children’s oral health. Twice as many Other children
aged five in Hawke’s Bay (70 percent) are caries free
The risk of dental decay begins as soon as the teeth
compared to Māori (36 percent) and Pasifika children
begin to appear in the mouth (at around six months of
(30 percent). There is also a clear socioeconomic
age). Good oral hygiene (regular tooth brushing) and
gradient with children attending decile 9-10 schools
healthy food are both needed to prevent dental decay.
(more advantaged schools) 2.5 times more likely to
The increasing consumption of sugars, and in particular
have no dental caries than children attending decile
sugary drinks, affects the health of teeth as well as
1-2 schools.
contributing to the increasing number of children who
are overweight or obese. Dental decay in five year Urgent attention is needed to reduce inequity in this
olds will have probably started three to four years area. Healthy nutrition needs to be supported all the
previously and may reflect eating patterns which go on way from during pregnancy though to infants and
to become established eating habits later in life. children.
One of the indicators used to assess the oral health of
children is the proportion of children at age five who
are caries free (no sign of dental decay).
HAWKE’S BAY DHB : PERCENT FIVE YEAR OLDS CARIES FREE BY ETHNICITY
80%
70%
60%
50%
%
40%
30%
Māori
20%
Other
Pasifika
10%
Total
0%
2010 2011 2012 2013 2014 2015
Source: HBDHB Oral Health Information System
34 HEALTH EQUITY REPORT 2016PERCENT FIVE YEAR OLDS CARIES FREE - TOTAL BY SCHOOL DECILE
80%
70%
60%
50%
%
40%
30%
2011
20%
2012
2013
10%
2014
2015
0%
1-2 3-4 5-6 7-8 9-10
Source: HBDHB Oral Health Information System
SCHOOL DECILE
This school decile gradient is less for Māori children and may in part reflect the smaller number
of Māori children attending higher decile schools. In 2015 81 percent of Other children in decile
9-10 schools were caries free, compared to 44 percent of Māori children in those schools.
PERCENT FIVE YEAR OLDS CARIES FREE BY ETHNICITY AND SCHOOL DECILE 2015
120% Māori
Other
100% Pasifika
Total
80%
60%
%
40%
20%
0%
1-2 3-4 5-6 7-8 9-10
SCHOOL DECILE
Source: HBDHB Oral Health Information System
35CHAPTER 4.0
HEALTH CARE
The measures in this section look at access
to health care and quality of health care received.
36 HEALTH EQUITY REPORT 2014This indicator is the best evidence yet of equitable access and
treatment for conditions categorised as fully treatable. The
biggest driver of this reduction is the better management of
ischaemic heart disease, diabetes and cancers.
AMENABLE MORTALITY
Amenable deaths (mortality) are a specific group of small and cause the rates to fluctuate.
deaths which could have been avoided through access Never-the-less rates have been reducing and in 2012
to quality health care and is a very useful indicator of rates for Other were 1.5 times higher than non-Māori/
equity in health care. In New Zealand, the proportion non-Pacific people and 1.6 times higher amongst
of all avoidable deaths considered to be amenable is people living in Quintile 5 areas. Pasifika data for
approximately 40 percent. Hawke’s Bay are too small for robust analysis.
In a truly equitable health care system there should be This indicator is the best evidence yet of equitable
no difference in amenable mortality rates by ethnicity access and treatment for conditions categorised as
or by place of residence. fully treatable. The biggest driver of this reduction is
Māori amenable mortality rates have been reducing the better management of ischaemic heart disease,
consistently since 2006 and are now not statistically diabetes and cancers.
different to non- Māori non-Pasifika rates in Hawke’s
Bay as the actual number of deaths each year are
HAWKE’S BAY DHB AGE STANDARDISED AMENABLE MORTALITY RATE PER 100,000 POPULATION BY
ETHNICITY 2006-12
200
Māori
180 Other
160
Age standardised rate per 100,000
140
120
100
80
60
40
20
0
2006 2007 2008 2009 2010 2011 2012
Source: Ministry of Health National Mortality Collection
374.0 HEALTH CARE
HBDHB AGE STANDARDISED AMENDABLE MORTALITY RATE BY QUINTILE PER 100,000 POPULATION 2006-12
140 Quintile 1
Age standardised rate per 100,000 population
Quintile 2
120
Quintie 3
100 Quintile 4
Quintile 5
80
60
40
20
0
2006 2007 2008 2009 2010 2011 2012
Source: Ministry of Health National Mortality Collection
AMBULATORY SENSITIVE
HOSPITALISATIONS 0-4 YEAR OLDS
Ambulatory sensitive hospitalisations (ASH) are mostly New Zealand. Māori rates have been declining since
acute admissions that are considered potentially September 2013 and the gap between Māori and non-
reducible through preventive interventions or Māori rates has been closing. Māori rates of ASH are
treatments deliverable in a primary care setting. They still higher (1.2 times) than non-Māori rates.
are often used as proxy markers for primary care Compared to the rest of New Zealand in the 12 months
access and quality. to September 2015 the Hawke’s Bay Māori rate was
The Ministry of Health ASH definition and 82 percent of the national Māori rate and Hawke’s Bay
methodology has been revised from quarter one of the DHB was the fifth best performer of all DHBs.
15/16 year and data are only available for the 5 years ASH rates for Māori 0-4 year olds have decreased
to end September 2015. for gastroenteritis, dental conditions, cellulitis,
ASH rates for 0-4 year olds in Hawke’s Bay have been upper respiratory infections and ENT conditions.
decreasing and rates are now consistently lower than Gastroenteritis/dehydration admission rates for Māori
ASH RATE HBDHB 0 TO FOUR YEAR OLDS FOR THE FIVE YEARS TO END SEPTEMBER 2015
8,000
ASH Rate per 100,000 domicile population
7,000
6,000
5,000
4,000
3,000
2,000
1,000
0
12 mths to end Sept 2011 12 mths to end Sept 2012 12 mths to end Sept 2013 12 mths to end Sept 2014 12 mths to end Sept 2015
National total Hawke’s Bay Māori Hawke’s Bay total Hawke’s Bay Other Hawke’s Bay Pacific
Source: Ministry of Health
38 HEALTH EQUITY REPORT 2016AMBULATORY SENSITIVE HOSPITALISATION (ZERO TO FOUR YEARS OLD) MĀORI RATE PER 100,000 BY DHB
(12 MONTHS SEPT 2015)
12000
DHBs
10000 National rate
PYLLASR per 100,000
8000
6000
4000
2000
0
Whanganui
Wairarapa
Northland
Auckland
Taranaki
Southern
Nelson Marlborough
West Coast
Counties Manukau
MidCentral
Hawke’s Bay
Waitemata
Canterbury
South Canterbury
Lakes
Waikato
Hutt
Bay of Plenty
Capital and Coast
Source: Ministry of Health Tairawhiti
0-4 year olds in Hawke’s Bay are half the national AMBULATORY SENSITIVE HOSPITALISATIONS 45-
Māori rate. 64 YEARS
However ASH rates have increased for Māori 0-4 year By contrast there has been little change in rates for
olds for asthma, and lower respiratory infections. The 45-64 year olds and Hawke’s Bay rates are similar to
largest equity gap is for dental conditions where NZ. Rates of ASH for Māori remain higher than non-
rates of ASH for Māori 0-4 years olds is three times Māori (two times higher) with little change over this
that of non-Māori 0-4 years olds. period. The disparity between Māori and non-Māori
For some conditions specific programmes are being has closed slightly.
effective at preventing hospitalisations for example ASH rates for 45-64 year olds have increased for
the infant rotavirus vaccination programme prevents cellulitis and congestive heart failure.
hospitalisations with gastroenteritis, skin care Heart disease, skin infections, and respiratory
programmes in Kohanga Reo, the healthy housing infections all feature highly as causes of the disparity
programme and free primary care visits ensure that in ASH rates for 45-64 year olds. Much more needs to
conditions are managed earlier and better. Asthma be done to improve access and treatment for Māori
and dental conditions remain significant areas of adults with these conditions.
inequity for Māori 0-4 year olds.
ASH RATE, HAWKE’S BAY DHB, 45 TO 64 YEAR OLDS, FIVE YEARS TO END SEPTEMBER 2015
8,000
ASH Rate per 100,000 domicile population
7,000
6,000
5,000
4,000
3,000
2,000
1,000
0
12 mths to end Sept 2011 12 mths to end Sept 2012 12 mths to end Sept 2013 12 mths to end Sept 2014 12 mths to end Sept 2015
National total Hawke’s Bay Māori Hawke’s Bay total Hawke’s Bay Other Hawke’s Bay Pacific
Source: Ministry of Health 39You can also read