Northern California Multifamily Market Report - Winter 2021| Regional Market Report - Colliers
←
→
Page content transcription
If your browser does not render page correctly, please read the page content below

Northern California
Multifamily Market Report

Winter 2021| Regional Market Report

Northern California Multifamily Market Report | Winter 2021   1

Table of Contents

       Introduction........................................................................................... 3

       Regional Summary................................................................................ 4

       Regional Rent & Occupancy................................................................. 5

       Regional Construction.......................................................................... 7

       Regional Supply/Demand.................................................................... 8

       Regional Sales Activity.......................................................................... 9

       Institutional Equity Sales.................................................................... 10

       Regional Employment........................................................................ 12

       Regional Population & Migration...................................................... 13

       San Francisco Market......................................................................... 14

       San Francisco Peninsula Market....................................................... 16

       Silicon Valley Market........................................................................... 18

       East Bay Market.................................................................................. 20

       North Bay Market............................................................................... 22

       Stockton/Modesto Market................................................................. 24

       Sacramento Market............................................................................ 26

       Regional Market Statistics.................................................................. 28

       Colliers Northwest Regional Contacts & Offices............................. 30

Northern California Multifamily Market Report | Winter 2021                                                        2
Introduction

The way we live and work continues to be transformed as we are now a full year into the COVID-19 pandemic. With the
untethering of the white collar worker from the office, a reshuffling of populations is underway. The trends that began in
the first half of 2020 were greatly accelerated in the final six months of the year. While rents and occupancy rates declined
dramatically in San Francisco and throughout most of the Bay Area’s urban submarkets, rents and occupancy continued
to rise in both Sacramento and Stockton/Modesto. Households are migrating away from dense urban areas to more spa-
cious and less densely populated markets. As we will outline later on in this report, investors are starting to follow this flow
of households.

In the second edition of this biannual regional market report, we provide a comprehensive outlook of the Northern Cal-
ifornia multifamily market’s rapidly shifting fundamentals. We will cover seven separate markets in Northern California,
including San Francisco, San Francisco Peninsula, Silicon Valley, East Bay, North Bay, Stockton/Modesto, and Sacramento.
We will compare and contrast market trends through year-end 2020 and provide a clear-eyed perspective on each of
these markets while compiling an overall Northern California regional market out of these seven markets. Statistical trends
on rents, occupancy, demand, supply, construction, sales pricing, sales volume, cap rates, demographics, employment,
and population are discussed at both a regional and market-level. This report analyzes current market conditions to assist
landlords, investors, and developers in making intelligent decisions in a quickly changing marketplace. This regional market
report encapsulates statistics on more than 894,000 market-rate apartment units across Northern California to provide
an objective outlook for readers to make knowledgeable business decisions. If you have any additional questions on any
of the content in this report or would like to connect with a multifamily broker in one of these markets, please contact one
of our managing directors or research managers listed at the end of the report.

Northern California Multifamily Market Report | Winter 2021                                                                   3

Northern California Regional Summary

A great migration is underway. The COVID-induced recession has impacted urban submarkets across the country as
nearly half of the U.S. workforce continues to work from home. While there are no indications that this will be a permanent
population shift, the statistics tell the story of 2020 and what is likely to come in 2021. Lower-density and less-expensive
markets have held up quite well in 2020 while urban gateway markets have been hit especially hard. Suburban submarkets
will lead the multifamily sector’s recovery into 2021 while urban submarkets will lag until employees return to their offices,
concerts and sporting events come back to the urban core, and bars and restaurants are fully reopened. While rents and
sale prices rose in Sacramento, Stockton/Modesto, and some of the outlying Bay Area submarkets, the urban markets of
San Francisco and Silicon Valley posted double digit annual rent decreases and significant occupancy losses in 2020.

The rise of remote work has resulted in a monumental shift in population and investors are starting to follow. Just before
the pandemic started, domestic migration hit a 73-year low with just 9.3 percent of U.S. households changing residences
from March 2019 to March 2020. But with remote work becoming the rule as opposed to the exception over the last twelve
months, migration has spiked dramatically. According to The NPD Group, some 28 percent of Americans have considered
relocating during the pandemic, a 20 percent increase year-over-year. The outflow of renters from San Francisco over
the last year is undeniable as professional workers no longer need to live in high-priced urban areas close to Downtown
San Francisco or Silicon Valley. As a result, investors are starting to shift their focus to secondary suburban markets. In
Northern California, five of the top thirteen largest multifamily sale transactions closed in the second half of 2020 occurred
in the Sacramento market.

Nevertheless, the multifamily sector still faces significant headwinds in early 2021. While the new stimulus checks and
rental assistance passed at the end of 2020 will help renters in a deep financial hole, more than one-third of U.S. adults are
still struggling to pay basic household expenses, according to the U.S. Census Bureau. One analysis by Moody’s Analytics
stated that nearly 12 million U.S. renters owe an average of $6,000 in late rent or utility payments as of January 2021.
Residential evictions continue to be postposed as the Newsom administration extended California’s eviction moratorium
through the end of June 2021.

Concerns over the multifamily sector’s demise as a coveted asset class in 2020 were overblown. Though rent collections
are down slightly over the last year, they are still above 92 percent. Apartment properties continue to claim the most
investment sales volume behind only industrial in 2020. While multifamily is undergoing significant disruption, there are
still opportunities for investors and developers, if you know where to look.

Northern California Multifamily Market Report | Winter 2021                                                                 4

Regional Rent & Occupancy
The Northern California multifamily market continues to track with ongoing population shifts throughout the region. While
market fundamentals differ greatly, the occupancy losses and rent decreases across the Bay Area have greatly impacted
the overall region. The regional occupancy rate declined 190 basis points year-over-year to 94.4 percent by year-end
2020. Occupancy rates remain the highest in Stockton/Modesto (99.0%) and Sacramento (97.1%) while San Francisco’s
occupancy dropped to 90.3 percent, its lowest rate in 20 years. The regional average effective monthly rent dropped 9.0
percent year-over-year to $2,425 and is down nearly 10 percent from $2,692 set at the end of Q1 2020. The regional
market has seen effective rent declines of 2 percent to 4 percent per quarter from Q2 2020 to Q4 2020. Effective rents
are still the highest in San Francisco ($2,786) and San Francisco Peninsula ($2,726), but landlords have been slashing rents
and increasing concessions across the Bay Area over the last year.

Northern California Multifamily                                                                                  Northern   California
                                                                                                                  Northern California    Multifamily
                                                                                                                                      Multifamily
Q4Northern California
   2020 Monthly       Multifamily
                 Effective Rents by Market                                                                       Q4Q42020
                                                                                                                      2020 Occupancy  Rate
                                                                                                                           Occupancy Rate by by Market
                                                                                                                                             Market
  Q4 2020 Monthly Effective Rents by Market

                                                                                                                         Stockton/Modesto                                                                       99.0%
                San Francisco                                                               $2,786

 San Francisco Peninsula                                                                   $2,726
                                                                                                                                  Sacramento                                                           97.1%

                  Silicon Valley                                                     $2,480                                          North Bay                                                        96.5%

                        East Bay                                                  $2,341                                               East Bay                                              94.7%

                      North Bay                                                 $2,196                                           Silicon Valley                                        93.8%

                   Sacramento                                        $1,619
                                                                                                                  San Francisco Peninsula                                             93.6%
         Stockton/Modesto                                     $1,383
                                                                                                                                San Francisco                        90.3%
                                       $0           $500   $1,000      $1,500    $2,000    $2,500       $3,000
                                                                                                                                                   86.0%      88.0%       90.0%      92.0%    94.0%     96.0%   98.0%     100.0%
Source: Colliers Northwest Research & RealPage, Inc.
  Source: Colliers Northwest Research & RealPage, Inc.                                                            Source: Colliers Northwest Research & RealPage, Inc.
                                                                                                                   Source: Colliers Northwest Research & RealPage, Inc.

Northern California Multifamily
  Northern California Multifamily
Regional Effective Monthly Rent & Overall Occupancy Rate - Q4 2015 to Q4 2020
  Regional Effective Monthly Rent & Overall Occupancy Rate - Q4 2015 to Q4 2020

                                                                                   Regional Effective Rent                  Regional Occupancy Rate

    $2,800                                                                                                                                                                                                                 97.0%

    $2,600                                                                                                                                                                                                                 96.5%

    $2,400                                                                                                                                                                                                                 96.0%

    $2,200                                                                                                                                                                                                                 95.5%

    $2,000                                                                                                                                                                                                                 95.0%

    $1,800                                                                                                                                                                                                                 94.5%

    $1,600                                                                                                                                                                                                                 94.0%
                Q4 2015                                    Q4 2016                            Q4 2017                          Q4 2018                                     Q4 2019                              Q4 2020

Source: Colliers Northwest Research & RealPage, Inc.
  Source: Colliers Northwest Research & RealPage, Inc.

Northern California Multifamily Market Report | Winter 2021                                                                                                                                                                    5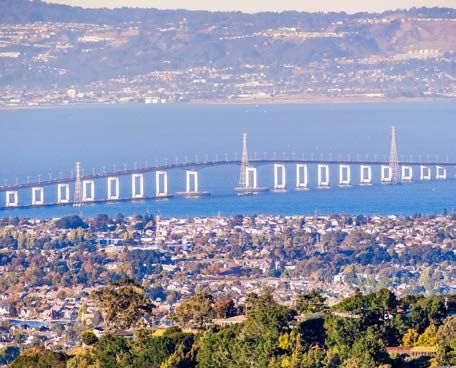
Regional Rent & Occupancy
Effective rents have declined dramatically over the last year in the Bay Area, led by San Francisco (-20.8%) and San
Francisco Peninsula (-15.5%). Rents in Stockton/Modesto increased 7.6 percent year-over-year and Sacramento’s
rents increased 5.7 percent. All Bay Area markets, except for North Bay, posted occupancy losses in 2020, led by San
Francisco (-5.9%) and Silicon Valley (-2.4%). Stockton/Modesto led all Northern California markets in occupancy gains
in 2020, increasing 1.5 percentage points to 99 percent occupancy. As the remote work revolution continues into
2021, expect continuing market disruption in the Bay Area with Central Valley markets continuing to see improving
fundamentals. Six of the top ten annual rent growth submarkets were in Sacramento, led by Roseville/Rocklin (+10.0%).
Rents dropped most dramatically in Downtown San Francisco (-25.4%) and SoMa (-22.4%). With students absent from
the UC Davis campus, the Davis submarket in Sacramento recorded the largest annual occupancy decrease, down 7.2
percent, followed by West San Francisco (-6.5%) and Downtown San Francisco (-6.3%).
Northern California Multifamily Northern California Multifamily
Northern California Multifamily
2020 Annual Effective Rent Change by Market
Northern California Multifamily
2020 Annual Occupancy Rate Change by Market
2020 Annual Occupancy Rate Change by Market
2020 Annual Effective Rent Change by Market
2.0% 1.5%
10.0%
7.6%
5.7% 1.0% 0.6%
0.3%
5.0%
0.0%
0.0%
-1.0%
-1.2%
-5.0% -2.0%
-1.4%
-2.0%
-3.0%
-2.4%
-10.0% -8.0%
-4.0%
-15.0%
-14.3%
-15.5%
-5.0%
-20.0%
-20.8% -6.0%
-25.0% -5.9%
San Francisco San Francisco Silicon Valley East Bay North Bay Sacramento Stockton/Modesto -7.0%
Peninsula San Francisco Silicon Valley San Francisco East Bay North Bay Sacramento Stockton/Modesto
Peninsula
Source: Colliers Northwest Research & RealPage, Inc. Source: Colliers Northwest Research & RealPage, Inc.
Source: Colliers Northwest Research & RealPage, Inc.
Source: Colliers Northwest Research & RealPage, Inc.
Northern
NorthernCalifornia Multifamily
California Multifamily Northern California Multifamily
Northern California Multifamily
AnnualAnnual
Occupancy Changes by Submarket - Largest Increases & Decreases
Occupancy Changes by Submarket - Largest Increases & Decreases
Annual Effective Rent Changes by Submarket - Largest Increases & Decreases
Annual Effective Rent Changes by Submarket - Largest Increases & Decreases
Davis -7.2% Downtown San Francisco -25.4%
SoMa -22.4%
West San Francisco -6.5%
North Sunnyvale -18.8%
Downtown San Francisco -6.3%
South Sunnyvale/Cupertino -18.6%
Mountain View/Palo Alto/Los Altos -5.2% North San Mateo County -17.5%
SoMa -4.6% Mountain View/Palo Alto/Los Altos -16.1%
North Sunnyvale -3.8% Central San Mateo County -15.7%
South San Mateo County -15.5%
Oakland/Berkeley -3.1%
Santa Clara -14.7%
South Sunnyvale/Cupertino -2.3%
North San Jose/Milpitas -14.3%
West San Jose/Campbell -2.1% Oakland/Berkeley -13.5%
Central Sacramento -1.5% West San Jose/Campbell -13.1%
Vacaville 1.2% Vallejo/Fairfield 3.3%
Vacaville 4.4%
Modesto 1.2%
Modesto 6.2%
Vallejo/Fairfield 1.7%
Folsom/Orangevale/Fair Oaks 6.8%
Folsom/Orangevale/Fair Oaks 1.8% South Sacramento 6.9%
West Stockton 1.8% Rancho Cordova 7.6%
Citrus Heights 1.9% North Sacramento/North Highlands 7.9%
Natomas 8.1%
Carmichael 1.9%
Citrus Heights 8.2%
East Stockton 1.9%
Turlock/Ceres 8.3%
Roseville/Rocklin 2.0% Woodland/West Sacramento 8.9%
Northeast Contra Costa County 2.4% Roseville/Rocklin 10.0%
-8.0% -6.0% -4.0% -2.0% 0.0% 2.0% -30.0% -25.0% -20.0% -15.0% -10.0% -5.0% 0.0% 5.0% 10.0%
Source: Colliers Northwest Research & RealPage, Inc. Source: Colliers Northwest Research & RealPage, Inc.
Source: Colliers Northwest Research & RealPage, Inc.
Source: Colliers Northwest Research & RealPage, Inc.
Northern California Multifamily Market Report | Winter 2021 6
Regional Construction
Despite a slowdown and stoppage of construction in some markets since the start of the pandemic, apartment
development remains quite active across the Northern California region. There were approximately 33,000 units under
construction as of year-end 2020. Silicon Valley leads the way in both units under construction (10,589) and percentage
of construction compared to current inventory (6.0%). The East Bay is seeing significant development activity as well with
10,563 units under construction across 52 projects, 33 of which are located in Oakland/Berkeley. Regional deliveries
have accelerated over the last two years. Some 16,454 units delivered from 2018 to 2019, however, from 2020 to
2021, there are some 33,453 units projected to deliver. As the pandemic has hit urban submarkets the hardest, it is
likely some developers will pause on new construction starts until the market shows signs of recovery. Landlords with
new units in urban submarkets have been increasing concessions substantially to assist in sluggish lease-up rates.
Development activity in Central Sacramento, however, continues to spike to meet rising renter demand with more than
2,000 units under construction (12% of existing inventory). Northern California’s new apartment deliveries are projected
to peak at 5,807 units in Q2 2021 then will decline slightly to 5,007 units delivering in Q3 2021. Nearly two-thirds of the
10,800 units delivering from April 2021 through September 2021 will be in Silicon Valley or the East Bay.

    Northern California Multifamily
Northern California Multifamily
Quarterly Projected
      Quarterly         Delivery
                Projected          Schedule
                          Delivery Schedule    by Market
                                            by Market       - Q1
                                                      - Q1 2018    2018
                                                                to Q4 2022to Q4 2022

                                                                San Francisco              San Francisco Peninsula        Silicon Valley          East Bay             North Bay     Stockton/Modesto           Sacramento

                                   7,000

                                   6,000

                                   5,000
      Units Delivered

                                   4,000

                                   3,000

                                   2,000

                                   1,000

                                         0
                                              Q1 2018                                      Q1 2019                           Q1 2020                               Q1 2021                       Q1 2022

Source: Colliers Northwest Research & RealPage, Inc.
                 Source: Colliers Northwest Research & Real Page, Inc.

Northern  California
     Northern             Multifamily
              California Multifamily
Total Units
       Total Under   Construction
             Units Under Construction & & Percentage
                                        Percentage        of Construction
                                                   of Consturction                of Existing
                                                                   of Existing Inventory       Inventory by Market
                                                                                         by Market

                        12,000                    6.0%                                                                                                                                                                       6.0%

                        10,000                  10,589                           4.9%                                                                                                                                        5.0%

                                                                                10,563
                          8,000                                                                                                                                                                                              4.0%

                          6,000
                                                                                                                                                               3.2%                                                          3.0%
                                                                                                             2.8%
                                                                                                                                     2.4%
                          4,000                                                                             4,645                                                                                                            2.0%

                                                                                                                                     3,737                                                                   1.4%
                          2,000                                                                                                                                                     1.1%                                     1.0%
                                                                                                                                                               1,983
                               0
                                                                                                                                                                                     799                     638             0.0%
                                              Silicon Valley                    East Bay                 San Francisco            Sacramento           San Francisco Peninsula     North Bay            Stockton/Modesto

                                                                                                          Units Under Construction             % of Existing Inventory
Source: Colliers Northwest Research & RealPage, Inc.
                        Source: Colliers Northwest Research & RealPage, Inc.

Northern California Multifamily Market Report | Winter 2021                                                                                                                                                                         7
Regional Supply/Demand
The pandemic-induced recession has wreaked havoc across multifamily market fundamentals across the region,
reversing the trend of excess demand from recent years. There was a glut of new supply that hit the market in 2020
during an unprecedented period of depressed demand. More than 14,000 units delivered across the region in 2020
compared to -4,000 units of demand (net number of units occupied). The annual drop in demand was massive in
San Francisco, which recorded -8,136 units of demand compared to nearly 2,000 new units being delivered. Demand
was also negative in the San Francisco Peninsula (-872) and Silicon Valley (-237). There was positive annual demand
in the remaining four markets, led by Sacramento (2,540 units) and the East Bay (972 units). Silicon Valley’s inventory
expanded by 4,344 units in 2020 and the East Bay was not far behind with 4,262 units delivered. Sacramento led the
way in net demand compared to new supply delivered in 2020 with 752 more units absorbed than delivered, followed
by Stockton/Modesto at 708 units.

Northern  California
     Northern            Multifamily
              California Multifamily

2020 Annual  Supply
      2020 Annual    (Delivered
                  Supply            Units)
                         (Delivered Units) vs.vs. Annual
                                               Annual     Demand
                                                      Demand          (Units Absorbed)
                                                             (Units Absorbed)

                     6,000
                                                                                                              4,344                  4,262
                     4,000
                                                                                                                                                                                        2,540
                                                    1,973                                                                                                                                          1,788
                     2,000                                                                                                   972                               980    944
                                                                                   445                                                                739
                                                                                                                                                                                236
                          0
                                                                                                   -237
                    -2,000                                              -872

                    -4,000

                    -6,000

                    -8,000
                                     -8,136
                   -10,000
                                        San Francisco                San Francisco Peninsula        Silicon Valley             East Bay                North Bay     Stockton/Modesto     Sacramento

                                                                                                          Annual Demand               Annual Supply
Source: Colliers Northwest Research & RealPage, Inc.
            Source: Colliers Northwest Research & RealPage, Inc.

Northern   California
 Northern California     Multifamily
                     Multifamily
Projected   UnitsDelivering
  Projected Units Delivering    in 2021
                            in 2021

                          East Bay                                                                                                                                                         6,981

                   Silicon Valley                                                                                                                                    5,617

                  San Francisco                                                                                      2,804

    San Francisco Peninsula                                                              1,663

                    Sacramento                                                 1,214

           Stockton/Modesto                                    638

                       North Bay                           508

                                         0                         1,000                   2,000                     3,000            4,000                 5,000       6,000           7,000              8,000

Source:
  Source:Colliers   Northwest
          Colliers Northwest       Research
                             Research & RealPage,&Inc.
                                                    RealPage, Inc.

Northern California Multifamily Market Report | Winter 2021                                                                                                                                                        8
Regional Sales Activity
Multifamily continues to be one of the top asset classes for investors. Apartment properties have proven to be a
largely pandemic-proof property sector. After a substantial slowdown in transaction activity in the second and third
quarters of 2020, multifamily sales activity finished the year on a high note. Annual price growth for U.S. apartment
sales in December 2020 recorded an 8.3 percent increase, up from 7.6 percent in November, according to Real Capital
Analytics. U.S. annual apartment sales posted year-over-year volume growth in December 2020 as well. U.S. apartment
sales volume declined 28 percent year-over-year in 2020, which was the lowest annual drop in volume of all asset
classes besides industrial (-16%). Northern California’s apartment sales volume of $7.27 billion in 2020 declined 31
percent year-over-year with approximately half as many sales transactions during the year compared to 2019. Prices
fell off as well, registering a 9.1 percent decrease in the annual average price per unit for all sales across Northern
California. Average regional cap rates held firm year-over-year at 4.9 percent. Annual sales volume in 2020 dropped
most dramatically in San Francisco (-56.7% year-over-year) and the Peninsula (-50.2%). The North Bay was the only
market to realize year-over-year gains in sales volume with its $1.01 billion in sales a 14.9 percent increase from 2019.
The average price per unit declined the most in Silicon Valley (-13.6%) and the East Bay (-10.8%) while the North Bay
(56.4%) and Sacramento (24.3%) led in annual price gains.
Northern
   NorthernCalifornia    Multifamily
            California Multifamily

Northern  California
     Northern CaliforniaTotal  Annual
                         Total Annual    Sales
                                      Sales     Volume
                                            Volume      & Number
                                                   & Number            of Transactions
                                                            of Transactions - 2011 to 2020 - 2011 to 2020

      $11,000,000,000                                                                                                                                                                              2,500

      $10,000,000,000

       $9,000,000,000                                                                                                                                                                              2,000
       $8,000,000,000

       $7,000,000,000
                                                                                                                                                                                                   1,500
       $6,000,000,000

       $5,000,000,000
                                                                                                                                                                                                   1,000
       $4,000,000,000

       $3,000,000,000

       $2,000,000,000                                                                                                                                                                              500

       $1,000,000,000

                     $0                                                                                                                                                                            0
                                   2011                  2012                 2013            2014          2015         2016            2017            2018             2019            2020

                                                                             Regional Annual Sales Volume               Regional Annual Number of Transactions

Source:Source:
        Colliers     Northwest
               Colliers              Research,
                        Northwest Research,          CoStar,
                                            CoStar, Real          Real Capital Analytics.
                                                         Capital Analytics

                                                                                 Northern California Multifamly Sales Activity
                                                        2020 Annual Sales                   Year-Over-Year         2020 Average        Year-Over-Year            Average         Units       Number of
                    Market
                                                                 Volume                     Volume Change          Price per Unit       Price Change             Cap Rate        Sold       Transactions
                San Francisco                                    $776.58M                       -56.7%                $470,942                  -9.1%              4.0%          1,649           124
         San Francisco Peninsula                                 $719.28M                       -50.2%                $483,919                  -1.2%              4.0%          1,627           45
                 Silicon Valley                                    $1.22B                       -36.9%                $385,730                  -13.6%             4.4%          2,788           76
                     East Bay                                      $1.76B                       -39.2%                $313,321                  -10.8%             5.2%          5,604           213
                   North Bay                                       $1.01B                       14.9%                 $341,661                  56.4%              4.9%          3,514           75
             Stockton/Modesto                                    $227.45M                       -38.4%                $121,892                  5.8%               6.3%          1,596           72
                  Sacramento                                       $1.18B                       -11.3%                $208,017                  24.3%              5.5%          5,691           107

   Northern California Region                                     $7.27B                        -31.2%               $296,121                   -9.1%             4.9%           22,469          712

Northern California Multifamily Market Report | Winter 2021                                                                                                                                                9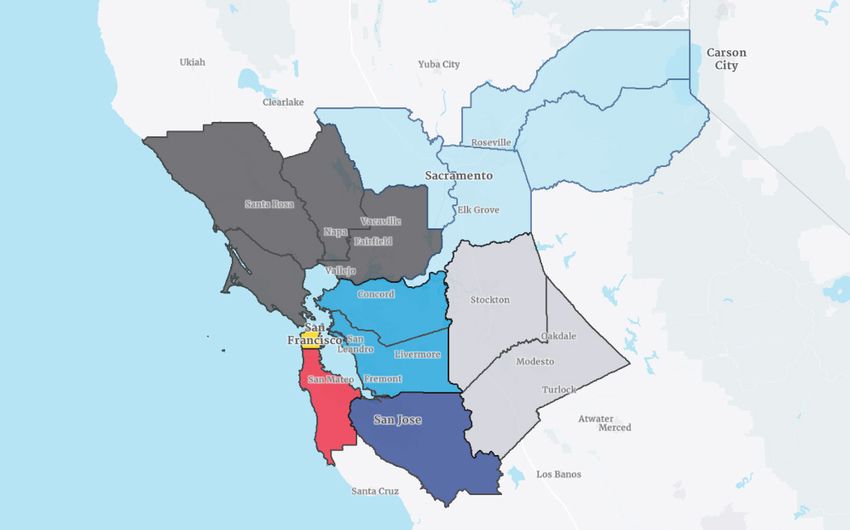
Institutional Equity Sales
                                                                      Top Northern California Institutional Multifamily Sales - Second Half 2020
                                                                                                      Vacancy at
  Map #        Property Name, Market Location                  Sale Price      Price Per Unit                       Units            Year Built                    Buyer                                     Seller
                                                                                                            Sale
     1       The Press at Midtown Quarter, Sacramento            $118M             $425,992                 70.0%    277               2020               Oakmont Properties             SKK Development & DeBartolo Development
     2                 View at Marin, North Bay                  $106M             $417,322                 7.5%     254               1973             Pacific Urban Residential                   AvalonBay Communities
     3            Ascent at the Galleria, Sacramento              $95M             $347,985                 2.6%     273               2002                Davlyn Investments                        JRK Property Holdings
     4                     Alira, Sacramento                     $92.3M            $315,017                 22.9%    293               2020               Oakmont Properties                        A.G. Spanos Companies
     5         Meadowood Apartments, Silicon Valley *             $81M             $698,275                 19.8%    116               1971            Summer Hill Housing Group                     Calson Properties Inc.
     6       Mode Apartments, San Francisco Peninsula           $80.05M            $721,171                 18.0%    111               2014                Sares-Regis Group                         Land and Houses USA
     7           Delphine on Diamond, San Francisco              $72.5M            $470,779                 10.4%    154               1972               Waterton Associates                       AvalonBay Communities
     8         Redwood Gardens Apartments, East Bay              $72.1M            $426,627                 1.2%     169               1960       Foundation Housing & Pennant Housing        CSI Support & Development Services
     9              Larkspur Woods, Sacramento                    $71M             $306,034                 2.2%     232               1995                    Sequoia Equities                           CalFox, Inc.
    10          Glenmoor Green Apartments, East Bay              $58.5M            $390,000                 10.0%    150               1970                     Prime Group                          Glenmoor Realty, Inc.
    11                    Rica Vista, East Bay                  $58.25M            $313,172                 9.7%     186               1965              Lincoln Avenue Capital                     Pacific Urban Residential
    12              The Landmark, Silicon Valley *                $58M             $446,153                 32.3%    130               1974            Summer Hill Housing Group                    Pacific Urban Residential
    13              Avion Apartments, Sacramento                 $54.5M            $262,019                 6.7%     208               2006             Jackson Square Properties            Benedict Canyon Equities & LEM Capital
* Sold for land value, buyer intends to demolish existing apartments and build new for-sale townhomes

NorthernNorthern
         California      Multifamily
                 California Multifamily                                                                                                           REGIONAL MARKET SALES ACTIVITY GRAPH --->
                  Top Ten Institutional Owners by Total Units
Top Ten Institutional Owners by Total Units

                                               Essex Property Trust                                                                                                                           22,587
                                        Avalon Bay Communities                                                                       12,535
                                                 Equity Residential                                                           11,431
                                               The Irvine Company                                                    10,270
                                  Prometheus Real Estate Group                                                      9,655
               The Ezralow Company/First Pointe Management                                     5,260
                                             USA Properties Fund                               5,258
                                                  Sequoia Equities                            5,053
                                      Gerson Bakar & Associates                               4,942
                                       The Sobrato Organization                             4,783

                                                                      0                             5,000                   10,000                    15,000                        20,000                         25,000

Source: ColliersSource:
                  Northwest          Research & CoStar
                        Colliers Northwest Research & CoStar
                Note: Institutional market is defined as apartments with 100 units or more
Note: Institutional market is defined as apartments with 100 units or more

Northern California Multifamily Market Report | Winter 2021                                                                                                                                                                           10
Institutional Equity Sales
Institutional multifamily sales in 2020 slowed substantially as a result of the pandemic, creating an air of uncertainty
throughout much of the year. Total institutional multifamily sales volume declined dramatically during the second and
third quarters, only to be saved by a robust fourth quarter that put total volume well above 2017 and 2018 totals. After
2019’s massive $5.0 billion in institutional multifamily sales volume, 2020 ended with about $3.2 billion in total deal
volume. Cap rates for institutional sales remained relatively unchanged, buoyed by plunging interest rates. Many sales
were stalled or cancelled due to ongoing market uncertainty over the last year. Low interest rates have helped uphold
property values while also allowing some risk-tolerant investors to lock in 10-year fixed debt close to 2.5 percent.
Market rents have been heavily impacted by rent declines in the urban core submarkets of San Francisco, Oakland, and
San Jose, which have subsequently driven rent growth in many suburban and semi-rural areas of Northern California.
Concessions remain high in most of the Bay Area with new properties in lease-up averaging three months of free rent.
As of early March 2021, vaccinations far outpace new reported COVID-19 infections at a rate of nearly 40 to 1, so we are
optimistic that we will see new signs of life in the urban core by as soon as summer 2021.
Northern California Multifamily
Institutional EquityMultifamily
Northern California Sales (100+ Units) vs. Private Equity Sales (5-99 Units)
Average
InstitutionalPrice per(100+
Equity Sales UnitUnits)
Comparison - Sales
vs. Private Equity Q1 2016 to Q4 2020
(5-99 Units)
Average Price per Unit Comparison - Q1 2016 to Q4 2020
$450,000
$428,350
$394,335
$400,000
$350,000
$318,043 $316,313
$303,617
$300,000
$287,454
$251,011
$250,000
$228,677
$244,181
$227,699
$200,000
Q1 2016 Q2 2016 Q3 2016 Q4 2016 Q1 2017 Q2 2017 Q3 2017 Q4 2017 Q1 2018 Q2 2018 Q3 2018 Q4 2018 Q1 2019 Q2 2019 Q3 2019 Q4 2019 Q1 2020 Q2 2020 Q3 2020 Q4 2020
Institutional Equity Sales - Avg. Price/Unit Private Equity - Avg. Price/Unit
Source: Colliers
Source: Colliers Northwest
Northwest Research,
Research, Real Capital Analytics Real Capital Analytics.
Northern California Multifamily
Northern California Multifamily
Institutional Equity Sales (100+ Units) vs. Private Equity Sales (5-99 Units)
Institutional Equity Sales (100+ Units) vs. Private Equity Sales (5-99 Units)
Average Cap Rate Comparison - Q1 2016 to Q4 2020
Average Cap Rate Comparison - Q1 2016 to Q4 2020
6.0%
5.4% 5.4%
5.3%
5.2% 5.1%
5.1%
5.0% 4.9% 4.9% 4.9%
4.9%
4.7%
4.6% 4.8%
4.5% 4.5%
4.4%
4.0%
Q1 2016 Q2 2016 Q3 2016 Q4 2016 Q1 2017 Q2 2017 Q3 2017 Q4 2017 Q1 2018 Q2 2018 Q3 2018 Q4 2018 Q1 2019 Q2 2019 Q3 2019 Q4 2019 Q1 2020 Q2 2020 Q3 2020 Q4 2020
Institutional Equity Sales - Avg. Cap Rate Private Equity - Avg. Cap Rate
Source: Colliers
Source: Colliers Northwest
Northwest Research,
Research, Real Capital Analytics Real Capital Analytics.
Northern California Multifamily Market Report | Winter 2021 11Regional Employment
Northern California’s job market was adversely impacted over the course of 2020, but the Bay Area remains the global
center for technology and innovation. Total employment across the region declined by 7.5 percent year-over-year to 5.35
million jobs by year-end 2020, equating to 431,214 less jobs at year-end 2020 compared to year-end 2019. Job losses
were more severe locally than nationally as U.S. employment declined 6.1 percent in 2020. San Francisco posted the
largest annual job loss with an 8.5 percent annual
decrease in employment in 2020, followed by the
Northern California Employment
San Francisco Peninsula (-8.3%) and the East Bay Annual Total Nonfarm Employment Change by Market - December 2019 to December 2020
(-8.1%). The Bay Area’s nine counties combined 0.0%
lost more than 326,000 jobs year-over-year -1.0%
(-7.7%). Stockton/Modesto (-6.4%), Silicon Valley
-2.0%
-3.0%
(-6.9%) and Sacramento (-6.9%) saw less dramatic -4.0%
annual drops in employment. Some 1.4 million
-5.0%
-6.0%
Californians lost their jobs in 2020. Hundreds of -7.0%
-7.4%
-6.9% -6.9%
-6.4%
-8.0%
thousands remain without work and a majority -9.0% -8.5% -8.3%
-8.1%
of those affected were in lower wage industries -10.0%
San Francisco San Francisco East Bay North Bay Sacramento Silicon Valley Stockton/Modesto
Peninsula
like Hospitality, Entertainment, and Restaurants.
The unemployment rate today is roughly twice Source: U.S. Bureau of Labor Statistics
as high as it was pre-pandemic, however, for
employees making over $60,000 per year, unemployment is actually lower. The amount of remote job postings is up
dramatically and the war for talent has gone global as work can now be done from anywhere.
The pandemic has upended the typical office job and many large technology firms have indicated a willingness to have its
employees continue to work from home in the future. In early February 2021, Salesforce, San Francisco’s largest private
sector office tenant, announced that most of its employees will be in the office just one to three days a week. Pinterest
paid $90 million to back out of a planned San Francisco headquarters building last August. Dropbox announced a
virtual-first work model last October. Twitter and Facebook have also made remote work a permanent component of
their workforce strategy last year. That all being said, Silicon Valley’s tech giants Google, Apple, Facebook, and Amazon
have not been giving back office space in the region, are still growing, and are largely committed to returning many of
its employees to the office by Q3 2021. Though the long term effects of this dramatic workplace shift remain to be seen,
remote work is undoubtedly here to stay in one form or another, which will continue to affect the residential sector in
the years ahead.
» 41.8% of the American workforce was still working remotely at year-end 2020 with 26.7% estimated
to continue working from home through 2021 and a projected 22% of the U.S. workforce working
remotely full-time by 2025
◊ Source: Upwork’s December 2020 Future Workforce Pulse Report
As many employees no longer have to live near the corporate headquarters in the Bay Area, thousands have decided
to pack up and move elsewhere while keeping their current position and salary. Affordable housing, access to outdoor
activities, and more spacious living conditions while working from home have been among the top motivating factors for
this migration of the highly educated professional workforce across Northern California. As the vaccines work through
the population, expect economic normalcy to return by mid-2021.
Northern California Multifamily Market Report | Winter 2021 12Regional Population & Migration
The COVID-19 pandemic and the untethering of the white collar worker from the office has accelerated migration
activity nationwide in 2020. Preliminary migration statistics and population data point to an ongoing flight to lower cost
inland markets and away from high cost coastal cities. While it remains to be seen if this is a permanent or temporary
population shift, the accelerating migration of households out of high cost markets and into affordable secondary
markets is showing no signs of slowing down in early 2021.
» 7% to 11% of workers nationwide (up to 23 million people) are expected to move outside of their
county or state. US migration is expected to increase by three to four times the standard rate. Out
of the 20,000 people surveyed nationwide, more than half said they were looking for a lower cost
of living and about half said they were moving more than four hours away.
◊ Source: Upwork
» While California ranked #50 nationally in 2020 migration growth, Sacramento came in at the #11
growth market in the country. The entire Bay Area saw a 31% drop year-over-year in net arrivals
from March to December 2020 and Bay Area departures accounted for 58% of all one-way U-Haul
traffic from March through June 2020. The top destination cities for U-Haul customers leaving the
Bay Area were Sacramento, San Diego, Stockton, Reno, and Las Vegas.
◊ Source: U-Haul
» No state lost more residents from July 2018 to July 2019 than California with 653,551 Californians
relocating elsewhere, which translates to 1.7% of the Golden State’s population. Texas welcomed
the most California transplants with 82,235 moving to the Lone Star state in 2019 but Nevada
welcomed the most residents from California per capita with 1,552 of every 100,000 Nevadans
relocating from California.
◊ Source: U.S. Census Bureau
» Sacramento was the most popular destination in the country for prospective homebuyers in
October 2020 with 50% of home searches from users outside the metro area, a 75% increase year-
over-year. More than 72% of prospective homebuyers searching in Sacramento were based in the
Bay Area. San Francisco’s housing inventory was up 96% year-over-year as of August 2020 and
asking prices dropped by 5% annually.
◊ Source: Redfin & Zillow
NorthernNorthern
California Population
California Population
Annual TotalAnnual
Population Change
Total Population by Market
Change by Market (July
(July 2018 to 2018
July 2019 Officialto July 2019 Official Statistics)
Statistics)
1.00% 0.94% 0.93%
0.80%
0.60%
0.40%
0.27%
0.20%
0.10%
0.00%
-0.20%
-0.25% -0.27%
-0.40% -0.32%
Stockton/Modesto Sacramento East Bay San Francisco Silicon Valley San Francisco Peninsula North Bay
Source: U.S. Census Bureau
Source: U.S. Census Bureau
Northern California Multifamily Market Report | Winter 2021 13San Francisco
San Francisco sees substantial drops in rents and
occupancy translating to a sizable decrease in sales
activity during the year
The effects of the pandemic can be seen with year-over-year
average effective rents dropping by more than 20 percent. This
shift in asking rents is not surprising considering that San Francisco
had some of the highest rents in North America prior to COVID-19.
In addition to softening rents, demand in The City has waned as a
result of the work-from-home mandate for non-essential workers.
There has been a lot of noise regarding the flight from urban to
suburban markets, but San Francisco has always pulled through
the many market challenges it has previously experienced.
Year-End 2020 Market Snapshot
Multifamily sales volume slowed significantly in The City during
2020, with deal volume dropping 64 percent, translating to 119
881,791 transactions and approximately $677 million in volume. The average
Total Population sales price per unit also fell during the year from an average of over
(-0.1% Y/Y) $570,000 in 2019 to an average of $417,000 in 2020.
The ballot results are in and the two largest ballot measures that
529,919 would have impacted commercial real estate, Proposition 15 and
Total Employment
(-8.5% Y/Y) 21, were defeated this past November. Another item on the minds
of San Francisco landlords is the San Francisco moratorium on
commercial evictions that is currently scheduled to end March 31,
164,487 2021. The moratorium provides non-office commercial tenants a
Total Multifamily Units
(4,645 Units U/C - 2.8% of forbearance period of up to 24 months to pay arrears rent.
Existing Inventory)
$2,786
Average Effective Rent
(-20.8% Y/Y)
90.3%
Market Occupancy
(-590 bps Y/Y)
San Francisco recorded the highest annual rent decline (-20.8%)
in the nation in 2020, followed by San Jose, New York, Boston,
$470,942 and Seattle, per RealPage, Inc.
Average Price per Unit
(-9.1%)
Northern California Multifamily Market Report | Winter 2021 14San Francisco
Second Half 2020 Significant Multifamily Sales
Property Submarket Units Sale Price Price/Unit Cap Rate Buyer Seller
Keytone Apartments Downtown San Francisco 87 $43,000,000 $494,253 4.70% Yat-Pang Au Thomas O. Ballard
2171 Pacific Apartments Downtown San Francisco 20 $13,625,000 $611,500 3.70% Veritas Investments, Inc. Corinne M Rebizzo
3014 Clay Apartments Downtown San Francisco 12 $8,400,000 $660,000 3.80% Veritas Investments, Inc. Grace Kase & Mark Tsujimoto Trust
North Panhandle Apartments Downtown San Francisco 13 $7,350,000 $501,923 3.70% Veritas Investments, Inc. American Realty & Construction, Inc.
734-740 Green Street Downtown San Francisco 10 $7,250,000 $672,500 4.60% SF Bay Partners LLC Doug Wertheimer
San Francisco Multifamily
San Francisco Multifamily
Market Effective Monthly Rent & Market Occupancy Rate - Q4 2015 to Q4 2020
Market Effective Monthly Rent & Market Occupancy Rate - Q4 2015 to Q4 2020
Effective Rent Occupancy Rate
$3,600 98.0%
97.0%
$3,400
96.0%
95.0%
$3,200
94.0%
$3,000
93.0%
92.0%
$2,800
91.0%
$2,600 90.0%
Q4 2015 Q4 2016 Q4 2017 Q4 2018 Q4 2019 Q4 2020
Source: Colliers Northwest Research & RealPage, Inc.
Source: Colliers Northwest Research & RealPage, Inc.
San Francisco Multifamily
Market Quarterly Sales Volume & Average Price per Unit - Q1 2016 to Q4 2020
$600,000,000 $700,000
$600,000
$500,000,000
$500,000
$400,000,000
$400,000
$300,000,000
$300,000
$200,000,000
$200,000
$100,000,000
$100,000
$0 $0
Q1 Q2 Q3 Q4 Q1 Q2 Q3 Q4 Q1 Q2 Q3 Q4 Q1 Q2 Q3 Q4 Q1 Q2 Q3 Q4
2016 2016 2016 2016 2017 2017 2017 2017 2018 2018 2018 2018 2019 2019 2019 2019 2020 2020 2020 2020
Dollar Volume Average Price per Unit
Source: Colliers Northwest Research, CoStar
Source: Colliers Northwest Research, CoStar
Northern California Multifamily Market Report | Winter 2021 15San Francisco Peninsula
Sales activity ticks up by year-end while rents and
occupancy rates drop in the Peninsula
San Mateo’s multifamily gained steam in the second half of 2020.
The number of sales transactions doubled to thirty in the last two
quarters, totaling $543.3 million. The largest apartment complex to
trade hands was the 111-unit Mode Apartments located at 2089
Pacific Boulevard in San Mateo, trading for $80.1 million or $721,000
per unit. The average price per unit continued to climb, averaging
north of $678,000 per unit by Q4 2020, signaling confidence in the
market. Meanwhile, cap rates averaged 4.3 percent at the end of
Q4 2020, up 30 basis points over a twelve month period.
Occupancy remains elevated at 93.6 percent, however down
Year-End 2020 Market Snapshot
2.0 percent year-over-year after averaging around 96 percent
occupancy pre-pandemic. Market-wide average rents fell 15.5%
746,752 percent and are averaging $2,726 per month. The highest rents
Total Population remain in South San Mateo submarket, averaging north of $3,100
(-0.3% Change, July 2018 - July 2019) per month. Rents declined the most in North San Mateo County,
down 17.5 percent year-over-year.
418,624 Looking ahead, there are 1,983 multifamily units currently in the
Total Employment
(-8.3% Y/Y) construction pipeline. The largest complex under construction is
Highwater located at 1405 El Camino Real in Redwood City. The
project is being developed by Greystar and is expected to deliver
62,334 350 units in Q2 2021. Another notable development is Millbrae
Total Multifamily Units
(1,983 Units U/C - 3.2% of Station, which will add 320 units to the Millbrae submarket in 2022.
Existing Inventory)
$2,726
Average Effective Rent
(-15.5% Y/Y)
93.6% A tale of two markets in the Peninsula – while San Mateo
Market Occupancy
County’s apartment rents dropped nearly 16 percent year-
(-590 bps Y/Y)
over-year, the county’s median single family home sale price of
$1.6 million in December 2020 increased 8.8% from December
$483,919 2019, according to the California Association of Realtors.
Average Price per Unit
(-1.2%)
Northern California Multifamily Market Report | Winter 2021 16San Francisco Peninsula
Second Half 2020 Significant Multifamily Sales
Property Submarket Units Sale Price Price/Unit Vacancy at Sale Buyer Seller
Mode Apartments Central San Mateo County 111 $80,050,000 $721,171 8.1% Sares-Regis Group of Northern California Land and Houses U.S.A., Inc.
ENCORE Apartments South San Mateo County 90 $73,500,000 $816,666 11.1% Jay Paul Company Sares-Regis Group of Northern California
3618 Alameda de las Pulgas South San Mateo County 15 $9,000,000 $600,000 6.7% The Acclaim Companies Redwood Landing Properties, Inc.
342 Highland Ave Central San Mateo County 16 $7,250,000 $453,125 12.5% Spieker Companies, Inc. Michael F & Carol A Jackson Living Trust
1459 Gordon St South San Mateo County 12 $5,434,000 $452,833 8.3% Sleepmode 1459 Gordon LLC Jeffrey L Pollack
San Francisco Peninsula
San Francisco Peninsula Multifamily
Multifamily
MarketMarket
Effective Monthly
Effective RentRent
Monthly & Market Occupancy
& Market Occupancy Rate
Rate --Q4
Q42015
2015to to
Q4Q4 2020
2020
Effective Rent Occupancy Rate
$3,600 97.0%
96.5%
$3,400
96.0%
95.5%
$3,200
95.0%
$3,000
94.5%
94.0%
$2,800
93.5%
$2,600 93.0%
Q4 2015 Q4 2016 Q4 2017 Q4 2018 Q4 2019 Q4 2020
Source: Colliers Northwest Research & RealPage, Inc.
Source: Colliers Northwest Research & RealPage, Inc.
San Francisco Peninsula
San Francisco Multifamily
Peninsula Multifamily
Market Quarterly Sales Volume
Market Quarterly & Average
Sales Volume PricePrice
& Average perper
Unit - Q1
Unit - Q12016 toQ4
2016 to Q4 2020
2020
$800,000,000 $800,000
$700,000,000 $700,000
$600,000,000 $600,000
$500,000,000 $500,000
$400,000,000 $400,000
$300,000,000 $300,000
$200,000,000 $200,000
$100,000,000 $100,000
$0 $0
Q1 Q2 Q3 Q4 Q1 Q2 Q3 Q4 Q1 Q2 Q3 Q4 Q1 Q2 Q3 Q4 Q1 Q2 Q3 Q4
2016 2016 2016 2016 2017 2017 2017 2017 2018 2018 2018 2018 2019 2019 2019 2019 2020 2020 2020 2020
Dollar Volume Average Price per Unit
Source: Colliers Northwest Research, CoStar
Source: Colliers Northwest Research, CoStar
Northern California Multifamily Market Report | Winter 2021 17Silicon Valley
Drop in rents, prices, and demand while new supply
pressures loom in the tech capital of the world
The pandemic disrupted Silicon Valley’s multifamily sector. Prior to
the pandemic, largely tech related job growth bolstered the Silicon
Valley population, and in turn, the demand for housing. Despite a
negative demand trend, 2020 did not bear witness to a negative
supply trend. After passing a period in which all nonessential work,
including construction, was halted, the Silicon Valley saw roughly
5,300 units under construction throughout the course of the
year. Largely due to the proximity to numerous transit options,
Downtown San Jose, Santa Clara, Sunnyvale, and Mountain View
were the largest contributors to the supply growth. One of the
developments, Miro, will become the tallest building in Downtown
Year-End 2020 Market Snapshot
San Jose when it comes online in early 2021. The 28-story
development will add 630 residential units.
1,920,646
Total Population Investment volume held up surprisingly well, with 2020 producing
(-0.2% Change, July 2018 - July 2019) $1.5 billion in transactions, down $200 million since 2019 and of
which approximately $1 billion took place in the city of San Jose.
However, the multifamily market experienced a significant drop in
1,073,800 the average sale price per unit, from $501,000 average sale price
Total Employment
(-6.9% Y/Y) in 2019 to an average of $428,000 in 2020. The top two multifamily
sales in the second half of 2020 were two redevelopments from
apartments to townhomes by Summer Hill Housing Group.
177,139
Total Multifamily Units
(10,589 Units U/C - 6.0% of Silicon Valley’s multifamily market was suffering from an affordability
Existing Inventory) crisis prior to the pandemic, having some of the highest rents in the
nation. The pandemic has transformed how we work, at least in the
$2,480 short-term, creating options for workers to live in more affordable
Average Effective Rent areas, which, in turn, has made the Valley slightly more affordable,
(-13.5% Y/Y) too. However, a return to the office in some capacity is expected
to happen sometime in 2021, and the trend in rent relief may be
short lived.
93.8%
Market Occupancy
(-590 bps Y/Y)
The Irvine Company is redeveloping the 34-acre former AMD
$385,730 campus in North Sunnyvale into a residential project with
Average Price per Unit 944 apartment units delivering Q3 2022, which is the largest
(-13.6%) apartment property under construction across Northern
California
Northern California Multifamily Market Report | Winter 2021 18Silicon Valley
Second Half 2020 Significant Multifamily Sales
Property Submarket Units Sale Price Price/Unit Vacancy at Sale Buyer Seller
Meadowood Apartments * Mountain View/Palo Alto/Los Altos 116 $81,000,000 $698,275 19.8% Summer Hill Housing Group Calson Properties Inc.
The Landmark ** North Sunnyvale 130 $58,000,000 $446,153 32.3% Summer Hill Housing Group Pacific Urban Residential
St. Francis Arms Apartments South Sunnyvale/Cupertino 119 $48,550,349 $407,986 Undisclosed Prometheus Real Estate Group Christopher Bellomo
Victorian Square Apartments North San Jose/Milpitas 96 $36,250,000 $377,604 5.2% Klingbeil Capital Management Great Flag Investment
1545 N 1st St Central San Jose 48 $12,750,000 $265,625 10.4% Brandon Wey Acer Investments
* Sold for land value - buyer intends to demolish existing structure and build 115 for-sale townhomes starting
** Sold for land value - buyer intends to demolish existing buildings to develop 128 townhome units
Silicon
SiliconValley Multifamily
Valley Multifamily
Market Effective
Market EffectiveMonthly Rent&&Market
Monthly Rent Market Occupancy
Occupancy Rate Rate - Q4to
- Q4 2015 2015 to Q4 2020
Q4 2020
Effective Rent Occupancy Rate
$3,000 97.0%
96.5%
$2,800
96.0%
95.5%
$2,600
95.0%
$2,400
94.5%
94.0%
$2,200
93.5%
$2,000 93.0%
Q4 2015 Q4 2016 Q4 2017 Q4 2018 Q4 2019 Q4 2020
Source: Colliers
Source: Northwest
Colliers Northwest Research
Research & RealPage,
& RealPage, Inc. Inc.
Silicon Valley Multifamily
Market Quarterly Sales Volume & Average Price per Unit - Q1 2016 to Q4 2020
$800,000,000 $700,000
$700,000,000 $600,000
$600,000,000
$500,000
$500,000,000
$400,000
$400,000,000
$300,000
$300,000,000
$200,000
$200,000,000
$100,000,000 $100,000
$0 $0
Q1 Q2 Q3 Q4 Q1 Q2 Q3 Q4 Q1 Q2 Q3 Q4 Q1 Q2 Q3 Q4 Q1 Q2 Q3 Q4
2016 2016 2016 2016 2017 2017 2017 2017 2018 2018 2018 2018 2019 2019 2019 2019 2020 2020 2020 2020
Dollar Volume Average Price per Unit
Source: Colliers Northwest Research, CoStar
Source: Colliers Northwest Research, CoStar
Northern California Multifamily Market Report | Winter 2021 19East Bay
East Bay severely impacted in 2020 but investor interest
recovering in early 2021
The East Bay market has seen strong interest from the investment
community in the first quarter of 2021. Optimism remains high
based on the dramatic decline in COVID-19 cases in both Alameda
and Contra Costa counties and the increased levels of vaccinations
throughout California.
The most severely impacted rental markets in the East Bay have
unanimously been Oakland and Berkeley, with rent declines in
the central business districts of both submarkets approaching
20 percent. However, we have not seen pricing concessions on
multifamily properties correlating with the rental discount rates
Year-End 2020 Market Snapshot
related to the pandemic. Investors are keenly aware that this was
a temporary blip in the economy as all other fundamentals remain
2,767,670 very strong. While the initial shock of the pandemic caused the
Total Population debt markets to pause, we have seen appetite from lenders across
(+0.3% Change, July 2018 - July 2019) the board to place traditional and unconventional financing on
apartment properties. We anticipate the debt markets will remain
favorable for the foreseeable future and continue to fuel investor
1,259,993 appetite for multifamily assets.
Total Employment
(-8.1% Y/Y)
During the mid-point of 2020, we saw a standstill in deal velocity.
Over the last four months of the year, the rebound from an
214,159 overabundance of pent-up equity and dry powder is very apparent.
Total Multifamily Units
(10,563 Units U/C - 4.9% of We have seen multiple offer situations on all of our investment
Existing Inventory) opportunities.
$2,341
Average Effective Rent
(-8.0% Y/Y)
Effective rents decreased year-over-year in every East Bay
94.7% submarket expect for the two outlying suburban submarkets
Market Occupancy
in Contra Costa County, consisting of the cities of Pittsburg,
(-140 bps Y/Y)
Antioch, and Richmond – Northeast Contra Costa County
(+6.4%) and Northwest Contra Costa County (+0.8%)
$313,321
Average Price per Unit
(-10.8%)
Northern California Multifamily Market Report | Winter 2021 20East Bay
Second Half 2020 Significant Multifamily Sales
Property Submarket Units Sale Price Price/Unit Vacancy at Sale Buyer Seller
Redwood Gardens Apartments Oakland/Berkeley 169 $72,100,000 $426,627 1.2% Foundation Housing CSI Support & Development Services
Glenmoor Green Apartments Fremont 150 $58,500,000 $390,000 Undisclosed Prime Group Glenmoor Realty Inc
Rica Vista Oakland/Berkeley 186 $58,250,000 $313,172 9.7% Lincoln Avenue Capital Pacific Urban Residential
The Arbors Livermore/Pleasanton 162 $49,000,000 $302,469 9.3% Catalyst Housing Group Lexington Associates Inc
ReNew One59 Hayward/San Leandro/Union City 145 $40,750,000 $281,034 2.1% FPA Multifamily LLC Lagacy Partners
East
EastBay Multifamily
Bay Multifamily
Market
MarketEffective
Effective Monthly Rent&&
Monthly Rent Market
Market Occupancy
Occupancy Rate Rate - Q4to
- Q4 2015 2015 to Q4 2020
Q4 2020
Effective Rent Occupancy Rate
$2,600 96.5%
96.0%
95.5%
$2,400
95.0%
94.5%
$2,200
94.0%
93.5%
$2,000 93.0%
Q4 2015 Q4 2016 Q4 2017 Q4 2018 Q4 2019 Q4 2020
Source: Colliers Northwest Research & RealPage, Inc.
Source: Colliers Northwest Research & RealPage, Inc.
East Bay Multifamily
Market Quarterly Sales Volume & Average Price per Unit - Q1 2016 to Q4 2020
$1,100,000,000 $450,000
$1,000,000,000
$400,000
$900,000,000
$350,000
$800,000,000
$300,000
$700,000,000
$600,000,000 $250,000
$500,000,000 $200,000
$400,000,000
$150,000
$300,000,000
$100,000
$200,000,000
$100,000,000 $50,000
$0 $0
Q1 Q2 Q3 Q4 Q1 Q2 Q3 Q4 Q1 Q2 Q3 Q4 Q1 Q2 Q3 Q4 Q1 Q2 Q3 Q4
2016 2016 2016 2016 2017 2017 2017 2017 2018 2018 2018 2018 2019 2019 2019 2019 2020 2020 2020 2020
Dollar Volume Average Price per Unit
Source: Colliers Northwest Research, CoStar
Source: Colliers Northwest Research, CoStar
Northern California Multifamily Market Report | Winter 2021 21North Bay
Rents declined minimally while sales increased
significantly in the North Bay
The North Bay multifamily market weathered the storm of 2020
relatively unscathed from the pandemic. Average effective rents
were $2,196 per month at the end of 2020, a 1.2 percent decline
year-over-year, well below the 9.0 percent decline measured across
Northern California for the year.
Sales activity in 2020 increased significantly to $1.01 billion for
the year, a 14.9 percent increase over 2019’s total. The average
price per unit experienced an even greater increase in 2020, a 56.4
percent increase to $341,661. This increase was largely attributable
to an increase in the sales volume in higher-priced Marin County in
Year-End 2020 Market Snapshot
2020. Cap rates in the North Bay declined sharply in 2020 from 5.7
percent to 4.9 percent, another sign of growing investor interest
1,331,614 in the region. The largest multifamily sale in the North Bay in 2020
Total Population was California Community Housing Agency’s purchase of Serenity
(-0.3% Change, July 2018 - July 2019) at Larkspur. The sale price for the 342-unit, 297,490 square foot
complex was $222.5 million or $650,584 per unit.
615,011 The pandemic-driven trend of migration out of larger cities and
Total Employment
(-7.4% Y/Y) into rural and suburban markets is a key driver of the increased
demand of leasing and sales in the North Bay multifamily market.
The access to nature and more outdoor space in the region have
74,887 proven attractive and attainable as more workers have shifted to
Total Multifamily Units
(799 Units U/C - 1.1% of working remotely and migrating away from high density urban
Existing Inventory) environments.
$2,196
Average Effective Rent
(-1.2% Y/Y)
Investors have shifted their focus to the North Bay, making
96.5% it the top performing Northern California market in terms of
Market Occupancy
sales activity in 2020 with a 14.9% year-over-year increase in
(+30 bps Y/Y)
sales volume and price growth registering a 56.4% jump in the
average annual price per unit
$321,618
Average Price per Unit
(+25.0%)
Northern California Multifamily Market Report | Winter 2021 22North Bay
Second Half 2020 Significant Multifamily Sales
Property Submarket Units Sale Price Price/Unit Cap Rate Buyer Seller
View at Marin Marin County 254 $106,000,000 $417,322 Undisclosed PUR San Rafael LLC AvalonBay Communities, Inc.
Camden Parch Apartments Vacaville 168 $44,032,081 $262,095 Undisclosed Camden Parc Residential Llc Camden Parc Apartments Llc
Napa Green Apartments Napa 166 $39,500,000 $237,951 4.7% Napa Green Apartments LLC John & Amy Palmer
Woodcrest Apartment Homes Vacaville 135 $38,500,000 $285,185 5.4% Cypress Arms III Limited Partnership Woodcrest Apartment Homes LLC
Creekside Park Apartments Santa Rosa 141 $33,300,000 $236,170 4.7% Prime Creekside LLC Creekside Park Associates
NorthNorth
Bay Bay Multifamily
Multifamily
MarketMarket Effective Monthly Rent & Market Occupancy Rate - Q4 2015 to Q4 2020
Effective Monthly Rent & Market Occupancy Rate - Q4 2015 to Q4 2020
Effective Rent Occupancy Rate
$2,400 98.0%
97.5%
97.0%
$2,200
96.5%
96.0%
$2,000 95.5%
95.0%
94.5%
$1,800
94.0%
93.5%
$1,600 93.0%
Q4 2015 Q4 2016 Q4 2017 Q4 2018 Q4 2019 Q4 2020
Source: Colliers Northwest Research & RealPage, Inc.
Source: Colliers Northwest Research & RealPage, Inc.
NorthNorth
BayBay
Multifamily
Multifamily
Market Quarterly Sales Volume & Average Price per Unit - Q1 2016 to Q4 2020
Market Quarterly Sales Volume & Average Price per Unit - Q1 2016 to Q4 2020
$500,000,000 $500,000
$450,000
$400,000,000 $400,000
$350,000
$300,000,000 $300,000
$250,000
$200,000,000 $200,000
$150,000
$100,000,000 $100,000
$50,000
$0 $0
Q1 Q2 Q3 Q4 Q1 Q2 Q3 Q4 Q1 Q2 Q3 Q4 Q1 Q2 Q3 Q4 Q1 Q2 Q3 Q4
2016 2016 2016 2016 2017 2017 2017 2017 2018 2018 2018 2018 2019 2019 2019 2019 2020 2020 2020 2020
Dollar Volume Average Price per Unit
Source: Colliers Northwest Research, CoStar
Source: Colliers Northwest Research, CoStar
Northern California Multifamily Market Report | Winter 2021 23Stockton/Modesto
Stockton/Modesto continues to perform phenomenally
through year-end 2020
Current effective rent for the overall Stockton/Modesto multifamily
market year end 2020 was $1,253 per month. Since mid-year 2020,
effective rent increased by 4.7 percent. Market occupancy by the
third quarter had increased 70 basis points to 97.3 percent while
only increasing 20 basis points in the fourth quarter to 97.5 percent.
The second half of the 2020 multifamily market had 33 transactions
occur in the Stockton/Modesto markets totaling $110.7 million with
an average cap rate of 6.7 percent. The overall average price per
unit during the second half of 2020 was $160,245.
The largest multifamily transaction to take place in the second half of
Year-End 2020 Market Snapshot
2020 occurred in Ripon totaling $49.8 million. Stonesfair Financial
Corporation purchased the 167-unit Class A luxury apartments
1,315,681 known as Luxe Ripon for $298,203 per unit. The luxury apartment
Total Population complex was fully leased at the time of sale. Additionally, another
(+0.9% Change, July 2018 - July 2019) significant Modesto apartment complex sale occurred at the end of
2020 with the sale of the 116 unit Park Lakewood complex located
at 1500 Lakewood Avenue in Modesto. The overall sales price was
502,257 $20,880,000 or $180,000 per unit and was purchased by M Designs
Total Employment
(-6.4% Y/Y) Architects.
The combination of minimal new supply, rising migration from the
46,724 Bay Area, and the preference for more spacious living conditions
Total Multifamily Units
(638 Units U/C - 1.4% of has resulted in strong rent growth and substantial occupancy
Existing Inventory) increases over the last twelve months. While it remains to be seen
if this is a permanent or temporary shift in population, Stockton/
$1,383 Modesto is well positioned for investors looking to own or develop
Average Effective Rent in a stable and growing market.
(+7.6% Y/Y)
99.0%
Market Occupancy
(+150 bps Y/Y)
Stockton/Modesto posted the most impressive occupancy gain
across the region in 2020, increasing 1.5 percentage points
$121,892 year-over-year and recording the highest occupancy rate in
Average Price per Unit Northern California at 99.0%
(+5.8%)
Northern California Multifamily Market Report | Winter 2021 24You can also read