STEICO SE Half-Year Report 2021 - The green share

Page created by Terry Thomas
 
CONTINUE READING
STEICO SE Half-Year Report 2021 - The green share
STEICO SE
Half-Year Report 2021

                                                               The green share

6M                                               2021
Revenues up by around 30%. EBIT lifts 2.5-fold year-on-year.

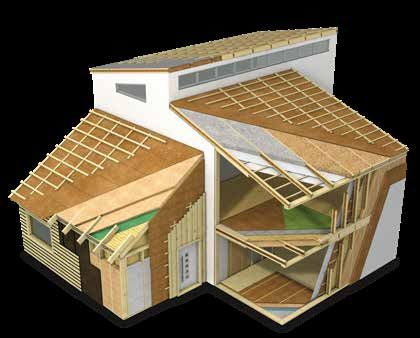
Natural building products for healthier living
STEICO SE Half-Year Report 2021 - The green share
H1 2021 – STEICO Konzern
    Overview

    H1 2021: Revenues up by around 30%. EBIT lifts 2.5-fold year-on-year.

    H1 2021 Revenue growth in € millions                                        H1 2021 Gross Earnings growth in € millions

    200                             +29.6%        186.8                         100
                                                                                                            +36.4%        89.6
    160                  144.2                                                   80
                                                                                                     65.7
    120                                                                          60

     80                                                                          40

     40                                                                          20
      €m

                                                                                  €m
                                                  21
                         20

                                                                                                     20

                                                                                                                          21
                                                20
                       20

                                                                                                 20

                                                                                                                        20
    H1 2021 EBITDA growth in € millions                                         H1 2021 EBIT growth in € millions

     50                                                                         37.5
                                    +74.6%         41.4                                                     +155.1%           31.1
     40                                                                         30.0

     30                                                                         22.5
                          23.7
     20                                                                         15.0                 12.2

     10                                                                          7.5
      €m

                                                                                  €m
                         20

                                                  21

                                                                                                     20

                                                                                                                          21
                       20

                                                20

                                                                                                 20

                                                                                                                        20

    H1 2021 EBT growth in € millions                                            H1 2021 Profit for the Period growth in € millions

    37.5                                                                         25
                                    +163.4%       30.6                                                      +181.5%           21.1
    30.0                                                                         20

    22.5                                                                         15

    15.0                  11.6                                                   10
                                                                                                     7.5
     7.5                                                                          5
      €m

                                                                                  €m
                         20

                                                  21

                                                                                                     20

                                                                                                                          21
                       20

                                                20

                                                                                                 20

                                                                                                                        20

       | Additional KPIs
                                                                                         H1 2021                  FY 2020                  H1 2020

           1.   Total operating revenue in € millions                              € 185.5 million          € 306.9 million          € 142.3 million
           2.   EBITDA margin as a percentage of total operating revenue                   22.3%                    18.6%                    16.6%
           3.   EBIT margin as a percentage of total operating revenue                     16.8%                    10.9%                     8.6%
           4.   Equity ratio (as of 31 Dec.)                                               53.2%                    53.0%                    50.0%
    Percentage increases and margins calculated based on non-rounded figures.

2   STEICO Half-Year
    Technisches Handbuch
                     Report
                         STEICO
                            2021 construction
Half-Year Report 2021

Climate protection, CO2-saving construction and energy efficiency
are defining social issues. Given this background, demand for
STEICO's ecological insulation materials and construction products
has increased once again. As a result, new records were set
for both revenues and earnings in the first half of the year.
Revenues were up 29.6% year-on-year at € 186.8 million.
EBIT improved by 155.1% to € 31.1 million and net income
for the period in the first six months lifted by 181.5% to
€ 21.1 million. Profitability also grew substantially with an EBIT
ratio of 16.8%. However, in a comparison with the previous
year, it should be noted that the second quarter of 2020 was
weaker due to the effects of the COVID-19 pandemic.
Due to the friendly market environment, growth is
expected to continue in the second half of 2021 – although
growth rates are likely to be somewhat lower due to the
already very strong second half of the previous year.
Management is therefore raising its expectations for the current
fiscal year. Unless there are additional negative effects from
developments in the pandemic, the Board of Directors believes
that in 2021 revenues will lift by around 20% with an EBIT ratio
between 14.0% and 17.0% (in terms of total operating revenue).

Company profile                                          as well as cavity wall insulation made of wood fibers
                                                         and cellulose. Sealing products for the building shell
The STEICO Group develops, produces and markets
                                                         round off the overall system.
ecological construction products made of renewable
raw materials. STEICO is the European market leader      The STEICO Group offers its customers a unique
in the wood-fibre insulation materials segment.          range of products up to the prefabrication of
                                                         complete building components for wood element
STEICO is positioned as a system provider for
                                                         construction.
ecological residential construction and is the only
manufacturer in the industry to offer an integrated      The Munich-based company’s products are used
wooden construction system in which insulation           in new construction and when renovating roofs,
material and construction components supplement          walls, ceilings, floors and facades. STEICO’s products
each other.                                              allow the construction of future-proof, healthy
                                                         buildings with a particularly high quality of living
Laminated veneer lumber and I-joists form the
                                                         and a healthy atmosphere. STEICO’s products offer
structural components of the system. Insulation
                                                         reliable protection against cold, heat and also noise,
materials include flexible and stable wood fiber
                                                         and they permanently improve the building’s energy
insulation panels, composite thermal insulation
                                                         efficiency.
systems, insulation panels with a reinforcing effect,

Disclaimer

This document is a translated version of the German original document. The translation has been prepared with
utmost care. However, only the German original document is binding.

                                                                                                                   STEICO Half-Year Report 2021   3
Growth of STEICO’s shares

    A. SHARE PRICE GROWTH IN 2021                                                       STEICO Aktie:
                                                                                        STEICO’s      Kursentwicklung
                                                                                                 shares:                2021in H1 2021
                                                                                                         Share price growth                                          Longt

    STEICO’s shares started the year with a price of € 62.50 on 4             120 €                                                                       1400%
    January (XETRA closing price). The following day, the lowest                                STEICO SE
                                                                              110 €                                                                       1200%
    point of the period under review was marked at € 59.20.
                                                                              100 €                                                                       1000%
    In the following months, an almost uninterrupted increase
    in value was recorded before the share exited trading at an                90 €                                                                       800%
    all-time high of € 110.00 on 30 June. This corresponds to an
                                                                               80 €                                                                       600%
    increase in value of 76.8% in the first six months.
                                                                               70 €                                                                       400%

                                                                               60 €                                                                       200%

                                                                               50 €                                                                         0%

                                                                               40 €                                                                         in%
                                                                                      21

                                                                                                21

                                                                                                             21

                                                                                                                       21

                                                                                                                                 21

                                                                                                                                           21

                                                                                                                                                     21

                                                                                                                                                                  15
                                                                                   20

                                                                                                20

                                                                                                          20

                                                                                                                       20

                                                                                                                                 20

                                                                                                                                           20

                                                                                                                                                     20

                                                                                                                                                                20
                                                                                 1.

                                                                                            1.

                                                                                                        2.

                                                                                                                   3.

                                                                                                                             4.

                                                                                                                                       5.

                                                                                                                                                 6.

                                                                                                                                                             1.
                                                                                .0

                                                                                           .0

                                                                                                        .0

                                                                                                                  .0

                                                                                                                            .0

                                                                                                                                      .0

                                                                                                                                                .0

                                                                                                                                                            .0
    B. INVESTOR RELATIONS
                                                                              04

                                                                                           29

                                                                                                     26

                                                                                                                  31

                                                                                                                            30

                                                                                                                                      31

                                                                                                                                                30

                                                                                                                                                           01
    As was the case in previous years, STEICO SE engaged in
    open and direct communication with the capital markets in the first six months of 2021, and was also in close contact with
    its shareholders. Due to ongoing contact restrictions as a result of the Corona pandemic, exchanges only took place online. In
    2021, in addition to the transparency policies for the Basic Board and m:access, STEICO SE fulfilled its publication requirements,
    for example with end-to-end communication in German and English and the regular publication of quarterly reports. In
    addition, up-to-date press releases and financial reports are also always published on the Web site www.STEICO.com/ir.
    Information on key events is disseminated via a well-known institution to comply with publicity obligations.

    C. CAPITAL MARKET DIARY 2021
    7/8 January 2021         STEICO presented the company to institutional investors at the 24th Oddo Forum, held by ODDO BHF (online conference)
    21 January 2021          STEICO presented the company to institutional investors (virtual roadshow with M.M. Warburg)
    1 February 2021          Publication of provisional figures for 2020 (after stock-market closing)
    17 March 2021            STEICO presented the company at the Berenberg DACH+Nordic Conference 2021 (online conference)
    24/25 March 2021         STEICO presented the company at Metzler MicroCap Days (online conference)
    27 April 2021            Publication of 2020 annual report together with the Q1 2021 report (after stock-market closing)
                             STEICO presented the company to institutional investors at the Commerzbank Corporate Conference 2021, USA
    19 May 2021
                             (online conference)
    20 May 2021              STEICO presented the company to institutional investors at the CIC Market Solutions Forum (online conference)
    10/11 June 2021          STEICO presented the company to institutional investors at the Warburg Highlights Conference (online conference)
    24 June 2021             STEICO SE’s 2021 Ordinary General Meeting
    19 July 2021             Publication of the 2021 semi-annual report
    1 September 2021         STEICO will present the company to institutional investors at the Commerzbank Corporate Conference (online conference)
    20/22 September 2021     STEICO will present the company to institutional investors at the Baader Investment Conference (online conference)
                             STEICO will present the company at the Berenberg Goldman Sachs Tenth German Corporate Conference
    21 September 2021
                             (online conference)
    October 2021             Publication of the Q3 report 2021
    14 October 2021          STEICO will present the company at Munich Stock Exchange’s “Specialist Conference for Technology” (DE)

4   STEICO Half-Year Report 2021
Half-Year Report 2021

Group management report for STEICO SE as of 30 June 2021

A. FOUNDATIONS                                                   Wood-fibre insulation materials are produced by the
                                                                 subsidiaries using various methods - both the wet and
I.   STEICO SE’S BUSINESS MODEL                                  the dry method. Both methods break down wood into
                                                                 individual fibres using steam and mechanical treatment. The
                                                                 fundamental difference between the two methods is that
1.   OVERVIEW
                                                                 wet fibres are processed (formed to make boards) in the wet
The STEICO Group develops, produces and markets ecological       method, and in the dry method the fibres are dried before
construction products made of renewable raw materials.           forming the boards. The dry method can be used to produce
According to its own estimates, STEICO is the global market      fibres for cavity insulation, flexible (compressible) mats or
leader in terms of sales revenues in the wood fiber insulation   stable insulation boards.
materials segment compared with its relevant competitors.
                                                                 Cavity insulation
STEICO is positioned as a system provider for ecological
                                                                 Cavity insulation is made of loose insulation fibres or
residential construction and, compared to the relevant
                                                                 insulation flakes which are blown into construction cavities at
competitors, it is the only manufacturer in the industry to
                                                                 high pressure, where they then compress. The STEICO Group
offer an integrated wooden construction system in which
                                                                 produces and sells cavity insulation material made of wood
insulation material and wooden construction components
                                                                 fibres and also cellulose flakes.
supplement each other. These include flexible wood fiber
insulation materials, stable wood fiber insulation boards,       Construction products: LVL, Laminated Veneer Lumber
wood fiber insulation boards for facade insulation (“ETICS”),
air injected insulation made of wood-fibre and cellulose as      Laminated veneer lumber is a high-performance wood
well as system products to seal building shells. Construction    material and comprises several layers of wood laminate glued
elements comprise I-joists and laminated veneer lumber.          together. It is characterised by its particularly high rigidity
In addition, the STEICO Group also produces Natural Fibre        and ability to bear loads, while simultaneously offering high
Boards and operates in the wood wholesale trade. The             dimensional stability. Laminated veneer lumber is used both
product range in the United Kingdom also include products        in the construction industry and also in industrial applications
for ceiling and floor construction.                              (for example to produce doors and furniture). It is also a key
                                                                 component for I-joists (belt material).
The STEICO Group’s production equipment can also be used
to produce a wide variety of specialty products such as door     Construction products: I-joists
panels, pin-boards, etc. which are sold to various industrial
                                                                 I-joists are supporting components which are optically very
customers.
                                                                 similar to traditional double-T-joists. They comprise two
                                                                 “belts” (square timber posts made of laminated veneer
2.   THE STEICO GROUP’S PRODUCTS AND SERVICES
                                                                 lumber) which are connected using a fibreboard. Some of the
The STEICO Group is a system provider for natural                bridge material is purchased (OSB: Oriented Strand Board),
construction products for insulation and construction.           but the majority is produced in-house (Natural Fiber Boards).
The core range comprises “natural wood-fibre insulation          STEICO’s I-joists offer an alternative to standard construction
materials”. In the first six months of 2021 the bulk of          products such as construction lumber or laminated timber in
revenues (69.2%) was recorded with environmentally friendly      terms of both their price and energy efficiency.
wood-fibre insulation materials and cavity insulation for
                                                                 Special products
building and floor insulation.
                                                                 The special products segment bundles all of the products
The STEICO Group’s current range of products and services
                                                                 that the group produces itself which are not directly allocable
comprises:
                                                                 to the construction sector. These include, for example,
Wood-fibre insulation materials                                  fibreboards for pinboards or door fills, as well as other
                                                                 products for industrial applications.
STEICO insulation materials are mode of fresh soft wood.
They are used in new buildings and renovation work,
protecting against the cold, heat and noise.

                                                                                                      STEICO Half-Year Report 2021   5
Group management report for STEICO SE as of 30 June 2021

    Timber wholesale                                                 STEICO SE's customers for a long time, but is often labour-
                                                                     intensive manual work. STEICO's prefabrication has a high
    The STEICO Group operates in wood product wholesale in
                                                                     degree of automation, which is associated with increases in
    Germany. These products stem from the company’s former
                                                                     speed and precision. The offering is geared to construction
    orientation and these operations are being continued with a
                                                                     companies (timber construction as well as hybrid
    low number of employees. The company generates revenues
                                                                     construction and redevelopment companies), which can
    with wood products which are mostly imported from south-
                                                                     thus achieve advantages in terms of personnel deployment,
    eastern European countries and Poland. Clients are the
                                                                     economic efficiency and construction speed. STEICO SE will
    timber wholesale trade and furniture industry in Germany.
                                                                     not operate as a house construction company itself.
    The range of merchandise spans sawn timber through to
    semi-finished products for furniture making (e.g. products cut   Services
    to customer specifications).
                                                                     STEICO offers a range of supplementary services, such as its
    STEICO UK Ltd. runs wholesale operations in the United           “STEICO Academy” seminars. These seminars train craftsmen,
    Kingdom with wood and wooden composite boards to                 architects, trade representatives and also people building
    supplement its sales of I-joists. It has become standard         their own home in how to use the STEICO construction
    practice on the UK market for construction companies to          system. In addition STEICO has its own department for
    offer end-to-end ceiling systems - including planning, the       technical advice for craftsmen, planners and builders. As a
    supporting structure (I-joists) and wooden composite boards      rule services are preformed free of charge.
    to construct the floor - all from a single source.
                                                                     3.   PROCUREMENT
    Natural fibre boards
                                                                     The fresh timber required to produce wood fibre products
    The production of natural fibre boards is similar to the
                                                                     is mostly procured in Poland from the Polish State Forest.
    production of wood-fibre insulation materials made using the
                                                                     In France timber is procured on the free timber market. The
    wet method. The difference is that wet fibres are pressed to
                                                                     timber is sourced from sustainably managed forests from the
    form stable boards using particularly high pressure. Natural
                                                                     region surrounding the production facilities.
    fibre boards are used in the furniture industry where they are
    used, for example, to form the backs of cupboards or the
                                                                     4.   SALES AND CUSTOMERS
    bottoms of drawers. In addition, they are used as standard
    construction boards on many markets, for example for roof        The STEICO Group’s customers are mostly broken down
    boards. Within the STEICO Group, natural fibre boards are a      into the customer groups of wood and construction
    key component in the production of I-joists, where they form     materials traders, wood construction companies (such as
    the so-called web. Sales to external customers is no longer of   pre-fabricated home construction companies) and DIY stores
    any strategic importance due to the low margins.                 (in some cases via distributors) as well as industrial customers
                                                                     (e.g. manufacturers of laminated/parquet flooring, furniture
    Miscellaneous
                                                                     manufacturers, construction material manufacturers). The
    Various activities are bundled in the Miscellaneous segment,     STEICO Group aims to ensure a broad customer base in order
    including in particular services, element production and, for    to avoid dependencies on individual customers.
    example, the trade in ETICS accessories.
                                                                     Other key customer groups include:
    Element production
                                                                     • Craftsmen and wood construction companies which
    In 2020, STEICO SE entered the market with its "Element            process the group’s products.
    Production" division. This involves refining individual STEICO
                                                                     • Architects and planners, who take decisions to use
    products (construction materials and insulating materials) to
                                                                       STEICO’s products when planning buildings.
    form complete components such as roof, wall and ceiling
    elements according to customer specifications. These             • Private and institutional builders who use STEICO’s
    elements allow work on the construction site to progress           products in their buildings.
    particularly rapidly.

    Automation and prefabrication of end-to-end components
    are ongoing trends in the construction industry.
    Prefabrication / element production has been practised by

6   STEICO Half-Year Report 2021
Half-Year Report 2021

II.   CONTROL SYSTEM AND SHAREHOLDER                            B. ECONOMIC REPORT
      SYSTEM
                                                                I.      OVERALL ECONOMIC AND INDUSTRY-SPECIFIC
STEICO SE is responsible for sales management, marketing,               UNDERLYING CONDITIONS
investments, product development, finance and financial
control in its position as the group’s holding company. 61.1%
                                                                1.      ECONOMIC TREND
of shares are held be the CEO / managing director Mr. Udo
Schramek, and the remaining 38.9% are in free float.            The European construction industry quickly recovered from
                                                                the slump caused by the COVID-19 crisis. Current figures
                                                                from the European statistics authority Eurostat show a
                                                                production level in the construction sector for April that
III. RESEARCH AND DEVELOPMENT
                                                                largely corresponds to the pre-crisis level.1Market research
                                                                network Euroconstruct also expects the recovery to continue,
R&D activities in the first six months focused on optimising
                                                                forecasting that the European construction industry will grow
product characteristics for wood fibre insulation boards as
                                                                by 3.8% in 2021 after slumping by 5.1% in 2020.2
well as developing new products as part of the product
range, in particular:                                           Construction activity in Germany, the most important market
                                                                for the STEICO Group, boomed in the first half of 2021. The
• Supporting research work in parallel to operating the
                                                                indicators for the STEICO segments in particular enjoyed
  Group’s own production line for laminated veneer lumber
                                                                positive growth. Latest figures from DESTATIS, the German
• Research activities to develop binding agents and             Federal Statistical Office for April 2021 show new orders in
  alternative adhesives for timber materials                    the construction sector up 7.0% on the same month last
                                                                year and up 9.8% on March 2021.3 Building permission for
• Further development of cellulose cavity insulation
                                                                residential accommodation was up by 13.8% from January to
• Developing and optimising wet method wood fibre               April 2021.4 Sales figures are available for March 2021. The
  insulation materials                                          relevant sub-segment "roofing and carpentry” is reporting
                                                                a 7.1% increase in sales compared to the same month of
• Developing and optimising dry method wood fibre
                                                                the previous year5 and thus takes the top position in the
  insulation materials
                                                                construction sector.
• Research to optimise the fire and mouldering performance
                                                                The trend towards timber construction / prefabricated
  for STEICO’s insulation materials
                                                                construction continued. Bundesverband Deutscher Fertigbau
• Research to optimise the heat conduction properties for       e.V. (German Prefabricated Construction Association) reports
  STEICO’s insulation materials                                 a prefabricated construction rate of 22.4% for 2020 as a
                                                                whole, with an expected increase to around 23% in 2021.6
• Research to optimise the emission behaviour for wood
  fibre insulation materials and wooden materials
                                                                2.       COMPETITION
• Development and pre-production of full wall, roof and
                                                                With regard to wood-fibre insulation materials, the most
  ceiling elements produced using the STEICO construction
                                                                important competitors in the first six months of 2021 in
  system
                                                                the opinion of the company’s management were Gutex
• Development of foamable insulating materials based on         (Germany), Soprema with its Pavatex brand (France),
  wood and renewable raw materials                              bestwood Schneider (Germany), Hunton (Norway) and Fibris
                                                                (Poland).
Future R&D work will continue to focus on expanding the
integrated construction system.

                                                                1    Source:   Eurostat, Euroindikatoren 72/2021, 17 June 2021
                                                                2    Source:   Euroconstruct, press release dated 10 June 2021
                                                                3    Source:   DESTATIS, press release 298 dated 25 June 2021
                                                                4    Source:   DESTATIS, press release 281 dated 15 June 2021
                                                                5    Source:   DESTATIS, press release 271 dated 10 June 2021
                                                                6    Source:   Bundesverband Deutscher Fertigbau e.V., 20 June 2021

                                                                                                            STEICO Half-Year Report 2021   7
Group management report for STEICO SE as of 30 June 2021

    STEICO SE’s management believes that in the first half           Production of wood fibre insulating materials
    2021 its key competitors for I-joists were Metsä (Finnland),
                                                                     Demand for wood fiber insulation materials remains high.
    Masonite (Sweden), as well as James Jones (United Kingdom).
                                                                     The capital expenditure program to create new production
    The most important competitors for laminated veneer lumber       capacity is largely on schedule and on budget – despite
    in the first six months of 2021 were Metsä (Finland), Stora      challenges due to poor availability of building materials of all
    Enso (Finland), Pollmeier (Germany), as well as MLT / Taleon     kinds.
    Terra (Russia).
                                                                     At the Czarna Woda site, a further plant for stable wood fiber
    As a result the competitive landscape did not change             insulation materials using the wet process is being built. It is
    significantly in the first half of 2021. The company’s           planned to go live in the fourth quarter of 2021.
    management also does not expect any major changes in
                                                                     At the Casteljaloux site, a plant for stable wood fiber
    the second half of 2021 either, such as the market entry
                                                                     insulation materials using the dry process is being built. It is
    of further relevant competitors, which means that the
                                                                     planned to go live in the fourth quarter of 2021.
    intensity of competition should remain constant in principle.
    Announced capacity expansions by Soprema at the Golbey           Preparatory work is underway at the new Gromadka site for
    site (France) and by Gutex (new site south of Freiburg)          the construction of the new insulation materials plant. It is
    are not expected to lead to changes in the competitive           planned to go live at the start of 2023.
    situation until 2022 and 2023 at the earliest, according to
                                                                     As a result of projects already completed, production volumes
    management estimates.
                                                                     have already been significantly increased compared with the
                                                                     previous year. Ongoing conversions of existing plants should
                                                                     ensure that additional volumes are available before the end
    II.   COURSE OF BUSINESS                                         of the year.

                                                                     Production of laminated veneer lumber (LVL)
    1.    KEY EVENTS IN THE FIRST SIX MONTHS OF 2021
                                                                     The production of laminated veneer lumber is stable and
    There were no key events in the first half of the year.          both plants being run at full capacity.

                                                                     Production of I-joists
    2.    UNDERLYING CONDITIONS FOR PRODUCTION AND
          SALES                                                      The increase in the price of classic structural timber makes
                                                                     I-joists more attractive as an alternative product. As a result,
    Development of purchase prices
                                                                     the production of I-joists could be significantly expanded.
    A number of auxiliary and operating materials became
                                                                     Production of prefabricated timber components
    significantly more expensive in the first half of the year.
    Energy costs were partially stabilized by the switch from        Production of prefabricated components continues to record
    coal to biomass. In contrast, electricity costs in Poland have   positive growth. As the contribution to sales is still low, these
    continued to rise from a high level.                             activities are currently still reported under the collective item
                                                                     "Miscellaneous".
    The purchase prices of wood increased only moderately in
    the first half of the year. Media reports on sharp increases     STEICO's Element Production is based on a high degree of
    in timber prices refer primarily to structural timber that has   automation, which is associated with increases in speed and
    already been sawn. Industrial wood, such as is required for      precision. The offering is geared to timber construction and
    the production of wood fibre insulation materials, has also      prefabricated house companies, which can thus achieve
    become more expensive, but is less affected by the price         advantages in terms of personnel deployment, economic
    increases.                                                       efficiency and construction speed. The STEICO Group will not
                                                                     operate as a house construction company itself.
    A further increase in cost dynamics is expected for the
    second half of the year. The procurement situation is
    particularly tense for auxiliary and operating materials, and
    renewed cost increases are also to be expected for wood.
    STEICO is attempting to compensate for the increased costs
    by raising prices.

8   STEICO Half-Year Report 2021
Half-Year Report 2021

                                                                                                                                                      Natural Fiber Boards
                                                                                                                                                       (Hardboards) 0.8%

          H1 2021: Development Sales by Product Groups in € million                               Timber wholesale 1.1%
       3. COURSE OF BUSINESS7                                               (previous year: € 10.3      million) This
                                                                                                    Miscellaneous   3.1%corresponds to 8.4% of
                   +36.7%*
                                                                            total revenues.     Management
                                                                                           Special  products 3.7% is expecting that the total sales
       H1140
           2021 Revenues by markets
                               2

                                                                            forLaminated
                                                                                 the yearVeneer
                                                                                           will tieLumber
                                                                                                     up to the level of sales in fiscal year 2019
                             129.

       Globally,
          120     markets recovered from the distortion caused by                              (LVL) 10.1%
                                                                            (around € 33 million).
       the COVID-19 pandemic in the first half of 2021. In the
          100                                                               All of other markets also recorded positive growth. Only
                      94.5

       construction sector, timber construction in particular benefits
                                                                            the Scandinavian countries and the USA form an exception.
       due80to its climate-friendly construction methods and high                       I-joists 12.1%
                                                                            Both markets are supplied with specific product ranges,
       energy efficiency.
           60                                                               the distribution of which has been scaled back in favour of
       On the core market of    Germany,+4.9%
                              +54.6%       revenues-28.8%
                                                    increased+45.0%
                                                              once          supplying
                                                                        -0.9%          the European core markets.
                                                                                    +10.4%
           40
       again to € 78.6 million (previous year € 56.7 million). This                     Ecological insulation
                                                 22.6

                                                                 18.9
                                                          18.0

       corresponds
           20         to an increase of 38.6% and a 42.1% share                               materials 69.2%
                                       14.6

                                                                          9.7

                                                                                   6.9

       of total revenues. Sales are being driven across all product
                                                                                                    5.7
                                                                                             3.9

                                                                                                                       2.0
                                                                                                               2.0

                                                                                                                                        1.5
                                                                                                                                 1.3
             €m

       segments, with I-joists showing strong growth rates
                   20 21      20 21      20 21     20 21     20 21     20 21        20 21
       alongside wood-fiber insulation products. STEICO products                                        Rest of World 0.5%
                         er n

                                          LV r

                                                             sts

                                                                                ts

                                                                                                   us

                                                                                                                     ale

                                                                                                                                         rd s
                                       r ( ne

                                                                                                                                      o a rd
                      at io

       are used in both renovation and new construction projects,
                                                                              uc

                                                                                               eo

                                                                                                                 USA 1.5%
                               s

                                            L)

                                                                                                                                           s)
                                                            oi

                                                                                                                  les

                                                                                                                                   db a
                    m ulat

                                    be n
                           ial

                                                                          od

                                                                                                                                ar Bo
                                                           I-j
                                  m Ve

                                                                                              an

                                                                                                               ho

       with renovation applications slightly dominating.
                                                                          pr
                         s

                                                                                             ell

                                                                                                                             ( H i b re
                                Lu t e d
                    l in

                                                                                                             rw

                                                                                                            Italy 3.1%
                                                                        ial

                                                                                         isc
                  ica

                                 ina

                                                                                                                                lF
                                                                                                          be
                                                                    ec

                                                                                         M

                                                                                                                                                Australia 3.8%
                                                                                                                           ra
               og

                                                                                                     Tim
                                                                   Sp
                                m

       France also recorded strong growth of 32.9% to € 26.6
                                                                                                                         tu
                               La
             ol

                                                                                                                     Na
           Ec

       million (previous year: € 20.0 million). This corresponds to                                                                      Alpine Region 4.6%
       14.2% of total revenues. In France, construction activity is                                                   Scandinavian Countries 4.6%
       primarily driven by refurbishment.                                                                                                                                                                Germany
                                                                                                                                         Poland 5.2%
                                                                                                                                                                                                         42.1%
       The United Kingdom is still the most important market for
       I-joists. After a significant slump in the previous year, sales                                                  Remaining Western and
                                                                                                                         Southern Europe 6.0%
       recovered in the first half of 2021. Revenues in the first
       six months were up 51.6% year-on-year to € 15.6 million                                                                             Remaining
                                                                                                                                 Eastern Europe 6.0%

                                                                                                                                        United Kingdom 8.4%
H1 2021: Development Sales by Markets in € million                                                                                                                                   France 14.2%

        +38.6%*
87.5
               78.6

75.0

                                                                                                                                                                                                                       * Rate of change from 2020 to 2021
62.5
        56.7

50.0
                        +32.9%
37.5
                               26.6

                                         +51.6%             +29.5%            +16.0%           +31.2%             -15.2%           +21.3%       +71.9%        +42.6%           -47.4%          +59.9%
25.0
                        20.0

                                                   15.6

                                                                   11.3

                                                                                    11.3
                                         10.3

                                                                                                                  10.1

12.5
                                                                              9.7

                                                                                                     9.6
                                                            8.7

                                                                                                                         8.6

                                                                                                                                          8.6
                                                                                               7.3

                                                                                                                                   7.1

                                                                                                                                                      7.1

                                                                                                                                                                    5.8

                                                                                                                                                                              5.5
                                                                                                                                                4.1

                                                                                                                                                              4.1

                                                                                                                                                                                    2.9

                                                                                                                                                                                                     1.0
                                                                                                                                                                                           0.6
  €m

        20     21       20      21          20     21       20     21         20     21        20       21        20       21      20     21    20     21     20    21        20    21         20    21
               y

                               e

                                                  m

                                                                        ol pe

                                                                   Be Eur ern

                                                                                                     d

                                                                                                                                       tri n

                                                                                                                             te rla n

                                                                                                                                                a

                                                                                                                                                                    ly

                                                                                                                                                                                    A

                                                                                                                                                                                                    ld
             an

                             nc

                                                                                                                                            ali
                                                                                                                                    un ia

                                                                                                                           ch ze gio
                                                                                                    an

                                                                                                                                                                                   US
                                                                                                                                                                   Ita

                                                                                                                                                                                                    or
                                              do

                                                                             d)

                                                                        Lu e

                                                                                                                                          es

                                                                                                                                    te ,
                                                                     t P u ro

                                                                                                                               co inav

                                                                                                                               ns nd
                                                                           th

                                                                                                                                        str
         rm

                         F ra

                                                                     Ne op

                                                                                                  l

                                                                                                                                                                                               W
                                                                                               Po
                                                                          an

                                                                                                                      L i e Sw i t e R e
                                            ng

                                                                          x)

                                                                                                                                      in)
                                                           (in er ou
                                                                   ou E

                                                                                                                                     Au
        Ge

                                                                                                                                                                                           of
                                                                                                                                     d
                                         Ki

                                                               ith ern

                                                                        S

                                                                                                                                 an

                                                                                                                                  in

                                                                                                                                                                                          st
                                       d

                                                             W aing
                                                               cl. n

                                                                                                                     tri Alp
                                                                                                             Sc
                                                            (w East
                                      ite

                                                                                                                                                                                          Re
                                                                   t
                                    Un

                                                        an em
                                                                es

                                                                                                                         a,
                                                   ing

                                                             R
                                                 ain

                                                          d

                                                                                                                  us
                                                                                                               (A
                                              m
                                            Re

       7 All information on the distribution of revenues by market and the
         rates of change compared with the previous year were determined on
         the basis of non-rounded figures.

                                                                                                                                                                          STEICO Half-Year Report 2021             9
Group management report for STEICO SE as of 30 June 2021

                                      4.     GROWTH IN THE PRODUCT SEGMENTS8

                                      The distribution of ecological insulation materials as well as                                        of the year with sales of € 6.9 million (previous year € 9.7
                                      air-injected insulation for building insulation and flooring                                          million) and contributed 3.7% to total sales. These are mainly
                                      is benefiting from the excellent economic situation in the                                            export articles, the sale of which was scaled back in favour of
                                      construction industry, the trend towards timber construction,                                         supplying the European core markets.
                                      the state subsidy programmes for energy-efficient
                                                                                                                                            In the “Miscellaneous” segment - including services and
                                      construction and the increased ecological awareness.
                                                                                                                                            element production - revenues of € 5.7 million were recorded
                                      In the first half of the year, this segment contributed
                                                                                                                                            in the first half of the year (previous year: € 3.9 million).
                                      € 129.2 million or around 69.2% of total revenues (previous
                                                                                                                                            This equals to 3.1% of revenues and an increase of around
                                      year € 94.6 million). This equals to an increase of 36.7%.
                                                                                                                                            45.0%.
                                      Sales of I-joists also recorded very pleasing growth. As
                                                                                                                                            The Timber Wholesale segment generated stable sales of
                                      an alternative product for solid structural timber, I-joists
                                                                                                                                            € 2.0 million (previous year: € 2.0 million).
                                      were able to benefit from the sharp rise in timber prices. In
                                      addition to the traditional core markets of Great Britain and                                         External sales of Natural Fiber Boards (hardboards) for the
                                      Australia, I-joists are also increasingly gaining market share in                                     first half-year were € 1.5 million, up 10.4% compared to the
                                      the continental European markets. In the first half of 2021,                                          previous year (€ 1.3 million). Hardboard is predominantly
                                      revenues totaled € 22.6 million (previous year € 14.6 million).                                       used as a component of I-joists. External sales are no longer
                                      This corresponds to 12.1% of revenues and an increase of                                              of strategic importance and business is only conducted if the
                                      54.6%. In a year-on-year comparison, it should be noted that                                          contribution to margins is positive.
                                      the main markets of the United Kingdom and Australia fell
                                      sharply in the previous year due to the COVID-19 pandemic.

                                      The sale of laminated veneer lumber contributed around
                                      10.1% to total revenues in 2020 (€ 18.9 million; previous
                                      year: € 18.0 million). This corresponds to an increase of
                                      4.9%. The existing plants are being run at full capacity.

                                      The specialty products segment declined in the first half

                                      8 All information on the distribution of revenues by product segment
                                        and the rates of change compared with the previous year were
                                        determined on the basis of non-rounded figures.

                                                                                                                                                                                        Natural Fiber Boards
                                      H1 2021: Development Sales by Product Groups in € million                                                                                          (Hardboards) 0.8%
                                                 +36.7%*                                                                                                                           Timber wholesale 1.1%
 * Rate of change from 2020 to 2021

                                      140                                                                                                                                           Miscellaneous 3.1%
                                                         2
                                                        129.

                                                                                                                                                                             Special products 3.7%
                                      120
                                                                                                                                                                  Laminated Veneer Lumber
                                      100                                                                                                                                      (LVL) 10.1%
                                                 94.5

                                       80

                                       60                                                                                                                                  I-joists 12.1%
                                                                 +54.6%       +4.9%            -28.8%          +45.0%           -0.9%            +10.4%
                                       40
                                                                       22.6

                                                                                     18.9
                                                                              18.0

                                       20
                                                                14.6

                                                                                               9.7

                                                                                                                                                                           Ecological insulation
                                                                                                     6.9

                                                                                                                     5.7
                                                                                                               3.9

                                                                                                                                       2.0
                                                                                                                                2.0

                                                                                                                                                       1.5
                                                                                                                                                 1.3
                                        €m

                                                                                                                                                                               materials 69.2%
                                                  20    21       20    21     20     21        20    21        20    21         20     21        20    21
                                                     er n

                                                                       LV r

                                                                                   sts

                                                                                                     ts

                                                                                                                     us

                                                                                                                                      ale

                                                                                                                                                         rd s
                                                                    r ( ne

                                                                                                                                                      o a rd
                                                  at io

                                                                                                  uc

                                                                                                                 eo
                                                           s

                                                                         L)

                                                                                                                                                           s)
                                                                                oi

                                                                                                                                 les

                                                                                                                                                   db a
                                                m ulat

                                                                 be n
                                                       ial

                                                                                               od

                                                                                                                                                ar Bo
                                                                               I-j
                                                               m Ve

                                                                                                                an

                                                                                                                                ho

                                                                                                                                                                                            Rest of World 0.5%
                                                                                             pr
                                                     s

                                                                                                               ell

                                                                                                                                             ( H i b re
                                                             Lu t e d
                                                l in

                                                                                                                            rw
                                                                                            ial

                                                                                                           isc

                                                                                                                                                                                                   USA 1.5%
                                             ica

                                                              ina

                                                                                                                                                lF
                                                                                                                           be
                                                                                          ec

                                                                                                           M

                                                                                                                                            ra
                                            og

                                                                                                                      Tim
                                                                                       Sp
                                                          m

                                                                                                                                        tu
                                                        La
                                           ol

                                                                                                                                                                                            Italy 3.1%
                                                                                                                                      Na
                                       Ec

                                                                                                                                                                                    Australia 3.8%
10                                    STEICO Half-Year Report 2021                                                                                                          Alpine Region 4.6%
                                                                                                                                                                Scandinavian Countries 4.6%
Half-Year Report 2021

III. NET ASSETS, FINANCIAL POSITION AND                            In a comparison with the previous year, it should be noted
     RESULTS OF OPERATIONS                                         that the second quarter of 2020 in particular was weaker due
                                                                   to the impact of the first wave of the COVID-19 pandemic.

1.   RESULTS OF OPERATIONS
                                                                   2.   FINANCIAL POSITION AND NET ASSETS
As a production and marketing company for wood-fibre
                                                                   Consolidated total assets increased substantially as of 30 June
insulation materials the STEICO Group has been able to once
                                                                   2021 to around € 398.2 million compared to 30 June
again increase its revenues year-on-year. Revenues in the
                                                                   2020 (€ 365.3 million). Property, plant and equipment has
first six months increased by 29.6% from € 144.2 million to
                                                                   increased to € 270.8 million (previous year: € 251.3 million),
€ 186.8 million. Total operating revenue in the first half of
                                                                   which is mostly due to the ongoing capital expenditure to
2021 was 30.4% higher at € 185.5 million (previous year:
                                                                   expand production capacity.
€ 142.3 million) .
                                                                   Inventories totalled € 37.8 million on 30 June 2021 (previous
The cost of materials ratio (in terms of total operating
                                                                   year: € 39.7 million). While the items raw materials,
revenue) fell in H1 2021 to 53.6% (previous year: 55.6%).
                                                                   consumables and supplies as well as work in progress
This is due, among other things, to the price increases as well
                                                                   increased significantly, the value of the item finished goods
as synergy effects resulting from the high capacity utilization.
                                                                   and merchandise fell substantially. Both are due to the high
The personnel expenses ratio in the first six months was           demand and the expansion of production.
16.3% (previous year: 17.8%) and has thus fallen slightly –
                                                                   Receivables and other assets increased and totaled € 55.3
due to the strong revenue growth.
                                                                   million (previous year: € 47.8 million), reflecting the high
Other operating expenses amounted to € 17.9 million                order book at the end of the year.
(previous year: € 16.7 million) and grew by 7.6% – a
                                                                   On 30 June 2021 the item cash in hand and bank balances
disproportionate increase compared to total operating
                                                                   amounted to € 29.3 million (previous year: € 21.3 million).
revenue. This is due in particular to lower professional and
                                                                   The increase is partly a result of strong operating cash flows.
travel expenses as well as exchange rate differences and
incidental costs for payments.                                     The equity and liabilities side is characterised by liabilities
                                                                   to banks to € 116.8 million (previous year: € 126.1 million).
The financial result in H1 2021 was negative at € 0.6 million
                                                                   Loans were repaid as a result of the strong cash flow from
(previous year: € -0.6 million) and is mostly governed by the
                                                                   operating activities.
interest expenses due to financing the ongoing investment
activities as part of the current syndicated credit agreement.     On 30 June 2021 equity amounted to € 233.3 million
                                                                   (previous year: € 201.0 million). This corresponds to an equity
Total earnings (consolidated profits) amounted to
                                                                   ratio of around 53.2% (31 December 2020: 53.0%).
€ 21.1 million in 2017 (previous year: € 7.5 million). This
corresponds to an increase of 181.5%.

Second quarter 2021 – viewed in isolation

Revenues of € 96.2 million were recorded in the second
quarter (previous year: € 69.7 million) This corresponds to
an increase of 37.9%. Total operating revenues amounted to
€ 97.2 million (previous year: € 69.8 million)

Gross profits amounted to € 46.8 million (previous year:
€ 31.9 million).

EBITDA in the second quarter increased by 93.3% to € 22.4
million (previous year: € 11.6 million). EBIT lifted by 180.7%
to € 17.3 million (previous year: € 6.2 million). The EBITDA
margin is 23.0% (previous year: 16.6%), the EBIT margin is
17.8% (previous year: 8.9%).

                                                                                                        STEICO Half-Year Report 2021   11
Group management report for STEICO SE as of 30 June 2021

           3.    LIQUIDITY                                                                         Summary of the economic position

                                                                                                   In summary, from the managing directors' perspective,
 H1 2021: Cash flows in € millions                                                                 STEICO SE is very well positioned for future growth, in
                                                                                                   particular as a result of its product range structure, its large,
 90
                                                                                                   integrated production sites and the intensification of sales.
 75                                                                                                Both the income statement and also the balance sheet show
                                                                                                   a healthy group with continued strong growth potential.
 60                        33.5          -5.7
                                                       -22.0                                       Investments in the development of further production
 45                                                                                                capacities should also lay the foundation for sustained future
                                                                     0.4        29.3
                                                                                                   growth. To this end, STEICO is continuously considering
 30             23.1                                                                               various options – from creating additional capacity at existing
 15                                                                                                sites to setting up new sites in the domestic market and
                                                                                                   abroad.
 €m

                           tiv om

                           tiv om

                                     ge

                              rio t
                              rio t

                           tiv om

                           pe ts a
                           pe ts a

                                  es

                                  es

                                   d
                                   d

                                  es

                                an
                        ac fr

                        ac fr
                        ac fr

                      th len
                      th len

                              iti

                              iti
                              iti

                             ch
                    ing flow

                      g w
                      g w

                                                                                                   IV. FINANCIAL AND NON-FINANCIAL
                  tin flo
                  cin flo

                  of uiva
                  of iva

                          ed

                         e
                         e
                rt qu

                      lat
              er sh

                es sh
               an sh

                                                                                                       PERFORMANCE INDICATORS
             en eq
          o p Ca

            inv a
           sta e

           fin Ca

                   re
                   C

                  h
         e sh

                 at

               ge

       th as
                d
      th ca

              c
            an

           d
           d

         ch

          e
        an
       an

     Ex

    sh
sh

                                                                                                   1.     NON-FINANCIAL PERFORMANCE INDICATORS
 Ca
Ca

           Cash flow from operating activities                                                     The following non-financial performance indicators are
                                                                                                   collected and evaluated, but are not used for detailed
           In H1 2021, the STEICO Group recorded a cash flow from
                                                                                                   corporate management purposes.
           operating activities of € 33.5 million (2020 as a whole:
           € 42.9 million). As a result of the high demand and strong                              Environmental protection
           growth, a significantly higher cash flow from operating
                                                                              As a sales company with an extensive product range of
           activities was recorded compared to previous years.
                                                                              environmentally friendly products, the STEICO Group places
     CapexCash
            und flow
                  Abschreibungen       in Mio.  €
                          from investing activities                           great value on having a low environmental impact and
                                                                              saving natural resources. The wood from which STEICO’s
          The cash flow from investing activities totaled € -22.0 million193%
      50                                287%           230%                   products are202%
                                                                                            made originates from sustainably managed
          in the first six months of 2021 (2020 as a whole: € -44.446,8              47,2
               Investitionen in     45,6            45,6                      forests, which are mostly certified according to the well-
      45 million)    and is mostly due to payments made for investments
               Sachanlagen
                                                                              known organisations FSC® (Forest Stewardship Council) or
          in property, plant and equipment, in particular for projects to
      40       Abschreibungen                                                 PEFC  (Programme for the Endorsement of Forest Certification
          increase     capacity.
                                                                              Schemes). Continuous certification in accordance with the
      35
          Cash flow from financing activities                                 FSC standards has already been agreed until 2025.
                                                                                                             Wachstum

      30              163%from financing activities is negative at € 5.7
           The cash flow                                                                           The IBR seal means that STEICO’s insulation materials have a
                  25,3
      25   million (previous year: € +4.4 million). The change is mainly                    24,2 recognised seal
                                                                                                             23,4of   quality for environmentally friendly, safe
           due to the repayment of financial loans and the19,8dividend                             and functional construction products. In addition, STEICO SE
      20
           payment.                                                                                holds an environmental product declaration (EPD) for all of its
                        15,5                    15,9
      15                                                                                           key products, which offers additional proof of its dedication
           As of 30 June 2021 the STEICO Group’s cash and cash
                                                                                                   to sustainability.
           equivalents totaled € 29.3 million (31 December 2020:
                                                                                                             Erhaltung

      10
           € 23.1 million) which are deposited in overnight money, fixed                           An environmental management system according to ISO
       5
           accounts and current accounts. The group pursues a risk-                                14001:2015 has been put in place at the Polish production
           minimising investment approach which ensures that liquidity                             plants.
      €m

           is guaranteed until it is used for further investments.
                                                                                                   Products from STEICO’s range are tested regularly by the
                  LV 016

                                           (LD ase 7

                                                                 zie 18

                                                                                        rti nz 9

                                                                                                         Dä Hol zien 020
                                        ffe lzf 201

                                                                                     tfe zie 01
                    L2

                                              F 2 r-

                                                                    nz

                                                                                           gu +

                                                                                                           m zfa z +
                                                               Effi 20

                                                                                                   well-known consumer magazine ÖKO-TEST and have always
                    2

                                                                                  en ffi 2

                                                                                                               Effi 2
                                                 )

                                                                                             ng

                                                                                                              s t o r-
                                                                                                            m se
                                                                                                                   ffe

                                                                                                   received the grade of “very good” in the past.
                                     sto Ho

                                                               e-

                                                                                m e-E
                                                          gi

                                                                                                            e-
                                 m 2+

                                                         er

                                                                           E l e rg i

                                                                                                        gi

                                                                                                   The STEICO Group has also published an annual sustainability
                                                                                                        er
                                                        En

                                                                                e
                               Dä LVL
                                   m

                                                                             En

                                                                                                    En

                                                                                                                         Technisches Handbuch STEICO construction

     12    STEICO Half-Year Report 2021
Half-Year Report 2021

report since 2018, which is based on the internationally
recognized GRI (Global Reporting Initiative) reporting
standard for the first time in the 2020 reporting period as a
core component.

Protecting the environment is one of the key basic pillars of
STEICO’s corporate philosophy. The STEICO Group uses its
activities and awards to show that growth and sustainability
can go hand in hand and thus reinforces its position as a
provider of an environmentally friendly construction system,
based on wood The STEICO Group therefore strives to
continue and expand relevant environmental certifications.

C. OPPORTUNITY AND RISK REPORT,
   FORECAST
The comments in the opportunity and risk report and in the
forecast are, by their very nature, associated with a certain
degree of forecasting uncertainty. Please refer to STEICO's
2020 Annual Report for a detailed presentation of risks and
opportunities.

I.   FORECAST

Due to the friendly market environment, growth is expected
to continue in the second half of 2021 – although growth
rates are likely to be somewhat lower due to the already very
strong second half of the previous year.

Management is therefore raising its expectations for the
current fiscal year. Unless there are additional negative effects
from developments in the pandemic, the Board of Directors
believes that in 2021 revenues will lift by around 20% with
an EBIT ratio between 14.0% and 17.0% (in terms of total
operating revenue).

                                                                             STEICO Half-Year Report 2021   13
STEICO Half-Year Report 2021

                                    This Pages does not have any content for technical reasons

14   STEICO Half-Year Report 2021
Half-Year Report 2021

Consolidated income statement 1 January - 30 June 2021

                                                                                                H1 2021                 H1 2020
                                                                                                       €                        €

 1.   Revenues                                                                            186,787,957.74          144,163,570.43
 2.   Increase in finished goods and work in progress                                       -1,258,512.23           -1,941,333.65
 3.   Other own work capitalised                                                                8,593.45               75,125.19
                                                                                          185,538,038.96         142,297,361.97

 4.   Other operating income                                                                3,427,367.74            2,559,599.78

                                                                                          188,965,406.70         144,856,961.75

 5.   Cost of materials
      a) Cost of raw materials, consumables and supplies and for purchased goods           -99,117,940.85         -78,988,477.30
      b) Cost of purchased services                                                          -255,864.66             -171,117.18

 6.   Gross profits                                                                        89,591,601.19          65,697,367.27

 7.   Personnel expenses
      a) Wages and salaries                                                                -24,925,082.26         -20,415,662.93
      b) Social security and expenses for retirement benefits                               -5,356,287.48           -4,918,184.37
 8.   Amortisation of intangible fixed assets and depreciation of tangible fixed assets    -10,222,482.80          -11,485,329.75
 9.   Other operating expenses                                                             -17,938,765.00          -16,667,785.00

 10. EBIT                                                                                  31,148,983.65          12,210,405.21

 11. Other interest and similar income                                                        272,251.69              251,445.24
 12. Interest and similar expenses                                                           -847,641.34             -853,736.48
 13. Financial result                                                                        -575,389.65             -602,291.24

 14. Earnings before taxes                                                                 30,573,594.00           11,608,113.97

 15. Income taxes                                                                           -8,028,938.63           -2,843,100.04

 16. Earnings after taxes                                                                  22,544,655.37            8,765,013.94

 17. Other taxes                                                                            -1,462,371.08           -1,275,277.63

 18. Consolidated net income                                                               21,082,284.29            7,489,736.30

 19. Profit carried forward from previous year                                             86,170,576.06           67,425,018.21
 20. Consolidated profits                                                                 107,252,860.35           74,914,754.51

                                                                                                      STEICO Half-Year Report 2021   15
STEICO Consolidated Balance Sheet as of 30 June 2021

          | ASSETS
                                                                                                         30.06.2021       31.12.2020
                                                                                                                  €                €

     A.    NON-CURRENT ASSETS
           I.     Intangible assets
                  1. Self-generated industrial property rights and similar rights and assets              364,580.59             0.00
                  2. Acquired concessions, industrial property rights and similar rights and assets
                     as well as licenses for such rights and assets.                                      347,669.37       908,582.39
                  3. Advance payments made                                                                124,112.20        85,072.50
                                                                                                         836,362.16       993,654.89

           II.    Property, plant and equipment
                  1. Land, land rights and buildings including
                     buildings on third-party land                                                     83,282,099.12    82,855,524.17
                  2. Technical plant and machinery                                                    121,143,287.17   125,661,746.98
                  3. Other assets, operating and office equipment                                       1,943,154.55     2,100,348.15
                  4. Advances made and assets under construction                                       64,433,515.05    45,940,008.24
                                                                                                      270,802,055.89   256,557,627.54
           III.   Financial assets
                  1. Interests in affiliated companies                                                      1,975.62         1,958.47
                  2. Loans to affiliated companies                                                         13,716.51        13,597.37
                  3. Other loans                                                                           10,750.00         8,000.00
                                                                                                           26,442.13        23,555.84

                                                                                                      271,664,860.18   257,574,838.27

       B. CURRENT ASSETS
           I.     Inventories
                  1. Raw materials, consumables and supplies                                           21,648,354.00    19,976,968.08
                  2. Work in progress                                                                   2,957,391.15     1,974,698.60
                  3. Finished goods and merchandise                                                    12,270,482.56    16,321,540.42
                  4. Advance payments made                                                                902,446.52       979,974.34
                                                                                                       37,778,674.23    39,253,181.44

           II.    Receivables and other assets
                  1. Trade receivables                                                                 36,230,295.89    25,715,665.87
                  2. Receivables from affiliated companies                                                  3,524.99         1,810.48
                  3. Other assets                                                                      19,094,628.75    15,485,407.52
                                                                                                       55,328,449.63    41,202,883.87

           III.   Securities
                  Other securities                                                                        571,626.16       221,861.43

           IV.    Cash in hand and bank balances                                                       29,321,567.44    23,088,258.59

                                                                                                      123,000,317.46   103,766,185.33

       C. PREPAID EXPENSES                                                                              3,181,583.96     1,563,567.31

      D. DEFERRED TAX ASSETS                                                                             356,541.25       444,188.11

                                                                                                      398,203,302.85   363,348,779.02

16   STEICO Half-Year Report 2021
Half-Year Report 2021

     | EQUITY AND LIABILITIES
                                                                     30.06.2021             31.12.2020
                                                                              €                       €

A.    EQUITY
      I.     Subscribed capital                                    14,083,465.00         14,083,465.00
      II.    Additional paid-in capital                           104,911,923.60        104,911,923.60
      III.   Retained earnings
             Other retained earnings                                7,050,000.00          7,050,000.00
      IV.    Difference in equity from currency translation       -21,509,201.89        -23,946,507.27
      V.     Consolidated profits                                 107,252,860.35         90,395,615.86
                                                                  211,789,047.06        192,494,497.08

B.    PROVISIONS
             1. Provisions for pensions and similar obligations     3,135,348.47           2,912,987.22
             2. Provisions for taxes                                4,014,298.37            272,794.24
             3. Other provisions                                   18,080,324.04          12,007,297.63
                                                                   25,229,970.88         15,193,079.09

C.    LIABILITIES
             1. Liabilities to banks                              116,764,277.00        117,433,921.00
             2. Advance payments received on account of orders        130,921.78            288,120.82
             3. Trade payables                                     23,414,042.21          22,925,590.95
             4. Liabilities to affiliated companies                 3,017,125.00           5,018,750.00
             5. Other liabilities                                  16,782,681.51           8,903,614.42
                                                                  160,109,047.50        154,569,997.19

D.    DEFERRED INCOME                                                119,411.83             130,833.54

E.    DEFERRED TAX LIABILITIES                                       955,825.58             960,372.12

                                                                  398,203,302.85        363,348,779.02

                                                                              STEICO Half-Year Report 2021   17
STEICO Consolidated cash flow statement H1 2021

                                                                                                                            01.01.-30.06.2021 01.01.-31.12.2020
                                                                                                                                           €                 €

     I.     CASH FLOW FROM OPERATING ACTIVITIES
            1.           Earnings for the period (consolidated net income / loss)                                             21,082,284.29     22,970,597.65
            2.   +/-     Amortization / depreciation of non-current assets                                                    10,222,482.80     23,437,260.37
            3.   +/-     Increase / decrease in provisions                                                                     6,239,519.66       2,601,711.10
            4.   +/-     Other non-cash expense / income                                                                           -8,593.45       -109,866.07
            5.   -/+     Increase/decrease in inventories, trade receivables and other
                         assets that are not allocated to investing or financing activities                                  -14,618,839.93      -1,519,030.68
            6.   +/-     Increase/decrease in trade payables and other liabilities that are not allocated to investing or
                         financing activities                                                                                  6,197,272.60      -2,090,705.33
            7.   +/-     Gains / losses from the disposal of non-current assets                                                    3,322.60        -230,006.33
            8.   +/-     Interest expense / income                                                                               575,389.65       1,182,816.49
            9.   +/-     Income tax expense / income                                                                           8,028,938.63       6,967,060.42
            10. -/+      Income tax payments                                                                                  -4,204,334.18     -10,304,188.28
            11. =        Cash flow from operating activities                                                                 33,517,442.67      42,905,649.34

     II.    CASH FLOW FROM INVESTING ACTIVITIES
            1.       -   Payments made for investments in intangible non-current assets                                         -175,526.46      -2,019,956.54
            2.       +   Proceeds received from disposals of items of property, plant and equipment                               76,220.15       4,115,365.60
            3.       -   Payments made for investments in property, plant and equipment                                      -22,152,631.48     -47,244,083.35
            4.       +   Proceeds received from disposals of financial assets                                                           0.00        167,228.47
            5.       -   Payments made for investments in financial assets                                                         -2,750.00              0.00
            6.       +   Interest received                                                                                       272,251.69         540,468.77
            7.       =   Cash flow from investing activities                                                                -21,982,436.10     -44,440,977.05

     III.   CASH FLOW FROM FINANCING ACTIVITIES
            1.   +       Proceeds received from taking out (financial) loans                                                   5,667,910.00     22,335,514.00
            2.   -       Payments made from redeeming (financial) loans                                                       -6,337,554.00     -12,675,108.00
            3.   -       Interest paid                                                                                          -791,773.34      -1,760,577.49
            4.   -       Dividends paid to shareholders of the parent company                                                 -4,225,039.50      -3,520,866.25
            5.   =       Cash flow from financing activities                                                                  -5,686,456.84      4,378,962.26

     IV. CASH AND CASH EQUIVALENTS
            1.           Net change in cash and cash equivalents                                                               5,848,549.73       2,843,634.55
            2.   +/-     Exchange-rate related change in cash and cash equivalents                                               384,759.12      -1,877,261.16
            3.   +       Cash and cash equivalents - start of period                                                          23,088,258.59     22,121,885.20
            4.   =       Cash and cash equivalents - end of period                                                           29,321,567.44      23,088,258.59

18   STEICO Half-Year Report 2021
Half-Year Report 2021

Notes to the consolidated financial statements as of 30 June 2021

I.   GENERAL INFORMATION ON THE                                    longer apply, these are written up according to Section 253
     CONSOLIDATED FINANCIAL STATEMENTS                             (5) sentence 1 of the HGB.

                                                                   Inventories are measured at cost. Items with impaired
1.   LEGAL FOUNDATIONS                                             marketability are written down to their lower fair value.

The regulations set out in Sections 294 ff. of the                 As a rule, receivables and other assets are carried at face
Handelsgesetzbuch (HGB - German Commercial Code)                   value.
apply for the consolidated financial statements. The
                                                                   In order to cover the risk of default, individual and lump-sum
consolidated financial statements are prepared based on legal
                                                                   write-downs are formed for receivables to the extent
requirements.
                                                                   required. When forming individual write-downs, the company
                                                                   takes into account the fact that some receivables are covered
2.   CONSOLIDATED ACCOUNTING AND VALUATION
                                                                   by commercial credit insurance.
     METHODS
                                                                   Securities under current assets are carried at acquisition cost
The Group applies the principles of the German Commercial
                                                                   or at their lower fair value.
Code for its accounting and valuation methods. According to
Section 308 (1) of the HGB, the assets and liabilities included    Cash in hand and bank balances are carried at face value.
on the consolidated balance sheet are subject to a uniform
                                                                   Expenses prior to the balance sheet date that relate to
valuation in line with the valuation methods which apply for
                                                                   expenses for a limited period after the balance sheet date are
the parent company’s annual financial statements.
                                                                   carried as prepaid expenses. The accounting option offered
The consolidated balance sheet and consolidated income             in Section 250 (3) Sentence 1 of the HGB to form a discount
statement are classified according to Sections 266, 275 (2) of     has been used. The item is reversed using the straight-line
the HGB in connection with Section 298 of the HGB.                 method in line with time.

The following individual accounting and valuation                  Deferred tax assets result from temporary differences
methods were applied:                                              between tax losses carried forwards and consolidation. The
                                                                   tax relief resulting at an individual company level has been
Intangible assets are capitalised at cost and subject to           capitalised according to the option offered in Section 274 in
scheduled amortisation over their expected useful lives.           connection with Section 306 of the HGB.
Patents, concessions, licenses and software are written down
                                                                   Provisions for pensions are calculated on the balance sheet
over 2-5 years, rights of usufruct are written down over 20
                                                                   date in line with Section 253 (2) of the HGB using the
years.
                                                                   projected unit credit method based on an average market
Property, plant and equipment is valued at cost according          interest rate and an assumed residual period of 15 years.
to Section 253 of the HGB in connection with Section 255           This is announced by Deutsche Bundesbank in line with the
of the HGB, less scheduled depreciation in line with the           corresponding legal provisions. On the balance sheet date
standard useful lives in the industry.                             this liability was netted with the re-insurance in line with
                                                                   Section 246 (2) Sentence 2 of the HGB. The netted assets are
Buildings are depreciated using the straight-line method,
                                                                   valued at fair value according to Section 253 (1) Sentence 4
with both the straight-line and declining balance methods
                                                                   of the HGB.
being used for machines. Office equipment and IT hardware
is written down using both the straight-line and declining         Provisions for taxes and all other provisions are formed for
balance methods.                                                   all recognizable risks and uncertain liabilities in the amount
                                                                   required for fulfillment according to prudent commercial
Low-value items of property, plant and equipment have
                                                                   judgement. The amount required for fulfillment is calculated
been written off immediately through profit and loss since
                                                                   taking future price and cost increases into account.
1 January 2011.
                                                                   Provisions with a remaining term of more than one year are
As a rule, financial assets are carried at cost or, in the event
                                                                   discounted over their remaining term in line with the average
of permanent impairment, at their lower fair value on the
                                                                   market interest rate for the past seven fiscal years (Section
balance sheet date.
                                                                   253 (2) Sentence 1 of the HGB).
If the reasons for maintaining a lower carrying amount no
                                                                   Liabilities are included at their repayment amounts.

                                                                                                        STEICO Half-Year Report 2021   19
Notes to the consolidated financial statements as of 30 June 2021

     Deferred tax liabilities result from temporary differences       4.   SUPERVISORY BOARD
     to the carrying amounts in the tax base for the companies
                                                                      STEICO’s Supervisory Board comprises 4 members.
     included.
                                                                      Mr. Udo Schramek, Munich, Chairman, Managing Director
     3.   CURRENCY TRANSLATION                                        and Chairman of the Supervisory Board

     Receivables and liabilities denominated in foreign currencies    Prof. Heinrich Köster, Stephanskirchen, President of
     are translated using the exchange rate on the date of the        Rosenheim University
     transaction. Assets and liabilities denominated in foreign
                                                                      Ms Katarzyna Schramek, Munich, attorney
     currencies with a residual period of less than one year are
     subsequently valued on the balance sheet date using the          Dr. Jürgen Klass, Munich, attorney
     average spot exchange rate on the balance sheet date.
                                                                      5.   DIRECTORS
     Foreign statements prepared in foreign currencies for the
     Group’s subsidiaries in Poland and England are translated        Mr. Udo Schramek, Munich, Chairman and Managing
     using the “modified balance sheet date method” set out in        Director of STEICO SE
     Section 308a of the HGB.
                                                                      Managing director for Auditing, Marketing, Research &
     With the exception of equity, items on the balance sheet are     Development, Technology, Quality Assurance, Business
     translated using the rate on the balance sheet date; items       Development, IT and Purchasing, Legal & HR and IT
     in the income statement are translated using the average
                                                                      Mr. Thorsten Leicht, Landshut Managing Director for
     exchange rate for the fiscal year; equity is translated using
                                                                      Production, Processes, and Quality- and Sustainability
     the historical rate.
                                                                      Management
     The parent company’s functional currency is the group’s
                                                                      Mr. Uwe Lange, Berga, Managing Director for Investments
     currency (euros).
                                                                      and Equipment Technology
     Differences in the consolidation of liabilities resulting from
                                                                      Dr. David Meyer, Munich, Managing Director for Finance,
     exchange rates are taken directly to equity under Currency
                                                                      Accounting & Controlling
     translation differences.
                                                                      Mr. Milorad Rusmir, Kirchheim, Managing Director for Timber
     The exchange rates for PLN/€ are:
                                                                      Wholesale
     Closing rate on 30 June 2021:           4.52010
                                                                      Mr. Tobias Schindler, Sistrans (Austria), Managing Director for
     Average rate in 2021:		                 4.54483
                                                                      Sales
     The exchange rates for GBP/€ are:

     Closing rate on 30 June 2021:           0.85805
     Average rate in 2021:		                 0.86554

20   STEICO Half-Year Report 2021
You can also read