The only thing we have to fear is the lack of fear itself - Merrill Lynch
←
→
Page content transcription
If your browser does not render page correctly, please read the page content below

2021 Equity Technical Year Ahead
The only thing we have to fear is the lack
of fear itself
Market Analysis

The only thing we have to fear is (the lack of) fear itself                                          13 December 2020

As we move into 2021, the weight of the evidence is bullish. Broadly positive Trend,                 Market Analysis
Breadth, Seasonality, Volume, Credit, Momentum and Macro indicators support                          United States
continued upside into 2021. However, the only thing we have to fear is the lack of fear
itself. Sentiment shows capitulation from AAII Bulls and complacent put/call ratios. This
is a risk within an otherwise bullish backdrop, but not all investors are too bullish. S&P
500 (SPX) futures positioning for large speculators and asset managers is not
aggressively long, which does not rule a bullish catch-up trade into 2021.

SPX: Tactical triangle suggests 3800s into early 2021
The SPX broke out from the bullish triangle pattern that we highlighted heading into the
US Presidential Election. This triangle projects further upside to 3830 (measured move)
and 3885 (triangle count) into early 2021. The prior highs from September-October at
3588-3550 offer support, but the triangle breakout stays intact above 3500.

Secular bull market points higher after “7-year itch”                                                Stephen Suttmeier, CFA, CMT
                                                                                                     Technical Research Strategist
After “7-year itch” corrections in 1957 and 1987, the SPX continued its secular bull                 BofAS
                                                                                                     +1 646 855 1888
markets from 1950 and 1980 to 1966 and 2000, respectively. 2020 is the “7-year itch”                 stephen.suttmeier@bofa.com
for the secular bull market from 2013. Secular bull market overlays suggest that SPX
4000+ is not ruled out in early 2021 but is more likely and sustainable in early to mid
2022. The 2020 cup and handle corroborates SPX 4000+, and this pattern’s breakout
point near 3200 is big 2021 support. In addition, 2020 was one of the 41 years going
back to 1928 with a 10%+ YTD drawdown. The following years show stronger than
average returns, especially during secular bull markets. This bodes well for 2021.

Rotation, rotation, rotation
Other than politics, the most contentious 2020 debate among investors is whether or
not to rotate into Value and away from Growth. Moving into 2021 a double top favors
Value over Growth on a tactical basis, but as we have highlighted throughout 2H 2020,
the Value trade may be more about High Beta (aka cyclicals). The GICs level 1 sector
relative rotation chart (RRG) shows a pause for Growth, bullish rotation for Cyclicals and
bearish rotation for Defensives. If our FICC 2021 Year Ahead trend views of short USD,
short US treasuries and long commodities prove to be correct, these rotations, which are
the lifeblood of a bull market, have the potential to persist well into 2021.

Technical Globetrotting
The S&P 500 remains within a long-term leadership trend relative to MSCI ACWI ex-US,
but the rest of the world has become more competitive with the US since the March
2020 low. If the US is to top out relative to the rest of the world in 2021, the US Dollar
Index likely needs to confirm its big double top. Emerging Markets broke out from a 2-
year+ base, which bodes well for EM in 2021. In addition, EM has the potential for a big
13-year triangle breakout that could usher in a secular bull market for EM. We also
highlight bullish setups for Italy, Spain, Turkey and Russia in Europe and Japan, Taiwan,
China and India in Asia. More 2021 Year Ahead views and charts inside the report.

BofA Securities does and seeks to do business with issuers covered in its research reports. As
a result, investors should be aware that the firm may have a conflict of interest that could
affect the objectivity of this report. Investors should consider this report as only a single
factor in making their investment decision.
Refer to important disclosures on page 26 to 27.                                          12220474

Timestamp: 13 December 2020 05:00PM EST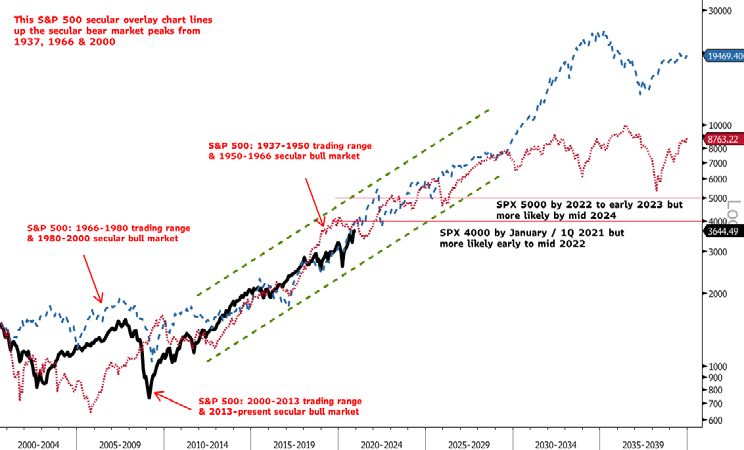
Contents
Indicator weight of the evidence is bullish                           3
       The only thing we have to fear is (the lack of) fear itself    3
S&P 500                                                               6
       SPX: Tactical triangle suggests 3800s into early 2021          6
Secular trend points higher                                           7
       2020, 1987 and 1957 = 7-year itch in a secular bull market     7
       Secular overlays: SPX 4000+ not ruled out in 2021              8
       But SPX 4000+ more likely in early to mid 2022                 8
       2020 cup and handle corroborates SPX 4000+                     9
       Big 2021 SPX support: 3200                                     9
Bigger drawdowns precede better years                                10
       SPX stronger after years with 10%+ drawdowns                  10
       Secular bull upside after years with 10%+ drawdowns           11
Better Presidential Cycle scenarios                                  12
       2021 features better Presidential Cycle Year 1 scenarios      12
Weekly HY vs IG ratio: Bottom breakout                               13
       2020 low for weekly HY vs IG ratio confirmed risk-on          13
       Weekly HY vs IG bottom breakout bullish for 2021              13
Russell 2000 and NASDAQ 100                                          14
       Russell 2000: Post-election breakouts: 2020, 2016 & 2012      14
       NDX: Bullish triangle breakout targets 13,500-13,630          15
       RTY leads as NDX stalls relative to the SPX                   15
Rotation, rotation, rotation                                         16
       Growth corrects vs Value                                      16
       Lows for High Beta vs Value confirm major lows for SPX        17
       Sectors: The 3 Rs: Ranks, Relatives and Rotations             18
Technical Globetrotting                                              19
       Bullish breakout for global breadth at the index level        19
       US leadership, but other markets competitive in 2020          20
       Bottoming signs for EM vs SPX                                 20
       The US Dollar likely holds the key for US vs ROW              21
       Bullish setups: FTSEMIB, IBEX, XU100 and IMOEX                23
       Bullish setups: NKY, TWSE, SHCOMP and SENSEX                  24
Indicator checklist                                                  25
       Weight of the evidence is bullish                             25

2     2021 Equity Technical Year Ahead | 13 December 2020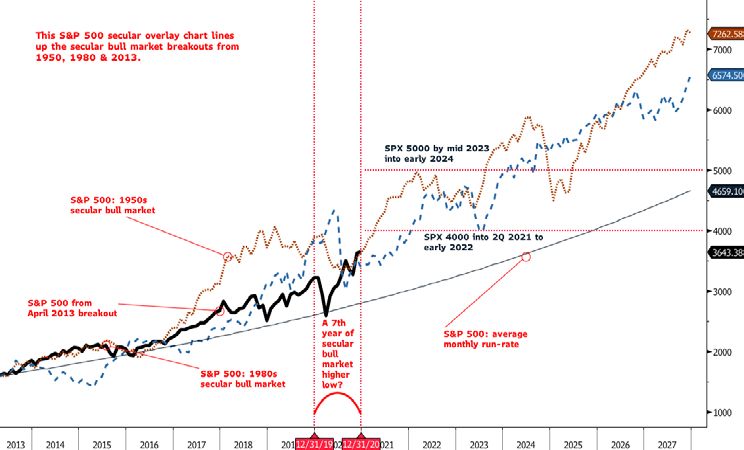
Indicator weight of the evidence is bullish
The only thing we have to fear is (the lack of) fear itself
The weight of the evidence is bullish. Broadly positive Trend, Breadth, Seasonality,
Volume, Credit, Momentum and Macro indicators support continued upside into 2021.
Some sentiment indicators have become more complacent, which means that the only
thing we have to fear is the lack of fear itself. AAII Bulls capitulated in November, total
put/calls are complacent and the Net Tab is overbought. This is a 2021 risk, but not all
investors are bullish. S&P 500 (SPX) futures positioning shows that large speculators
neutralized a net long and asset managers are well below the aggressive net long levels
associated with prior SPX peaks in early 2020, 2018 and 2011. In other words, futures
positioning does not rule a bullish catch-up trade into 2021.

Risk: AAII Bulls and CBOE total put/calls hit contrarian bearish extremes
AAII Bulls capitulated above 50 in November. 5-day put/call deeply complacent.

Chart 1: Investors finally got bullish with AAII Bulls spiking above 50.     Chart 2: Contrarian bearish 5-day total put/call ratio; lowest since 2006.

Source: BofA Global Research, Bloomberg                                      Source: BofA Global Research, Bloomberg

But catch-up trade potential with SPX futures positioning not aggressively long
Large specs neutralized a net long. Asset managers not aggressively long.

Chart 3: Silver lining: Large specs not aggressively long SPX futures.       Chart 4: Asset managers’ SPX futures net long well below peak levels.

Source: BofA Global Research, Bloomberg                                      Source: BofA Global Research, Bloomberg

                                                                                               2021 Equity Technical Year Ahead | 13 December 2020        3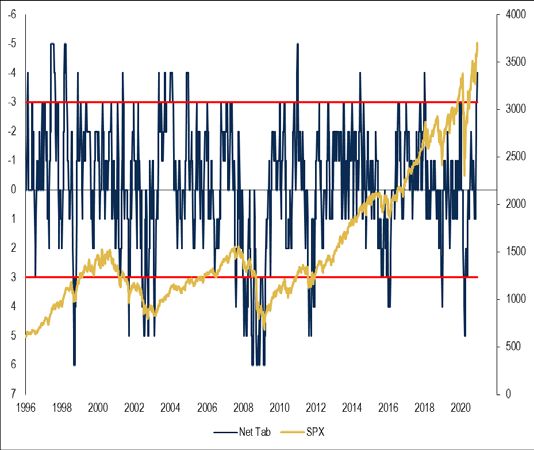
Dow Theory says primary uptrend and monthly MACD remains solidly bullish
Unlike in early 2020, just ahead of the COVID-19 correction, late 2020 has new highs for
both the Dow Industrials and Transports, which confirms a bull market. Monthly MACD is
on a July 2020 buy signal and looks strong as we move toward 2021. The 12-month MA
near 3200 is a key 2021 risk management support.

Chart 5: Dow Theory bullish on new highs for Industrials and Transports.   Chart 6: Monthly MACD remains on a bullish signal from July 2020.

Source: BofA Global Research, Bloomberg                                    Source: BofA Global Research, Bloomberg

Breadth and volume indicators confirm bullish trend with breakouts
Unlike in early 2020, most advance-decline (A-D) lines have moved to new highs to
confirm a broad US equity market (and global equity market) rally in late 2020. Volume
indicators have lagged but have also broken out to the upside in 4Q 2020 to confirm the
US equity market rally.

Chart 7: NYSE stock A-D line to a new high to confirm the 2020 rally.      Chart 8: Cumulative net up volume finally broke out to confirm rally.

Source: BofA Global Research, Bloomberg                                    Source: BofA Global Research, Bloomberg

4        2021 Equity Technical Year Ahead | 13 December 2020
Bullish: High yield OAS and financial conditions remain benign
The US high yield OAS continues to new recovery lows and is closing in on 2018-2020
trough levels near 3.15-3.03. Both the Chicago Fed and Bloomberg Financial Conditions
indices remain benign. The Bloomberg US Financial Conditions Index has hit new
recovery highs to confirm the 2020 rally on the SPX.

Chart 9: The US high yield OAS remains benign with some room to run.    Chart 10: Bloomberg US Financial Conditions confirms the SPX rally.

Source: BofA Global Research, Bloomberg                                 Source: BofA Global Research, Bloomberg

Risks: Bearish divergence on RSI and overbought Net Tabs
Yes, a strong 2020 rally has moved price momentum for the US equity market to an
overbought condition with Williams %R overbought across timeframes (Table 9), which
we view as a “good” overbought. One risk to this “bullish or confirming” are bearish
divergences across timeframes on RSI. Another risk is that the Net Tab and Net Tab
Bands are overbought for the first time since January 2020.

Chart 11: Risk: Daily RSI shows a bearish divergence (lower high).      Chart 12: Risk: Net Tab is overbought for the first time since Jan 2020.

Source: BofA Global Research, Bloomberg                                 Source: BofA Global Research, Bloomberg

                                                                                          2021 Equity Technical Year Ahead | 13 December 2020      5
S&P 500 SPX: Tactical triangle suggests 3800s into early 2021 The SPX broke out from the bullish triangle pattern that we highlighted heading into the US Presidential Election. This triangle projects further upside to 3830 (measured move) and 3885 (triangle count) into early 2021. The prior highs from September-October at 3588-3550 offer support, but the triangle breakout stays intact above 3500. Rising 26 and 40-week MAs near the 3377-3180 range define a bullish trading cycle or uptrend and offer additional support. Chart 13: SPX: Triangle breakout targets 3830 to 3885. The prior highs from Sep-Oct at 3588-3550 offer support but the triangle remains intact above 3500. Source: BofA Global Research, Bloomberg 6 2021 Equity Technical Year Ahead | 13 December 2020
Secular trend points higher
Secular bull markets are multi-business cycle uptrends for equities that include cyclical
bull and bear markets as well as economic expansions and contractions. The 2020
COVID-19 correction and US economic recession bent but did not break the secular bull
market for US equities that began on the big upside breakout for the SPX in April 2013.

2020, 1987 and 1957 = 7-year itch in a secular bull market
The upside breakouts for the SPX from 1950, 1980 and 2013 each marked the start of
secular bull markets. All three for these bull markets (1950-1966, 1980-2000 and 2013-
present) show interruptions from cyclical bear markets in the seventh year. Some would
call this “the seven year itch” for these secular bull markets. Major higher lows in 1957
and 1987 launched the second half of the prior secular bull markets. History often
rhymes, and suggests a major higher low in 2020, which is the seventh year after the
2013 breakout, ahead of a continuation of the current secular bull market.

History rhymes: 2020 vs 1987 and 1957
The correction into the March 2020 low coincided with the COVID-19 pandemic and an
economic recession. We think that the 2020 correction is this generation’s 1987 Crash.
1987 saw stock market crash that did not coincide with an economic recession but had a
decline of similar magnitude to that of the 2020 correction. 1957 also shows parallels to
2020 with an economic recession and the 1957 Flu Pandemic. However, neither 1987
nor 1957 derailed a secular bull market for US equities, so the potential is that 2020
events do not derail the current secular bull market.
Chart 14: 2020: “7-year itch” for the secular bull market from 2013. After a “7-year itch” in both 1957 and 1980, the SPX continued its secular bull market.

Source: BofA Global Research, Bloomberg

                                                                                                   2021 Equity Technical Year Ahead | 13 December 2020         7
Secular overlays: SPX 4000+ not ruled out in 2021 Coming into 2020, the secular bull market from the 2013 breakout point was lagging the bull markets from the 1950 and 1980 breakout points, which was a concern. However, the strong rally from March has moved the current secular bull market back into gear with the prior bull market trends. If the current bull phase can stay in line with the prior secular bull trends, SPX 4000+ possible into 2Q 2021 but more likely into early 2022. Chart 15: Secular breakouts overlay: A case for SPX 4000+ into 2Q 2021 but more likely early 2022. Source: BofA Global Research, Bloomberg But SPX 4000+ more likely in early to mid 2022 The overlay chart that lines up the secular bear market peaks from 1937, 1966 and 2000 has had a fairly tight bullish fit since 2012. The current bull phase has lined up well with the 1966 peak overlay since early 2018. This secular peaks overlay suggests that SPX 4000+ is not ruled out into early 2021 but more likely and sustainable in early to mid 2022 as long as the current secular bull continues to rhyme with the prior bull markets. Chart 16: Secular peaks overlay: A case for SPX 4000+ into early 2021 but more likely 2022. Source: BofA Global Research, Bloomberg 8 2021 Equity Technical Year Ahead | 13 December 2020
2020 cup and handle corroborates SPX 4000+
The SPX completed a bullish 2020 cup and handle on the July breakout above the 3200
area. The upside count for this pattern projects the SPX to 4270, which corroborates the
case for SPX 4000+ as highlighted in the secular bull market roadmap charts highlighted
above and in Chart Blast: Secular bull market roadmap charts 30 August 2020. The
COVID-19 correction in March and rally into June marked the cup and the June
consolidation formed the handle of this bullish trend continuation pattern.

Big 2021 SPX support: 3200
The fall correction into the 3200 range served as a bullish retest of the breakout from
the 2020 cup and handle. The 3200 area, which is backed up by the rising 200-day MA
near 3170 is a big support on a deeper 2021 correction.
Chart 17: SPX: 2020 cup and handle corroborates SPX 4000+. Pattern breakout point at 3200 is big 2021 support with the rising 200-day MA near 3170.

Source: BofA Global Research, Bloomberg

                                                                                               2021 Equity Technical Year Ahead | 13 December 2020    9
Bigger drawdowns precede better years
SPX stronger after years with 10%+ drawdowns
Including 2020, the SPX has had 10%+ YTD drawdowns from the prior year’s close in 41
of the 93 years going back to 1928. This means that 2021 is following a year with a
10%+ drawdown. Historical data suggest that the year after a year with a 10%+
drawdown tends to have stronger returns in the following January, 1Q and for the entire
year. The average and median annual returns under this scenario of 10.3% and 14.1%,
respectively, corroborate SPX 4000+ in 2021. However, the average and median
maximum YTD intra-year drawdowns are higher under this scenario, which means that
2021 can have some interruptions.
Table 1: SPX performance in years after the previous year has a 10%+ drawdown: 1928 to present.
January return 1Q Return Annual return Max YTD intra-year drawdown
Average 1.7% 1.8% 10.3% -12.9%
Median 2.1% 3.9% 14.1% -9.4%
Standard deviation 5.2% 10.2% 21.5% 13.8%
Max 12.3% 21.6% 45.0% 2.2%
Min -8.6% -19.4% -47.1% -49.7%
% time up 65.0% 55.0% 70.0% Not applicable
Source: BofA Global Research, Bloomberg
Table 2: SPX performance in years after the previous year does not have a 10%+ drawdown
January return 1Q Return Annual return Max YTD intra-year drawdown
Average 0.88% 1.27% 5.05% -10.13%
Median 1.21% 1.67% 7.06% -6.41%
Standard deviation 4.48% 6.76% 16.43% 10.69%
Max 13.18% 20.45% 34.11% 1.27%
Min -7.15% -20.00% -38.59% -49.53%
% time up 61.54% 63.46% 62.75% Not applicable
Source: BofA Global Research, Bloomberg
Table 3: SPX performance for all years: 1928-present
January return 1Q Return Annual return Max YTD intra-year drawdown
Average 1.25% 1.50% 7.67% -11.03%
Median 1.55% 1.83% 10.62% -7.59%
Standard deviation 4.79% 8.40% 19.08% 11.97%
Max 13.18% 21.59% 45.02% 2.16%
Min -8.57% -20.00% -47.07% -49.67%
% time up 63.04% 59.78% 66.30% Not applicable
Source: BofA Global Research, Bloomberg
10 2021 Equity Technical Year Ahead | 13 December 2020Secular bull upside after years with 10%+ drawdowns
The current trend is a secular bull market from the April 2013 breakout on the SPX. We
look at the years with 10%+ drawdowns associated with secular bull markets as well as
the generational low years of 1942, 1974 and 2009. The years after these events show
much stronger SPX performance in January, 1Q and for the entire year with lower
maximum YTD drawdowns. The average and median annual returns under this scenario
are much higher at 23.9% and 21.3%, respectively, and the minimum return was 12.4%,
which bodes well for 2021.
Table 4: Years following years with 10%+ YTD drawdowns are particularly strong during secular bull markets and coming off generational lows.
Max YTD intra-year
NBER Max YTD intra-year Following year Following year 1Q Return for drawdown for
Year Secular trend Recession drawdown Return for year January return Return following year following year
1942 Generational low No -14.0% 12.4% 6.9% 18.5% 19.4% 1.2%
1953 Bull Yes -14.5% -6.6% 5.1% 8.6% 45.0% 0.0%
1957 Bull (7-year itch) Yes -16.5% -14.3% 4.3% 5.3% 38.1% 0.9%
1960 Bull Yes -12.7% -3.0% 6.3% 12.0% 23.1% -0.9%
1962 Bull No -26.9% -11.8% 4.9% 5.5% 18.9% -0.6%
1974 Generational low Yes -36.2% -29.7% 12.3% 21.6% 31.5% 2.2%
1981 Bull Yes -16.9% -9.7% -1.8% -8.6% 14.8% -16.6%
1982 Bull Yes -16.6% 14.8% 3.3% 8.8% 17.3% -1.8%
1984 Bull No -10.7% 1.4% 7.4% 8.0% 26.3% -2.3%
1987 Bull (7-year itch) No -10.6% 2.0% 4.0% 4.8% 12.4% -2.8%
1990 Bull Yes -16.7% -6.6% 4.2% 13.6% 26.3% -6.3%
2009 Generational low Yes -26.2% 23.5% -3.7% 4.9% 12.8% -9.3%
2016 Bull No -11.4% 9.5% 1.8% 5.5% 19.4% 0.3%
2018 Bull No -12.2% -6.2% 7.9% 13.1% 28.9% -2.5%
2020 Bull (7-year itch) Yes -32.2%
Average 4.5% 8.7% 23.9% -2.8%
Median 4.6% 8.3% 21.3% -1.4%
Standard deviation 4.0% 7.2% 9.6% 5.0%
Max 12.3% 21.6% 45.0% 2.2%
Min -3.7% -8.6% 12.4% -16.6%
% time up 85.7% 92.9% 100.0% Not applicable
Source: BofA Global Research, Bloomberg
2021 Equity Technical Year Ahead | 13 December 2020 11Better Presidential Cycle scenarios
2021 features better Presidential Cycle Year 1 scenarios
We have done plenty of work on the Presidential Cycle going back to 1872. A limited
number of observations makes drawing any hard and fast conclusions difficult, so we
present the data for historical context. Joe Biden was the Democrat candidate and
Presidential Cycle Year 1 under Democrat Presidents has an average return of 6.1%
(9.7% median). Since Joe Biden will be in his first term, first term Year 1 cycles show an
average return of 7.1% (7.4% median). Democrat first term Year 1 cycles have an
average return of 11.4% (14.4% median).
Table 5: S&P 500 average returns for US Presidential Cycle scenarios from 1872 to 2020.
Presidential Cycle % time up % time up % time up % time up % time up Full Observations Observations
Year 1 Year 2 Year 3 Year 4 Full term
Scenario Year 1 Year 2 Year 3 Year 4 term (year 1-4) (Full term)
All terms 4.4% 3.9% 10.3% 6.1% 27.7% 59.5% 59.5% 70.3% 70.3% 75.0% 37 36
Republican 3.1% 3.0% 8.0% 6.4% 22.2% 57.1% 61.9% 71.4% 76.2% 70.0% 21 20
Democrat 6.1% 5.1% 13.3% 5.7% 34.5% 62.5% 56.3% 68.8% 62.5% 81.3% 16 16
1st term Presidencies 7.1% -0.5% 12.4% 9.3% 33.1% 64.0% 44.0% 72.0% 80.0% 83.3% 25 24
2nd term Presidencies -1.3% 13.1% 6.0% -0.4% 16.9% 50.0% 91.7% 66.7% 50.0% 58.3% 12 12
Republican first term 4.3% 1.3% 10.6% 8.4% 29.1% 60.0% 53.3% 73.3% 86.7% 78.6% 15 14
Democrat first term 11.4% -3.3% 15.0% 10.6% 38.6% 70.0% 30.0% 70.0% 70.0% 90.0% 10 10
Republican second term 0.1% 7.1% 1.4% 1.6% 6.0% 50.0% 83.3% 66.7% 50.0% 50.0% 6 6
Democrat second term -2.7% 19.0% 10.5% -2.5% 27.8% 50.0% 100.0% 66.7% 50.0% 66.7% 6 6
Source: BofA Global Research, Bloomberg, Global Financial Data (GFD)
Table 6: SPX Pres Cycle median returns 1872 to 2020. Table 7: SPX Pres Cycle standard deviation of returns 1872 to 2020.
Presidential Cycle Full Presidential Cycle Full
Year 1 Year 2 Year 3 Year 4 Year 1 Year 2 Year 3 Year 4
Scenario term Scenario term
All terms 7.1% 2.8% 12.3% 7.7% 22.9% All terms 19.8% 16.9% 19.3% 16.6% 46.9%
Republican 3.0% 2.8% 8.5% 6.8% 16.9% Republican 14.9% 19.3% 22.3% 18.5% 46.9%
Democrat 9.7% 4.8% 15.2% 8.6% 25.9% Democrat 25.2% 13.6% 14.4% 14.4% 47.6%
1st term Presidencies 7.4% -2.5% 17.3% 7.7% 22.9% 1st term Presidencies 17.3% 15.4% 20.4% 13.1% 48.3%
2nd term Presidencies -4.9% 14.1% 6.0% 3.3% 17.0% 2nd term Presidencies 23.9% 16.8% 16.6% 21.5% 43.9%
Republican first term 3.5% 0.1% 17.3% 6.8% 21.6% Republican first term 14.0% 18.6% 23.0% 14.5% 50.4%
Democrat first term 14.4% -4.2% 15.6% 10.3% 24.4% Democrat first term 21.5% 8.8% 16.5% 11.3% 47.2%
Republican second term -4.9% 8.4% 2.8% 4.7% 0.2% Republican second term 18.0% 22.1% 20.9% 27.3% 35.9%
Democrat second term -3.8% 19.1% 15.2% -0.3% 41.3% Democrat second term 30.5% 6.5% 10.9% 16.3% 51.8%
Source: BofA Global Research, Bloomberg, Global Financial Data (GFD) Source: BofA Global Research, Bloomberg, Global Financial Data (GFD)
12 2021 Equity Technical Year Ahead | 13 December 2020Weekly HY vs IG ratio: Bottom breakout
2020 low for weekly HY vs IG ratio confirmed risk-on
The iBoxx USD Liquid High Yield Index (IBOXHY) relative to the iBoxx USD Investment
Grade Index (IBOXIG) bottomed out in April 2020, near the prior lows from February
2016, October 2011 and August 2010 and well above the lows from 2008/2009 and
2002. These lows coincided with important lows for US equities after meaningful
market pullbacks and/or big bear markets. We viewed this as a bullish macro risk-on
signal for 2020.
Weekly HY vs IG bottom breakout bullish for 2021
The weekly HY vs IG ratio broke out from a 2020 bottom as of 12/4/2020. This breakout
resemble similar bullish breakouts from 8/6/2016, 1/4/2013, 10/15/2010, 4/3/2009 and
7/18/2003. In our view, this signal bodes well for the SPX in 2021. The average and
median 52-week returns for the SPX after a risk-on bottom breakout signal in the weekly
iBoxx High Yield relative to Investment Grade ratio are 18.6% and 13.5%, respectively,
with the SPX up 100% of the time (Market Comment: 15 Nov 20). This does not rule out
SPX 4200-4385 and corroborates the secular bull market roadmap.
Chart 18: Weekly iBoxx High Yield relative to Investment Grade ratio breaks out from a risk-on bottom. This bodes well for 2021 SPX upside.
Source: BofA Global Research, Bloomberg
2021 Equity Technical Year Ahead | 13 December 2020 13Russell 2000 and NASDAQ 100 Russell 2000: Post-election breakouts: 2020, 2016 & 2012 Similar to the US Presidential Elections from 2012 and 2016, history is rhyming and the Russell 2000 (RTY) also has a big upside breakout after the 2020 Presidential Election. This 2-year+ breakout favors further upside to 2160, which is aligned with the upside potential from the post-election upside breakouts for the RTY from 2012 and 2016. We also are not ruling out 2440, which is possible longer term given the depth of the 2020 COVID-19 correction. Many investors view the RTY has stretched on the upside, but holding above or near the big picture supports at 1742 (prior high from early 2018) and the 1700-1650 breakout point on interim dips would keep the pattern bullish for small caps in 2021 and potentially into 2022. Breakout for small caps confirmed by volume In addition, cumulative net up volume (volume A-D line) for the RTY also scored a 2- year+ breakout (Market Comment: 06 Dec 20), which means that volume has confirmed the breakout and rally, as well as bullish rotation, for small caps. Chart 19: Russell 2000: A post-2020 election breakout resembles the bullish breakouts seen after the prior two Presidential Elections in 2016 and 2012. Source: BofA Global Research, Bloomberg 14 2021 Equity Technical Year Ahead | 13 December 2020
NDX: Bullish triangle breakout targets 13,500-13,630
Similar to the SPX, the NASDAQ 100 (NDX) has broken out from a bullish triangle within
a rising trend. This triangle breakout stays intact above support at 12,268-12.090 down
to 11,800 with upside potential 13,500-13,630. Rising 26 and 40-week MAs represent a
bullish trading cycle and offer potential supports in the 11,320 to 10,396 range.
Chart 20: NDX: Triangle favors upside to 13,500-13,630. Key support: 12,268 to 11,800.
Source: BofA Global Research, Bloomberg
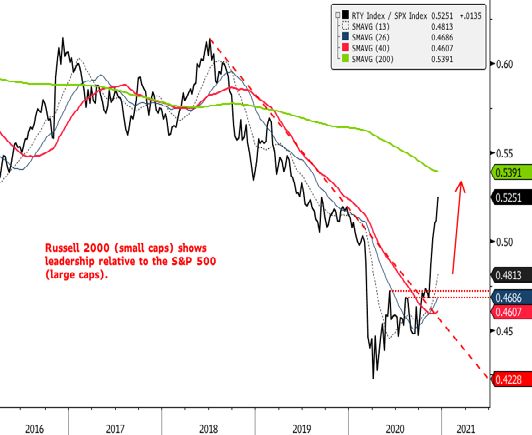
RTY leads as NDX stalls relative to the SPX
RTY shows solid 4Q leadership for small caps relative to large caps, which based on
seasonality trends (Sectors and stocks on the move: 29 Oct 20) has the potential to
continue into 2021. Although the NDX has traded sideways relative to the SPX, the
leadership trend for this index that houses many names near and dear to a Growth
investor’s heart has not yet broken down. The key supports for the NDX vs SPX ratio in
2021 are at the prior high from March 2000 and the rising 40-week MA. It would take a
break below these supports for a more meaningful loss of leadership for the NDX.
Chart 21: Solid 4Q leadership for the RTY can continued into 2021. Chart 22: Prior March 2000 high = Big 2021 support for NDX vs SPX.
Source: BofA Global Research, Bloomberg Source: BofA Global Research, Bloomberg
2021 Equity Technical Year Ahead | 13 December 2020 15Rotation, rotation, rotation Other than politics, the most contentious 2020 debate among investors is whether or not to rotate into Value and away from Growth. Moving into 2021 a tactical double top favors Value over Growth, but as we have highlighted throughout 2H 2020, the Value trade may be more about High Beta (aka cyclicals). The GICs level 1 sector relative rotation chart (RRG) has shown a pause for Growth, bullish rotation for Cyclicals and bearish rotation for Defensives. If our FICC 2021 Year Ahead trend views of short USD, short US treasuries and long commodities prove to be correct, these rotations, which are the lifeblood of a bull market, have the potential to persist well into 2021. A bullish Global Wave also supports this view. Growth corrects vs Value The weekly chart for Russell 1000 Growth relative to Russell 1000 Value has breached its mid September low to confirm a tactical double top for Growth vs Value. At a minimum, this suggests that Growth should remain choppy relative to Value, but a sustained breakdown from the double top would mean tactical bullish rotation for Value at the expense of Growth. It would take a decisive break below support at the prior highs from 2000 (also May 2020 peak and June 2020 low) for a longer-term shift in favor of Value. A sustained move below the rising 40-week MA for the Growth vs Value ratio would increase the potential for a bigger rotation toward Value. Chart 23: A tactical double top says Russell 1000 Growth at risk relative to Russell 1000 Value. Prior highs from 2000 = Big 2021 support for Growth vs Value. Source: BofA Global Research, Bloomberg 16 2021 Equity Technical Year Ahead | 13 December 2020
High Beta scores a major breakout relative to Value
S&P 500 High Beta has achieved a major breakout from a 12-year big base or bottom
relative to Russell 1000 Value. We believe that this breakout confirms the potential for
continued rotation toward cyclicals and away from defensives. It also supports the case
for tactical strength from Value relative to Growth. High Beta has a similar breakout
relative to Low Volatility (Chart Blast: The must watch rotation charts 26 July 2020).

Lows for High Beta vs Value confirm major lows for SPX
The 2020 low for High Beta vs Value lines up well with prior ratio lows from late 2018,
2016, 2011-2012, 2008-2009 and 2002 – all are lows associated with past recessions
(2002 and 2008-2009) or growth scares (2018, 2016 and 2011-2012). The High Beta vs
Low Volatility chart has a similar setup.
Chart 24: A big breakout for High Beta relative to Value confirms bullish cyclical rotation.

Source: BofA Global Research, Bloomberg

                                                                                               2021 Equity Technical Year Ahead | 13 December 2020   17
Sectors: The 3 Rs: Ranks, Relatives and Rotations
Our tactical ranks, sector relative charts and the weekly relative rotation graph (RRG)
have suggested a tactical pause, rather than a long-term top, for Growth leadership
(Technology, Communication Services and Discretionary), bullish rotation for higher beta
cyclical sectors (Materials, Industrials, Financials and Energy) and the resumption of
long-term lagging trends for the higher yielding defensive sectors (Utilities, Staples and
Real Estate). Health Care struggles near support within a long-term uptrend relative to
the S&P 500 (SPX) as the sector builds a potential 5-year base (Sectors and stocks on
the move: Ranks, Rotations and Relatives 02 December 2020).
Sector reads from the weekly relative rotation graph (RRG)
Six sectors with bullish relative ratios (right side of 100 on the JdK RS-Ratio): Financials,
Communications Services and Industrials (Leading Quadrant) and Materials, Technology
and Discretionary (Weakening Quadrant).
Five sectors with bearish relative ratios (left side of 100 on the JdK RS-Ratio): Energy,
Utilities, Health Care and Staples (Improving Quadrant) and Real Estate (Lagging
Quadrant). Energy has shown bullish rotation in the RRG, especially in terms of
momentum.
The successful rotation for the cyclical sectors of Materials, Industrials and now
Financials into Leading from Improving with the Defensive sectors stalling ahead of the
Leading Quadrant confirms bullish rotation.
Chart 25: Relative rotation graph (RRG): Growth sector pause, bullish rotation for Cyclicals and bearish rotations for Defensives.
107
Improving Leading
106 Energy
105
104
103
Financials
JdK RS-Momentum
102
Utilities
101 Comm SVC
Health Care
100 Industrials
Staples
Real Estate Materials
99
Tech
98
Discretionary
97
96
Lagging Weakening
95
82 84 86 88 90 92 94 96 98 100 102 104 106
JdK RS-Ratio
Source: BofA Global Research, Bloomberg
18 2021 Equity Technical Year Ahead | 13 December 2020Technical Globetrotting
Bullish breakout for global breadth at the index level
The weekly global advance-decline (A-D) line of 73 country indices broke to the upside
from its 2020 trading range (Market Analysis Comment: Let’s talk turkey 23 November
2020). This suggests that a broad-based rally for global equity indices should continue.
The 11/13/2020 breakout resembles those from 3/1/2019, 12/30/2016, 1/4/2013 and
3/19/2010. Both the S&P 500 and MSCI ACWI extended their rallies after these bullish
trend continuation signals (Table 8).
Table 8: S&P 500 and MSCI ACWI has seen continued rallies after weekly global A-D line breakouts.
Date of A-D line breakout SPX rally Date of SPX peak ACWI rally Date of ACWI peak
3/19/2010 19.75% 4/29/2011 17.12% 4/29/2011
1/4/2013 44.98% 5/22/2015 27.23% 5/15/2015
12/30/2016 28.32% 1/26/2018 30.46% 1/26/2018
3/1/2019 20.56% 2/14/2020 14.69% 2/14/2018
11/13/2020
Source: BofA Global Research, Bloomberg
Chart 26: Bullish: The weekly global A-D line of 73 country indices scores a breakout for global equity market breadth at the index level.
Source: BofA Global Research, Bloomberg
2021 Equity Technical Year Ahead | 13 December 2020 19US leadership, but other markets competitive in 2020 The ongoing question from many investors over the years is: When does the US equity market top out vs international equity markets? The S&P 500 remains within a long- term leadership trend relative to MSCI ACWI ex-US, but the rest of the world (ROW) has become more competitive with the US since the COVID-19 correction low in March 2020. Recent weekly closes below the rising 40-week MA on the SPX vs ACWI ex-US relative ratio are a risk to US leadership, but it would take a decisive break below the June 2020 relative low to increase the risk for a top for US vs ROW in 2021. Chart 27: US remains leadership, but ACWI ex-US got more competitive with the SPX in 2020. Source: BofA Global Research, Bloomberg Bottoming signs for EM vs SPX While there is plenty of chart resistance and a declining 200-week MA, MSCI Emerging Markets (MXEF) shows signs of a bottom vs the SPX within a decade-long downtrend for EM vs the US. Chart 28: MSCI Emerging Markets (MXEF) shows signs of a bottom vs the SPX. Source: BofA Global Research, Bloomberg 20 2021 Equity Technical Year Ahead | 13 December 2020
The US Dollar likely holds the key for US vs ROW
The BofA Technical Strategy FICC Technical Year Ahead suggested more weakness for
the US Dollar Index (DXY) in 2021 with the potential to confirm a major double top.
While it is not a perfect fit, DXY weakness has generally coincided with weakness for the
US vs ROW (MSCI World ex-US – MXWOU). Examples of this include the 1985 and 2001
peaks for the DXY, which preceded significant periods of weakness for the US vs ROW.
The chart below suggests that, if the US is to top out relative to ROW, the DXY likely
needs to confirm its big double top off the late 2016 and early 2020 peaks.
Chart 29: If the US is to top out relative to MSCI World ex-US (MXWOU) in 2021, the US Dollar likely needs to confirm its big double top in 2021.

Source: BofA Global Research, Bloomberg

                                                                                                   2021 Equity Technical Year Ahead | 13 December 2020   21
EM: 2-year+ breakout points higher in 2021 We highlighted a bullish pattern for EM in Market Comment: 02 Nov 20. MXEF has broken out from a 2-year+ base that favors continued upside in 2021. Holding above or near key support at 1150 to 1100 on any dips would keep this breakout firmly in place with upside potential beyond the early 2018 peak of 1278.53 to pattern counts near 1395 and 1510. Rising 13 and 26-week MAs coincide with key support. Chart 30: EM: 2-year+ breakout in late 2020 favors 2021 upside. Source: BofA Global Research, Bloomberg 13-year triangle sets up EM for secular bullish breakout Taking a step back, MXEF shows a massive 13-year triangle base that if completed could usher in a major secular bull market for EM. The current big base pattern is similar to the decade-long big base that EM completed in 2004, which preceded a strong rally for EM into the 2007 peak. Chart 31: EM in a 13-year big triangle base. A breakout would suggests secular bull market for EM. Source: BofA Global Research, Bloomberg 22 2021 Equity Technical Year Ahead | 13 December 2020
Bullish setups: FTSEMIB, IBEX, XU100 and IMOEX
•     The FTSE MIB (FTSEMIB) has traded in a range for over 11 years, which sets up a
      potential big base for Italy’s equity market. The key 2021 resistance is 24,558-
      25,483, where an upside breakout would confirm the base. The prior peak from July
      near 21,133 and 24/12-month MAs near 20,660-19,744 offer key supports.
•     The IBEX 35 (IBEX) has held long-term uptrend support from 2002 as Spain’s
      equity market attempts to form a bottom off the 2020 lows. A decisive push above
      7792-8323 (chart, gap and 24-month MA resistance) would increase our confidence.
Chart 32: Italy’s FTSEMIB remains within a big base.                     Chart 33: Spain’s IBEX attempts to bottom off a long-term uptrend line.

Source: BofA Global Research, Bloomberg                                  Source: BofA Global Research, Bloomberg

•     The Borsa Istanbul 100 (XU100) has broken out from a 2-year+ base. Holding
      above the breakout zone from 1245 to 1194 would keep this breakout intact with
      longer-term upside potential to 1580.
•     The MOEX Russia (IMOEX) has achieved the upside count of the 2007-2016 big
      base in 3235-3300 area. A breakout from a 2020 bullish continuation pattern
      suggests more upside in 2021 with a measured move at 3675 and a pattern count
      at 4145. Holding above or near the 3090-3025 range on dips keeps the pattern
      bullish.
Chart 34: Turkey’s XU100 has scored a 2-year+ base breakout.             Chart 35: Russia’s IMOEX has a 2020 bullish consolidation pattern.

Source: BofA Global Research, Bloomberg                                  Source: BofA Global Research, Bloomberg

                                                                                           2021 Equity Technical Year Ahead | 13 December 2020   23
Bullish setups: NKY, TWSE, SHCOMP and SENSEX
• The Nikkei 225 (NKY) shows a multi-decade big base or bottom. The 61.8%
retracement of the 1989-2008 decline near 26,748 acts as resistance moving into
2021, but holding above or near 24,000 on interim dips keeps the pattern bullish
with longer-term upside counts at 29,200 and 31,800. The big base counts to
34,800. Corrections in 2018 and 2020 bent but did not invalidate this big base.
• The Taiwan Stock Exchange (TWSE) also has a huge base or bottom. The
breakout from a 1997-2017 base projects into the 16,000s. Key supports: 13,000
and 12,200. Corrections in 2018 and 2020 bent but did not invalidate this big base.
Chart 36: Japan’s NKY: Big base with upside counts to 29K to 34K. Chart 37: Taiwan’s TWSE: Big base with upside potential to 16K.
Source: BofA Global Research, Bloomberg Source: BofA Global Research, Bloomberg
• The Shanghai Comp (SHCOMP) remains in position for a major rally, similar to
those from 2014-2015, 2006-2007 and 1996-2001. Holding first support near
3200-3125, with rising 12 and 24-month MAs near 3100 and 3000, keeps this
pattern intact. A break above 3465 in 2021 is the signal to confirm a 5-year+
bottom.
• The S&P BSE SENSEX (SENSEX) has a 2020 bullish consolidation breakout that
remains intact as long as support at 42,270-41,050 holds with longer-term upside
potential to 50,600 and 55,600.
Chart 38: China’s SHCOMP remains positioned for a major rally. Chart 39: India’s SENSEX: 2020 consolidation breakout points higher.
Source: BofA Global Research, Bloomberg Source: BofA Global Research, Bloomberg
24 2021 Equity Technical Year Ahead | 13 December 2020Indicator checklist
Weight of the evidence is bullish
The weight of the evidence is bullish. Broadly positive Trend, Breadth, Seasonality,
Volume, Credit, Momentum and Macro indicators support continued upside into 2021.
Some sentiment indicators have become more complacent, which means that the only
thing we have to fear is the lack of fear itself. AAII Bulls capitulated in November, total
put/calls are complacent and the Net Tab is overbought. This is a 2021 risk, but not all
investors are bullish. S&P 500 (SPX) futures positioning shows that large speculators
neutralized a net long and asset managers are well below the aggressive net long levels
associated with prior SPX peaks in early 2020, 2018 and 2011. In other words, futures
positioning does not rule a bullish catch-up trade into 2021.
Table 9: Indicator checklist: Trend, Breadth, Volume, Seasonality, Sentiment, Credit Markets, Price Momentum and Macro.
Category Indicator Signal Notes
Trend S&P 500 trading cycle Bullish Rising 26 and 40-week MAs = bullish trading cycle. Chart 13.
Golden Cross Bullish A Golden Cross (50-day MA above 200-day MA) in a recession is bullish.
Monthly MACD Bullish Bullish trend continuation signal along with a rising 12-month MA near 3200 – key 2021 support. Chart 6.
Dow Theory Bullish New highs for both the Dow Industrials and Dow Transports confirm the cyclical bull market from the late March low.
Breadth NYSE all issues A-D line Bullish A new high = positive market breadth. Bullish leading indicator that supports a yearend rally on the SPX.
NYSE stocks A-D line Bullish Unlike in Feb 2020, a new all-time high for this A-D line confirms the new all-time high on the SPX 4Q 2020 - Chart 7.
Most active A-D line Bullish Similar to August, new highs for this A-D are a leading indicator for new SPX highs. Supports case for yearend rally.
S&P 500 A-D line Bullish A new high and bullish trend for the SPX A-D line supports the case for new SPX highs and a yearend rally.
% stocks > 10-day MAs Bearish divergence Improving but shows a Nov-Dec bearish divergence (lower highs vs higher SPX highs).
% stocks > 50-day MAs Bearish divergence Has improved on break above downtrend line but shows a bearish divergence or lower highs from mid-November.
% stocks > 200-day MAs Bullish New highs bode well for the SPX. Unlike early 2020, no bearish divergence in 4Q 2020.
Volume SPX cumulative net up volume Tactically bullish Bullish breakout confirms the potential for a yearend rally but still below its 2020 peak - Chart 8.
NYSE cumulative net up volume Tactically bullish Bullish breakout confirms the 4Q breakout for the NYSE, but this indicator remains below its early 2020 peak.
Volume Intensity Model Bullish Bullish with VIM Accumulation above VIM Distribution and improving.
VIGOR Rising / Bullish Rising VIGOR is encouraging but stronger on NASDAQ, NYSE and Russell 2000 than on the SPX.
Seasonality S&P 500 seasonality Bullish 2020 got its summer rally and fall dip. Best 3 and 6-month periods began in November. December rally.
Election year seasonality Bullish Election year seasonality also improves in November and favors yearend rally.
VIX seasonality Bullish Lower risk of Nov and Dec VIX spikes – supports case for yearend rally.
Jan and 1Q 2021 Bullish If the SPX can finish 2020 with an above average return, it would bode well for Jan and 1Q 2021.
Sentiment Farrell Sentiment Bullish Refreshed bullish signal on move above 0.5 in early October.
AAII Bulls Bearish Moved above 50. See Quantifying Technicals: Did the bulls capitulate last week? 16 November 2020 for more.
3-month VIX vs the VIX Bullish Just like in 2016: Oversold (contrarian bullish) prior to the 2020 election and triggered a buy signal after the election.
5-day put/call Bearish After hitting its highest (most fearful) level since May, the 5-day put/call is back to overbought or complacent levels.
25-day put/call Bearish Hit the most complacent levels in 16 years In Aug/Sep. Back to complacent levels but above 2020 low.
SPX futures positioning Not bearish Large specs and asset managers not aggressively long = potential for catch-up trade - Chart 3 and Chart 4.
Credit markets US high yield OAS Bullish A continuing downtrend or narrowing of the HY OAS is a potential leading indicator is bullish for the SPX - Chart 9.
LQD and HYG ETF Bullish Credit market ETFs are a leading indicator for the SPX: HYG bullish breakout/retest. LQD: Bullish 3-month breakout.
BAA vs US 10-year spread Bullish Benign levels. Bullish from late Sep. New tactical lows a bullish signal for SPX.
Weekly HY vs IG ratio Bullish April was a bullish trough signal for the weekly iBoxx HY vs IG ratio and early Dec saw a bullish breakout - Chart 18.
Price momentum Daily Williams %R Bullish A persistent overbought is confirming the seasonal 4Q rally.
Weekly Williams %R Bullish Persistent overbought since early July favors a grind higher in the SPX.
Monthly Williams %R Bullish Persistent overbought since early July confirms bullish monthly MACD and favors a grind higher in the SPX.
Macro Global A-D line (73 countries) Bullish An upside breakout is bullish for global equity market breadth and bodes well for global equity rally - Chart 27.
Net Tabs Overbought Both the Net Tabs and Net Tabs Bands are overbought, which is a risk factor in a bullish backdrop - Chart 12.
Margin debt Bullish Broke above the May 2018 downtrend line – a bullish signal. In position for new highs, which is also bullish.
Margin debt z-score Less constructive Moved out of overbought in September after generating bullish signals earlier this year.
Margin debt 12-month ROC Bullish Bullish signal in July. Above Dec 19 peak in August means bigger bullish turn.
FINRA Cash levels Bullish Even as margin debt has risen, FINRA cash in accounts remains near March 2020 peak - contrarian bullish.
ICI money fund cash levels Bullish Lower since a late May peak at $4.8 trillion but still elevated at $4.3 trillion – a contrarian bullish mountain of money.
Fed Financial Conditions Bullish Chicago Federal Reserve National Financial Conditions: Bullish from April. Uptick from mid October is also bullish.
Bloomberg Financial Conditions Bullish A push to new recovery highs is a bullish sign.
Source: BofA Global Research, Bloomberg
2021 Equity Technical Year Ahead | 13 December 2020 25Disclosures
Important Disclosures
Due to the nature of strategic analysis, the issuers or securities recommended or discussed in this report are not continuously followed. Accordingly, investors must regard this report as
providing stand-alone analysis and should not expect continuing analysis or additional reports relating to such issuers and/or securities.
Due to the nature of quantitative analysis, the issuers or securities recommended or discussed in this report are not continuously followed. Accordingly, investors must regard this report as
providing stand-alone analysis and should not expect continuing analysis or additional reports relating to such issuers and/or securities.
Due to the nature of technical analysis, the issuers or securities recommended or discussed in this report are not continuously followed. Accordingly, investors must regard this report as
providing stand-alone analysis and should not expect continuing analysis or additional reports relating to such issuers and/or securities.
BofA Global Research personnel (including the analyst(s) responsible for this report) receive compensation based upon, among other factors, the overall profitability of Bank of America
Corporation, including profits derived from investment banking. The analyst(s) responsible for this report may also receive compensation based upon, among other factors, the overall
profitability of the Bank’s sales and trading businesses relating to the class of securities or financial instruments for which such analyst is responsible.
BofA Securities fixed income analysts regularly interact with sales and trading desk personnel in connection with their research, including to ascertain pricing and liquidity in the fixed income
markets.
Other Important Disclosures
Prices are indicative and for information purposes only. Except as otherwise stated in the report, for the purpose of any recommendation in relation to: (i) an equity security, the price referenced
is the publicly traded price of the security as of close of business on the day prior to the date of the report or, if the report is published during intraday trading, the price referenced is indicative
of the traded price as of the date and time of the report; or (ii) a debt security (including equity preferred and CDS), prices are indicative as of the date and time of the report and are from various
sources including BofA Securities trading desks.
The date and time of completion of the production of any recommendation in this report shall be the date and time of dissemination of this report as recorded in the report timestamp.
Recipients who are not institutional investors or market professionals should seek the advice of their independent financial advisor before considering information in this report in connection
with any investment decision, or for a necessary explanation of its contents.
Officers of BofAS or one or more of its affiliates (other than research analysts) may have a financial interest in securities of the issuer(s) or in related investments.
BofA Global Research policies relating to conflicts of interest are described at https://rsch.baml.com/coi
"BofA Securities" includes BofA Securities, Inc. ("BofAS") and its affiliates. Investors should contact their BofA Securities representative or Merrill Global Wealth Management
financial advisor if they have questions concerning this report or concerning the appropriateness of any investment idea described herein for such investor. "BofA Securities" is a
global brand for BofA Global Research.
Information relating to Non-US affiliates of BofA Securities and Distribution of Affiliate Research Reports:
BofAS and/or Merrill Lynch, Pierce, Fenner & Smith ("MLPF&S") may in the future distribute, information of the following non-US affiliates in the US (short name: legal name, regulator): Merrill
Lynch (South Africa): Merrill Lynch South Africa (Pty) Ltd., regulated by The Financial Service Board; MLI (UK): Merrill Lynch International, regulated by the Financial Conduct Authority (FCA) and
the Prudential Regulation Authority (PRA); BofASE (France): BofA Securities Europe SA is authorized by the Autorité de Contrôle Prudentiel et de Résolution (ACPR) and regulated by the ACPR
and the Autorité des Marchés Financiers (AMF); BofA Europe (Milan): Bank of America Europe Designated Activity Company, Milan Branch, regulated by the Bank of Italy, the European Central
Bank (ECB) and the Central Bank of Ireland (CBI); BofA Europe (Frankfurt): Bank of America Europe Designated Activity Company, Frankfurt Branch regulated by BaFin, the ECB and the CBI; Merrill
Lynch (Australia): Merrill Lynch Equities (Australia) Limited, regulated by the Australian Securities and Investments Commission; Merrill Lynch (Hong Kong): Merrill Lynch (Asia Pacific) Limited,
regulated by the Hong Kong Securities and Futures Commission (HKSFC); Merrill Lynch (Singapore): Merrill Lynch (Singapore) Pte Ltd, regulated by the Monetary Authority of Singapore (MAS);
Merrill Lynch (Canada): Merrill Lynch Canada Inc, regulated by the Investment Industry Regulatory Organization of Canada; Merrill Lynch (Mexico): Merrill Lynch Mexico, SA de CV, Casa de Bolsa,
regulated by the Comisión Nacional Bancaria y de Valores; Merrill Lynch (Argentina): Merrill Lynch Argentina SA, regulated by Comisión Nacional de Valores; BofAS Japan: BofA Securities Japan
Co., Ltd., regulated by the Financial Services Agency; Merrill Lynch (Seoul): Merrill Lynch International, LLC Seoul Branch, regulated by the Financial Supervisory Service; Merrill Lynch (Taiwan):
Merrill Lynch Securities (Taiwan) Ltd., regulated by the Securities and Futures Bureau; BofAS India: BofA Securities India Limited, regulated by the Securities and Exchange Board of India (SEBI);
Merrill Lynch (Indonesia): PT Merrill Lynch Sekuritas Indonesia, regulated by Otoritas Jasa Keuangan (OJK); Merrill Lynch (Israel): Merrill Lynch Israel Limited, regulated by Israel Securities
Authority; Merrill Lynch (Russia): OOO Merrill Lynch Securities, Moscow, regulated by the Central Bank of the Russian Federation; Merrill Lynch (DIFC): Merrill Lynch International (DIFC Branch),
regulated by the Dubai Financial Services Authority (DFSA); Merrill Lynch (Spain): Merrill Lynch Capital Markets Espana, S.A.S.V., regulated by Comisión Nacional del Mercado De Valores; Merrill
Lynch (Brazil): Merrill Lynch S.A. Corretora de Títulos e Valores Mobiliários, regulated by Comissão de Valores Mobiliários; Merrill Lynch KSA Company: Merrill Lynch Kingdom of Saudi Arabia
Company, regulated by the Capital Market Authority.
This information: has been approved for publication and is distributed in the United Kingdom (UK) to professional clients and eligible counterparties (as each is defined in the rules of the FCA
and the PRA) by MLI (UK), which is authorized by the PRA and regulated by the FCA and the PRA - details about the extent of our regulation by the FCA and PRA are available from us on request;
has been approved for publication and is distributed in the European Economic Area (EEA) by BofASE (France), which is authorized by the ACPR and regulated by the ACPR and the AMF; has
been considered and distributed in Japan by BofAS Japan, a registered securities dealer under the Financial Instruments and Exchange Act in Japan, or its permitted affiliates; is issued and
distributed in Hong Kong by Merrill Lynch (Hong Kong) which is regulated by HKSFC; is issued and distributed in Taiwan by Merrill Lynch (Taiwan); is issued and distributed in India by BofAS
India; and is issued and distributed in Singapore to institutional investors and/or accredited investors (each as defined under the Financial Advisers Regulations) by Merrill Lynch (Singapore)
(Company Registration No 198602883D). Merrill Lynch (Singapore) is regulated by MAS. Merrill Lynch Equities (Australia) Limited (ABN 65 006 276 795), AFS License 235132 (MLEA) distributes
this information in Australia only to 'Wholesale' clients as defined by s.761G of the Corporations Act 2001. With the exception of Bank of America N.A., Australia Branch, neither MLEA nor any of
its affiliates involved in preparing this information is an Authorised Deposit-Taking Institution under the Banking Act 1959 nor regulated by the Australian Prudential Regulation Authority. No
approval is required for publication or distribution of this information in Brazil and its local distribution is by Merrill Lynch (Brazil) in accordance with applicable regulations. Merrill Lynch (DIFC) is
authorized and regulated by the DFSA. Information prepared and issued by Merrill Lynch (DIFC) is done so in accordance with the requirements of the DFSA conduct of business rules. BofA
Europe (Frankfurt) distributes this information in Germany and is regulated by BaFin, the ECB and the CBI. BofA Securities entities, including BofA Europe and BofASE (France), may
outsource/delegate the marketing and/or provision of certain research services or aspects of research services to other branches or members of the BofA Securities group. You may be contacted
by a different BofA Securities entity acting for and on behalf of your service provider where permitted by applicable law. This does not change your service provider. Please use this link
http://www.bankofamerica.com/emaildisclaimer for further information
This information has been prepared and issued by BofAS and/or one or more of its non-US affiliates. The author(s) of this information may not be licensed to carry on regulated activities in your
jurisdiction and, if not licensed, do not hold themselves out as being able to do so. BofAS and/or MLPF&S is the distributor of this information in the US and accepts full responsibility for
information distributed to BofAS and/or MLPF&S clients in the US by its non-US affiliates. Any US person receiving this information and wishing to effect any transaction in any security
discussed herein should do so through BofAS and/or MLPF&S and not such foreign affiliates. Hong Kong recipients of this information should contact Merrill Lynch (Asia Pacific) Limited in
respect of any matters relating to dealing in securities or provision of specific advice on securities or any other matters arising from, or in connection with, this information. Singapore recipients
of this information should contact Merrill Lynch (Singapore) Pte Ltd in respect of any matters arising from, or in connection with, this information.
General Investment Related Disclosures:
Taiwan Readers: Neither the information nor any opinion expressed herein constitutes an offer or a solicitation of an offer to transact in any securities or other financial instrument. No part of
this report may be used or reproduced or quoted in any manner whatsoever in Taiwan by the press or any other person without the express written consent of BofA Securities.
26 2021 Equity Technical Year Ahead | 13 December 2020This document provides general information only, and has been prepared for, and is intended for general distribution to, BofA Securities clients. Neither the information nor any opinion
expressed constitutes an offer or an invitation to make an offer, to buy or sell any securities or other financial instrument or any derivative related to such securities or instruments (e.g., options,
futures, warrants, and contracts for differences). This document is not intended to provide personal investment advice and it does not take into account the specific investment objectives,
financial situation and the particular needs of, and is not directed to, any specific person(s). This document and its content do not constitute, and should not be considered to constitute,
investment advice for purposes of ERISA, the US tax code, the Investment Advisers Act or otherwise. Investors should seek financial advice regarding the appropriateness of investing in financial
instruments and implementing investment strategies discussed or recommended in this document and should understand that statements regarding future prospects may not be realized. Any
decision to purchase or subscribe for securities in any offering must be based solely on existing public information on such security or the information in the prospectus or other offering
document issued in connection with such offering, and not on this document.
Securities and other financial instruments referred to herein, or recommended, offered or sold by BofA Securities, are not insured by the Federal Deposit Insurance Corporation and are not
deposits or other obligations of any insured depository institution (including, Bank of America, N.A.). Investments in general and, derivatives, in particular, involve numerous risks, including,
among others, market risk, counterparty default risk and liquidity risk. No security, financial instrument or derivative is suitable for all investors. In some cases, securities and other financial
instruments may be difficult to value or sell and reliable information about the value or risks related to the security or financial instrument may be difficult to obtain. Investors should note that
income from such securities and other financial instruments, if any, may fluctuate and that price or value of such securities and instruments may rise or fall and, in some cases, investors may
lose their entire principal investment. Past performance is not necessarily a guide to future performance. Levels and basis for taxation may change.
This report may contain a short-term trading idea or recommendation, which highlights a specific near-term catalyst or event impacting the issuer or the market that is anticipated to have a
short-term price impact on the equity securities of the issuer. Short-term trading ideas and recommendations are different from and do not affect a stock's fundamental equity rating, which
reflects both a longer term total return expectation and attractiveness for investment relative to other stocks within its Coverage Cluster. Short-term trading ideas and recommendations may
be more or less positive than a stock's fundamental equity rating.
BofA Securities is aware that the implementation of the ideas expressed in this report may depend upon an investor's ability to "short" securities or other financial instruments and that such
action may be limited by regulations prohibiting or restricting "shortselling" in many jurisdictions. Investors are urged to seek advice regarding the applicability of such regulations prior to
executing any short idea contained in this report.
Foreign currency rates of exchange may adversely affect the value, price or income of any security or financial instrument mentioned herein. Investors in such securities and instruments,
including ADRs, effectively assume currency risk.
UK Readers: The protections provided by the U.K. regulatory regime, including the Financial Services Scheme, do not apply in general to business coordinated by BofA Securities entities located
outside of the United Kingdom.
BofAS or one of its affiliates is a regular issuer of traded financial instruments linked to securities that may have been recommended in this report. BofAS or one of its affiliates may, at any time,
hold a trading position (long or short) in the securities and financial instruments discussed in this report.
BofA Securities, through business units other than BofA Global Research, may have issued and may in the future issue trading ideas or recommendations that are inconsistent with, and reach
different conclusions from, the information presented herein. Such ideas or recommendations may reflect different time frames, assumptions, views and analytical methods of the persons who
prepared them, and BofA Securities is under no obligation to ensure that such other trading ideas or recommendations are brought to the attention of any recipient of this information.
In the event that the recipient received this information pursuant to a contract between the recipient and BofAS for the provision of research services for a separate fee, and in connection
therewith BofAS may be deemed to be acting as an investment adviser, such status relates, if at all, solely to the person with whom BofAS has contracted directly and does not extend beyond
the delivery of this report (unless otherwise agreed specifically in writing by BofAS If such recipient uses the services of BofAS in connection with the sale or purchase of a security referred to
herein, BofAS may act as principal for its own account or as agent for another person. BofAS is and continues to act solely as a broker-dealer in connection with the execution of any transactions,
including transactions in any securities referred to herein.
Copyright and General Information:
Copyright 2020 Bank of America Corporation. All rights reserved. iQprofile℠, iQmethod℠ are service marks of Bank of America Corporation. iQdatabase® is a registered service mark of Bank of
America Corporation. This information is prepared for the use of BofA Securities clients and may not be redistributed, retransmitted or disclosed, in whole or in part, or in any form or manner,
without the express written consent of BofA Securities. BofA Global Research information is distributed simultaneously to internal and client websites and other portals by BofA Securities and
is not publicly-available material. Any unauthorized use or disclosure is prohibited. Receipt and review of this information constitutes your agreement not to redistribute, retransmit, or disclose
to others the contents, opinions, conclusion, or information contained herein (including any investment recommendations, estimates or price targets) without first obtaining express
permission from an authorized officer of BofA Securities.
Materials prepared by BofA Global Research personnel are based on public information. Facts and views presented in this material have not been reviewed by, and may not reflect information
known to, professionals in other business areas of BofA Securities, including investment banking personnel. BofA Securities has established information barriers between BofA Global Research
and certain business groups. As a result, BofA Securities does not disclose certain client relationships with, or compensation received from, such issuers. To the extent this material discusses
any legal proceeding or issues, it has not been prepared as nor is it intended to express any legal conclusion, opinion or advice. Investors should consult their own legal advisers as to issues of
law relating to the subject matter of this material. BofA Global Research personnel’s knowledge of legal proceedings in which any BofA Securities entity and/or its directors, officers and
employees may be plaintiffs, defendants, co-defendants or co-plaintiffs with or involving issuers mentioned in this material is based on public information. Facts and views presented in this
material that relate to any such proceedings have not been reviewed by, discussed with, and may not reflect information known to, professionals in other business areas of BofA Securities in
connection with the legal proceedings or matters relevant to such proceedings.
This information has been prepared independently of any issuer of securities mentioned herein and not in connection with any proposed offering of securities or as agent of any issuer of any
securities. None of BofAS any of its affiliates or their research analysts has any authority whatsoever to make any representation or warranty on behalf of the issuer(s). BofA Global Research
policy prohibits research personnel from disclosing a recommendation, investment rating, or investment thesis for review by an issuer prior to the publication of a research report containing
such rating, recommendation or investment thesis.
Any information relating to the tax status of financial instruments discussed herein is not intended to provide tax advice or to be used by anyone to provide tax advice. Investors are urged to
seek tax advice based on their particular circumstances from an independent tax professional.
The information herein (other than disclosure information relating to BofA Securities and its affiliates) was obtained from various sources and we do not guarantee its accuracy. This information
may contain links to third-party websites. BofA Securities is not responsible for the content of any third-party website or any linked content contained in a third-party website. Content
contained on such third-party websites is not part of this information and is not incorporated by reference. The inclusion of a link does not imply any endorsement by or any affiliation with BofA
Securities. Access to any third-party website is at your own risk, and you should always review the terms and privacy policies at third-party websites before submitting any personal information
to them. BofA Securities is not responsible for such terms and privacy policies and expressly disclaims any liability for them.
All opinions, projections and estimates constitute the judgment of the author as of the date of publication and are subject to change without notice. Prices also are subject to change without
notice. BofA Securities is under no obligation to update this information and BofA Securities ability to publish information on the subject issuer(s) in the future is subject to applicable quiet
periods. You should therefore assume that BofA Securities will not update any fact, circumstance or opinion contained herein.
Certain outstanding reports or investment opinions relating to securities, financial instruments and/or issuers may no longer be current. Always refer to the most recent research report relating
to an issuer prior to making an investment decision.
In some cases, an issuer may be classified as Restricted or may be Under Review or Extended Review. In each case, investors should consider any investment opinion relating to such issuer (or
its security and/or financial instruments) to be suspended or withdrawn and should not rely on the analyses and investment opinion(s) pertaining to such issuer (or its securities and/or financial
instruments) nor should the analyses or opinion(s) be considered a solicitation of any kind. Sales persons and financial advisors affiliated with BofAS or any of its affiliates may not solicit
purchases of securities or financial instruments that are Restricted or Under Review and may only solicit securities under Extended Review in accordance with firm policies.
Neither BofA Securities nor any officer or employee of BofA Securities accepts any liability whatsoever for any direct, indirect or consequential damages or losses arising from any use of this
information.
2021 Equity Technical Year Ahead | 13 December 2020 27You can also read