VOL. 3 / 2021 JABATAN PERANGKAAN MALAYSIA - DEPARTMENT OF STATISTICS, MALAYSIA
←
→
Page content transcription
If your browser does not render page correctly, please read the page content below
MALAYSIA

      VOL. 3 / 2021

  JABATAN PERANGKAAN MALAYSIA
DEPARTMENT OF STATISTICS, MALAYSIA

MALAYSIA

                       VOL. 3 / 2021

                             Announcement:

Please be informed that following the implementation of the Movement Control
Order (MCO), Malaysia Population and Housing Census 2020 (Malaysia Census
                  2020) via online (e-Census) has reopened.

      Please be informed that the Government of Malaysia has declared
        National Statistics Day (MyStats Day) on October 20 each year.
                             MyStats Day theme is
                “Connecting the world with data we can trust”

                  JABATAN PERANGKAAN MALAYSIA
                DEPARTMENT OF STATISTICS, MALAYSIA
Published and printed by:

Department of Statistics, Malaysia
Block C6, Complex C,
Federal Government Administrative Centre,
62514 Putrajaya,
MALAYSIA

Tel. 		       : 03-8885 7000
Fax 		        : 03-8888 9248
Portal 		     : http://www.dosm.gov.my
Facebook      : www.facebook.com/StatsMalaysia
Twitter       : http://twitter.com/StatsMalaysia
Instagram     : http://instagram.com/StatsMalaysia

Published on 31st March 2021.

All rights reserved.

No part of this publication may be reproduced or distributed in any form or by any means
or stored in database without the prior written permission from Department of Statistics,
Malaysia. Users reproducing content of this publication with or without adaptation should
quote the following.

“Source: Department of Statistics, Malaysia”.

eISSN 2716-6813
TABLE OF CONTENTS
NOTES FROM CHIEF STATISTICIAN   02

MOVEMENT CONTROL ORDER          04

KEY REVIEW                      06

OVERVIEW                        08

BOX ARTICLE                     10

AGRICULTURE                     14

INDUSTRY AND MANUFACTURING      18

SERVICES                        20

EXTERNAL SECTOR                 24

LABOUR SCENARIO                 28

PRICES                          31

WAY FORWARD                     34

ECONOMIC INDICATORS             36

MESR MEMBERS                    50

ACKNOWLEDGEMENT                 51
NOTES FROM CHIEF STATISTICIAN

I am pleased to welcome readers to the latest edition of Malaysian Economic Statistics Review (MESR), which
is the third for the year 2021. Your constant interest and support are among the motivations for the Department
of Statistics, Malaysia (DOSM) to continuously improve our deliverables. The initial aspiration behind producing
MESR was to provide narrative and perspective on the macroeconomic statistics produced by DOSM as the
country experienced the economic repercussion of the COVID-19 pandemic last year. Nevertheless, as news
are easily available at everybody’s fingertips with the stream of information through social media, causing
various comprehensions and interpretations. Thus, as the national statistical office, it is most important for
DOSM to provide the accurate information based on the official statistics published to ensure everybody is
well-informed of the most recent economic situation. In this regard, MESR Volume 3/2021 provides in-depth
analysis based on the recent statistics published which is for January 2021. This release is also complemented
with a box article entitled “Measuring Potential Output and Output Gap in Malaysia”.

In Malaysia, the challenge to flatten the increasing number of COVID-19 cases continued in January 2021 with
the implementation of Movement Control Order (MCO) 2.0 throughout the month. During this phase, only five
essential economic sectors were allowed to operate, whereas interstate and inter-district travel activities were
again restricted. Additionally, operation hours of selected businesses were limited while non-essential business
outlets were temporarily closed. Prolonged flood disaster which hit certain states in the southern and east coast
of Peninsular Malaysia also caused disruption of business activities.

These scenarios were reflected by the latest economic statistics published by DOSM which shows modest
recovery in January 2021. The Industrial Production Index continued to increase for two consecutive months
as the Manufacturing index rose, albeit slower than the growth recorded in December 2020 attributed by both
exports and domestic-oriented outputs. In line with this, sales of the Manufacturing sector sustained its positive
growth. In the meantime, Malaysia’s merchandise trade continued to perform favourably in January 2021
with increases in both exports and imports, resulting in a rise in trade surplus. As for the Agriculture sector,
the production of crude palm oil and natural rubber declined further during the month. Following the sectoral
performance in January 2021, the labour force condition experienced modest recovery as reflected by the
increase in the number of labour force during the month as against December 2020. The rise in employed
persons was much higher than those who were unemployed; signalling short-term improvement in the labour
market.

With the relentless efforts to navigate the national health crisis and mitigate its impact towards the economy,
at this juncture the socioeconomic situation has yet to return to pre-pandemic period. Being at the fifth stage
out of the six Strategic Comprehensive Economic Recovery Plan namely “Revitalise”, the recent addition to
the series of stimulus packages announced by the Government is definitely a welcomed gesture to jump start
the economy. The Strategic Programme to Empower the People and Economy or PEMERKASA amounting to
RM20 billion focuses on 20 strategic initiatives to propel the economy, support businesses as well as extend
the targeted assistance towards affected sectors and individuals. This news came on 17th March 2021, which
marked one-year period since the MCO was implemented for the first time in the country.

After a challenging year in mitigating the impact of the health crisis towards the nation’s livelihood, and three
months into MCO for the year 2021, it is witnessed that COVID-19 cases had eased with the number of daily
recovery higher than new infections. Since the first batch of vaccines was rolled out, nearly 600 thousand1
individuals were vaccinated with a share of 10.7 per cent having completed the second dose. A comprehensive
COVID-19 vaccination policy outlined three strategies with implementation period set out in three phases to
ensure that at least 80 per cent of Malaysia’s adult population receive vaccines by February 2022.

With these developments, the Malaysia’s near-term economic prospects remain upbeat as signalled by the
Leading Index (LI) January 2021. This is reflected by the double-digit growth of the total trade performance
recorded in February 2021. On top of that, as the containment measures are slowly eased with allowance of
more business operations and social activities are deemed to alleviate the pressure on the economy, as well as
ensure the livelihood and well-being of the people.

1
  As of 28th March 2021, a total of 580,765 persons had been vaccinated as reported by Special Committee on Ensuring Access to COVID-19
Vaccine Supply.

        2                                         | MALAYSIAN ECONOMIC STATISTICS REVIEW - VOL. 3/2021
NOTES FROM CHIEF STATISTICIAN
It is hoped that this MESR will be of assistance to all segments of users including public and private sectors,
research houses, academicians and individuals. I humbly welcome any feedbacks and opinions to strengthen
future releases of this report.
In the meantime, the Malaysia Population and Housing Census 2020 (Malaysia Census 2020) via face to face
and online (e-Census) modes are being conducted nationwide until 30th June 2021. All Malaysian residents are
urged to cooperate in realising the success of Malaysia Census 2020 to ensure that no one is left behind as your
data is our future. Please visit the Malaysia Census 2020 portal at www.mycensus.gov.my or social media
@MyCensus2020 for more info.
Thank you.
DR. MOHD UZIR MAHIDIN
March 2021
MALAYSIAN ECONOMIC STATISTICS REVIEW - VOL. 3/2021 | 34
CHRONOLOGY OF MCO 2020
MAR APR MAY JUN JUL SEP OCT NOV DEC
AUG
Conditional
Movement Control Order MCO Recovery MCO Recovery MCO
(MCO) (CMCO) (RMCO) (RMCO)
On 28 August 2020,
Phase 5 Phase 6 Phase 7 Government has
4 May - 9 June 10 June - 31 August 1 Sep - 31 Dec announced Recovery MCO
to be continued until
31 December 2020.
Phase 1
18 - 31 March On 1 May 2020, Government has CMCO announcement by Senior Minister of Defense.
The Prime Minister Government announced implemented Recovery
has announced first Conditional MCO where MCO on 7 June 2020 12 Oct 2020
MCO on 16 March all economic sector and business where interstate travel
13 until 26 Oct.: Sabah
2020 activity operation were allowed and commercial activities were
14 until 27 Oct.: Selangor, Kuala Lumpur
on 4 May 2020. allowed on 10 June 2020 except for
& Putrajaya
the remaining areas in the Enhanced
MCO.
Phase 2 24 Oct. 2020: Extension CMCO for Sabah until 9 Nov. 2020
1 - 14 April Phase 4
29 April - 26 Oct. 2020: Extension CMCO for Selangor, Kuala Lumpur
Phase 3 12 May & Putrajaya until 9 Nov. 2020
15 - 28 April
On 23 April 2020, 7 Nov 2020
Government continued
MCO Phase 2 9 Nov. until 6 Dec.:
MCO for another 2 weeks
On 25 March 2020, the All states in Peninsular Malaysia except
until 12 May 2020.
MCO was extended for Perlis, Pahang and Kelantan
another 2 weeks until
14 April 2020. 5 Dec. 2020 : Extension CMCO for Sabah from 7 Dec. until 20 Dec. 2020
18 Dec. 2020 : Extension CMCO for Selangor, Kuala Lumpur & Sabah
MCO Phase 3 including certain localities in other states until 31 Dec. 2020
Government has extended 28 Dec. 2020 : Extension CMCO for Selangor, Kuala Lumpur & Sabah
| MALAYSIAN ECONOMIC STATISTICS REVIEW - VOL. 3/2021
MCO for another 2 weeks including certain localities in other states until 14 Jan. 2021
until 28 April 2020.
MOVEMENT CONTROL ORDER
*Note: Italic indicates the extension from the main announcementCHRONOLOGY OF MCO 2021
DEC JAN FEB MAR
2020
Recovery MCO Recovery MCO
(RMCO) (RMCO)
On 2 February 2021
CMCO announcement by Senior Minister
Phase 8 On 2 March 2021
Senior Minister (Security Cluster) (SecurityCluster) announcement
31 Dec 2020
RMCO 5 - 18 March 2021
-
1 – 14 January MCO 5 - 18 February 2021 Perlis, Melaka, Pahang, Terengganu,
31 March 2021 A National State of Sabah (except Nabawan District),
Kuala Lumpur, Selangor Emergency announced Klang Valley, Pulau Pinang, Melaka,
WP Putrajaya, WP Labuan and Kedah
Announcement by Senior and Sabah on 12 January 2021 by Johor, Sabah, WP Labuan, Kelantan,
(Langkawi District)
Minister (Security Cluster) YDPA Agong will last Pahang, Perak, Negeri Sembilan,
MCO 2.0 until 1 August 2021 and Kedah, Terengganu and Perlis CMCO 5 - 18 March 2021
On 31 December 2020, Prime Minister Kedah (except Langkawi District),
may be terminated
Government has announcement CMCO 1 - 14 February 2021 - Sarawak Kelantan, Pulau Pinang,
earlier depending on
announced Recovery On 11 January 2021 the COVID-19 situation Perak, Selangor, WP Kuala Lumpur,
MOVEMENT CONTROL ORDER
MCO to be continued Negeri Sembilan and Johor
On 13 February 2021
MALAYSIAN ECONOMIC STATISTICS REVIEW - VOL. 3/2021 |
until 31 March 2021 13 Jan – 4 Feb
State Disaster Management On 12 March 2021
Klang Valley, Pulau Pinang, Melaka Committee (SDMC) CMCO 16 – 29 March 2021
Johor Sabah and WP Labuan
On 16 March 21
On 15 January 2021 CMCO 15 February –
RMCO 19-31 March 2021
1 March 2021
Perlis, Kedah (except Kuala Kedah and
16 Jan – 4 Feb Kelantan On 16 February 2021 Kulim District), Perak, Pahang,
Terengganu, WP Putrajaya, Negeri
Senior Minister (Security Cluster) announcement MCO 19 February - 4 March 2021 Sembilan (except Seremban District),
On 19 January 2021 Selangor, WP Kuala Lumpur, Johor and Melaka, Sabah (except Nabawan
Pulau Pinang District) and WP Labuan
22 Jan – 4 Feb
CMCO 19 February - 4 March 2021 CMCO 19-31 March 2021
Pahang, Perak, Negeri Sembilan Melaka, Sabah, WP Labuan, WP Kedah (Kuala Kedah and Kulim
Kedah, Terengganu and Perlis Putrajaya, Kelantan, Pahang, Perak, District), Pulau Pinang, Kelantan,
Negeri Sembilan, Kedah and Terengganu Selangor, WP Kuala Lumpur, Negeri
Sembilan (Seremban District) and Johor
Sarawak RMCO 19 February - 4 March 2021
MCO 16-31 March 2021
5
RMCO 13-27 January 2021 Perlis Sabah (Nabawan District)KEY REVIEW
• Global economic output for the year 2021 is expected to expand 4.0 per cent based on
“The Global Economic Prospects” updated in January 2021 by the World Bank. In Malaysia,
it is expected that the negative impact on the country’s Gross Domestic Product (GDP) may
lessen in 2021 as MCO 2.0 allows more economic sectors to operate with strict Standard
Operating Procedures (SOPs).
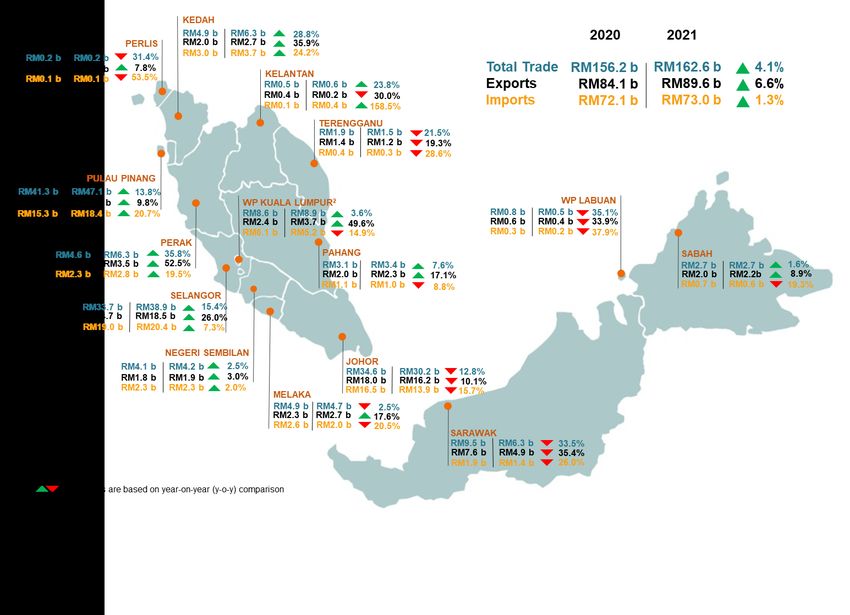
• Among the indicators that had shown favourable performance was Malaysia’s trade which
continued to expand by 4.1 per cent year-on-year to record RM162.6 billion in January 2021.
Exports of goods increased 6.6 per cent to RM89.6 billion while imports increased 1.3 per cent
to RM73.0 billion resulting in the increase of trade surplus at RM16.6 billion.
• The performance of IPI in January 2021 recorded an increase of 1.2 per cent, compared to
0.3 per cent in the same month of the previous year. The IPI in January 2021 was driven by the
Manufacturing index with a growth of 3.5 per cent. Other major trading partners of Malaysia
such as China, Singapore and South Korea also showed positive growth of IPI.
• Simultaneously, the Manufacturing sales in January 2021 rose 4.1 per cent
(December 2020: 4.5%) to RM122.9 billion. The rise in sales value was driven by the increase
in Food, beverages & tobacco Products (7.7%), Electrical & electronics products (6.4%) and
Transport equipment & other manufactures products (5.5%).
• However, the sales value of Wholesale & Retail Trade January 2021 recorded RM111.7 billion
with negative 2.7 per cent year-on-year due to Motor Vehicles which contracted 13.8 per cent.
The major contributor of the sales value was Wholesale trade with RM55.4 billion while Retail
trade recorded RM45.6 billion.
• The production of natural rubber decreased 31.0 per cent year-on-year to 45,735 tonnes in
January 2021 (January 2020: 66,259 tonnes). A similar trend was observed in the production
of palm fresh fruit bunches which recorded 5,718,447 tonnes in February 2021, decreased
12.3 per cent as compared to February 2020 (6,521,617 tonnes).
• Consumer Price Index (CPI) declined marginally by 0.2 per cent in the first month of 2021 to
122.1 as against 122.4 in the preceding year. The decrease in the overall index was attributed
by the decline in Transport (-5.1%); Housing, Water, Electricity, Gas & Other Fuels (-0.7%);
Clothing & Footwear (-0.4%) and Restaurants & Hotels (-0.1%) which contributed 44.5 per cent
to the overall CPI weight. Nevertheless, Food & Non-Alcoholic Beverages which contributed
29.5 per cent of the overall CPI weight, increased by 1.5 per cent to register 136.1 index point.
• In January 2021, the Producer Price Index (PPI) for local production recorded an improved
negative growth of 0.1 per cent (December 2020: -2.1%). Similar trends were recorded by
selected major trading countries such as Taiwan -2.9% (December 2020: -5.0%), Japan -1.6%
(December 2020: -2.0%), Thailand -0.6% (December 2020: -0.9%) and the United Kingdom
(UK) -0.2% (December 2020: -0.5%).
6 | MALAYSIAN ECONOMIC STATISTICS REVIEW - VOL. 3/2021KEY REVIEW
• The number of labour force in January 2021 posted marginal increase of 31.5 thousand
persons as compared to the previous month to 16.02 million persons. Modest labour supply
situation was observed with the number of employed persons recording an increase of
21.9 thousand persons to 15.24 million persons (January 2020: 15.32 million persons)
while the number of unemployed ascended by 9.7 thousand to 782.5 thousand persons
(December 2020: 772.9 thousand persons). Accordingly, the Labour Force Participation Rate
(LFPR) rose by 0.1 percentage point to 68.5 per cent while unemployment rate increased
slightly to 4.9 per cent.
• The latest release of Leading Index (LI) for January 2021 signalled that the Malaysia’s
near-term economic prospects remain upbeat, concomitant with the deployment of COVID-19
vaccine. This is reflected by the double-digit growth of the total trade performance recorded in
February 2021. Year-on-year, the LI increased further to 110.0 points in the reference month
from 101.7 points in the same month last year to attain an annual growth of 8.2 per cent. It is
expected that the gradual easing of the containment measures taken by the government may
reduce the pressure on the economy.
MALAYSIAN ECONOMIC STATISTICS REVIEW - VOL. 3/2021 | 7OVERVIEW
Economic Overview
On the global front, the COVID-19 vaccination programme rollout across the globe continues. According to
World Health Organization (WHO), more than 363 million doses of vaccines have been administered as of
17th March 2021. Although international travel restrictions remained in most countries, the rise in the number of
doses given will allow more relax containment measures and will give hope to the global economic recovery.
The World Bank through “The Global Economic Prospects” updated in January 2021, described that global
economic output for the year 2021 is expected to expand 4.0 per cent.
Entering the year 2021, National Statistics Office of United Kingdom (UK) reported that UK GDP contracted
9.2 per cent in January 2021 compared with the same month a year ago, as government restrictions to varying
degrees have slowed down economic activity in the UK. During the month, the Production industries fell by
4.9 per cent attributed by the contraction of 5.2 per cent in Manufacturing sector and double-digit decline of
10.4 per cent in Services sector. Month-on-month, UK GDP dropped 2.9 per cent following sluggish performances
in Services sector (-3.5%), Production (-1.5%) and Construction (0.9%).
In Malaysia, the spike of COVID-19 cases following the new wave of infections since the fourth quarter of 2020
has prompted the reinstatement of CMCO in various states. Subsequently, the worsening of the pandemic
has led to the re-imposition of MCO 2.0 in six states of 13th January 2021 and was expanded to almost all
states. Nevertheless, MCO 2.0 allows more economic sectors to operate with strict SOPs and this may lessen
the negative impact on the country’s GDP. In addition, the country has enrolled its nationwide COVID-19
immunisation in February 2021 by targeting over 26 million Malaysian residents. Malaysia’s economic
performance for 2020 contracted 5.6 per cent, as illustrated in Table 1.
Table 1:Percentage
Table 1: Percentage Change
Change of Malaysia’s
of Malaysia’s GDP GDP, Q1 2019 - Q4 2020 (%)
2019 2020
Economic Activity/ Expenditure 2019 2020
Q1 Q2 Q3 Q4 Q1 Q2 Q3 Q4
GDP 4.3 -5.6 4.5 4.8 4.4 3.6 0.7 -17.1 -2.6 -3.4
PRODUCTION
1. Services 6.1 -5.5 6.4 6.1 5.8 6.2 3.1 -16.2 -4.0 -4.9
2. Mining & Quarrying -2.0 -10.0 -1.5 0.9 -4.1 -3.4 -2.0 -20.0 -6.8 -10.6
3. Construction 0.1 -19.4 0.4 0.5 -1.4 1.0 -7.9 -44.5 -12.4 -13.9
4. Agriculture 2.0 -2.2 5.8 4.3 4.0 -5.7 -8.7 1.0 -0.5 -0.7
5. Manufacturing 3.8 -2.6 4.1 4.3 3.6 3.0 1.5 -18.3 3.3 3.0
EXPENDITURE
1. Private Final Consumption Expenditure 7.6 -4.3 7.7 7.8 7.0 8.1 6.7 -18.5 -2.1 -3.4
2. Gross Fixed Capital Formation -2.1 -14.5 -3.5 -0.6 -3.7 -0.7 -4.6 -28.9 -11.6 -11.9
3. Government Final Consumption Expenditure 2.0 4.1 6.3 0.3 1.0 1.3 5.0 2.3 6.9 2.7
4. Net Exports: 9.7 -12.3 13.0 32.9 12.0 -12.4 -37.0 -38.6 21.9 12.4
Exports -1.3 -8.8 0.1 0.5 -2.1 -3.4 -7.1 -21.7 -4.7 -1.8
Imports -2.5 -8.3 -1.6 -2.3 -3.5 -2.4 -2.5 -19.7 -7.8 -3.3
Source: Department of Statistics, Malaysia
Looking at the performance of production in the first month of 2021, the production of natural rubber continued
to decrease by registering negative 31.0 per cent to 45,735 tonnes (December 2020: -14.7%; 49,825 tonnes).
Similarly, crude palm oil production declined further from negative 0.02 per cent to negative 3.8 per cent during
the same period.
In the meantime, the Manufacturing sales stood at RM122.9 billion recording year-on-year growth of
4.1 per cent (December 2020: 4.5%). The growth was driven by the increase in Food, Beverages & Tobacco
Products (7.7%), Electrical & Electronics Products (6.4%) and Transport Equipment & Other Manufactures
Products (5.5%). Month-on-month comparisons, the sales value decreased 1.4 per cent. The Manufacturing
output in January rose 3.5 per cent year-on-year (December 2020: 4.1%) contributed by Electrical & Electronics
Products (7.9%), Petroleum, Chemical, Rubber & Plastic Products (4.5%) and Wood Products, Furniture, Paper
Products & Printing (2.4%).
8 | MALAYSIAN ECONOMIC STATISTICS REVIEW - VOL. 3/2021OVERVIEW
During the same period, output of the Mining sector decline 4.5 per cent as against negative 5.4 per cent in
December 2020. The decrease was due to the fall in Crude Oil & Condensate index (-9.4%) and Natural Gas
index (-0.5%).
In addition, sales value of Wholesale & Retail Trade decreased by 2.7 per cent
(December 2020: -0.3%) to record RM111.7 billion in January 2021. The decline was due to Motor Vehicles
which slipped 13.8 per cent (December 2020: 7.4%) while Retail Trade and Wholesale Trade dropped
2.5 per cent and negative 0.4 per cent respectively. In terms of volume index, Wholesale & Retail Trade registered
a decrease of 2.9 per cent (December 2020: -0.9%) attributed by the contraction in Motor Vehicles (-13.1%) and
Retail Trade (-3.2%). Meanwhile, for Wholesale Trade, posted a marginal decrease of 0.1 per cent.
Malaysia’s trade in January 2021 amounted to RM162.6 billion, expanded by 4.1 per cent
(December 2020: 6.5%) as compared to the same month in the previous year. Exports posted an expansion
of 6.6 per cent while imports grew by 1.3 per cent to RM73.0 billion, resulting in a trade surplus which grew by
38.0 per cent year-on-year to RM16.6 billion.
Overall, January 2021 saw major economic indicators showing either a slower or decreasing trend particularly
in Agriculture, Mining and Wholesale & Retail Trade sub-sectors. However, the Manufacturing sector continued
its positive growth in which to some extent managed to mitigate the decline in other economic indicators.
Chart 1: Annual Growth Rate of Leading Index (Smoothed) and Business Cycle (Grey Shaded Areas),
January 1991 to January 2021
Per Cent (%) Peak
Peak Trough Peak Trough Peak Trough
12/97 11/98 2/01 2/02 1/08 3/09 2/20
15
10
5
0
-5
-10
91 92 93 94 95 96 97 98 99 00 01 02 03 04 05 06 07 08 09 10 11 12 13 14 15 16 17 18 19 20 21
Year
Source: Department of Statistics, Malaysia
Malaysia’s economic growth for the year 2021 is expected to be influenced by several factors such as a
nationwide vaccination programme, strong commodity prices and recovery in exports. The latest release of
Leading Index (LI) for January 2021 signalled that the Malaysia’s near-term economic prospects remain upbeat,
concomitant with the deployment of COVID-19 vaccine. Year-on-year, the LI increased further to 110.0 points in
the reference month from 101.7 points in the same month last year to attain an annual growth of 8.2 per cent.
The trend is in line with the monthly change of January LI which posted 0.7 per cent. The gradual easing of the
containment measures taken by the government are seen to reduce the pressure on the economy.
MALAYSIAN ECONOMIC STATISTICS REVIEW - VOL. 3/2021 | 9BOX ARTICLE
MEASURING POTENTIAL OUTPUT AND OUTPUT GAP
IN MALAYSIA1
Mohd Arif Ahmad2, Salmah Salleh3, Intan Nazira Mohd Idris4, Rahidah Mohd Nor5
2
Department of Statistics, Malaysia Selangor
3,4,5
National Accounts Statistics Division, Department of Statistics, Malaysia
INTRODUCTION
Potential output is used to indicate the medium to long-term sustainable real output in the economy and its
growth rate. Meanwhile, the output gap is defined as the percentage deviation of the actual output level from
the potential level. It measures the degree of utilization of production factors in the economy and is frequently
seen as an indicator of possible inflationary pressures. Gross Domestic Product (GDP) is widely known as one
of the indicators used to measure the robustness of a country’s economy. By estimating the potential output,
economists can measure the output gap where the percentage difference between the actual output (GDP) and
the potential output is calculated (Alichi, 2015).
An economy is healthy when the output gap reaches zero levels, where the actual output is equal to potential
output (Darby & McIntyre, 2018). Therefore, a country must close the gap by implementing proper measures.
Depending on the situation, implementations of fiscal and monetary policy are required to close the gap. If the
output gap is negative, it is suggested that the central bank lowered the interest rate to increase demand and
reduce inflation. However, if the output gap is positive, the central bank should raise the interest rate to control
demand in the economy (Sarwat & Ahmed Saber, 2013).
Measures of potential output and output gap depend on the model specification, method of estimation, and time
horizon (Ladiray, Mazzi & Sartori, 2003). Considering uncertainty in the methods used, it is a common practice
among researchers to apply various approaches in estimating potential output to compare the accuracy of
estimation between models (Chuah & Shahrier, 2014).
Based on a previous study, Malaysia’s output gap has consistently close to zero levels, reflecting the economy’s
great performance. However, unintended shock towards the economy probably will affect the potential output
and output gap (Alichi, 2015). COVID-19 pandemic that shocked Malaysia’s economy dramatically has raised
concern about economic survival. Projection of potential output from previous years will indirectly give us the
initial view of how the 2020 output gap’s growth would be expected.
This study aims to estimate the potential output and output gap of Malaysia from 1995 to 2020. There are two
methods used, namely linear trend and Hodrick-Prescott (HP) filter. These methods are commonly used to
measure potential output. Under the pandemic’s weight, it is a great concern for how an economy survives;
therefore, projecting the potential output of previous years will greatly contribute to the monitoring of the
country’s development. It is assumed that the output gap for 2020 might be larger than in 2019 due to the steep
downturn of GDP.
FINDINGS
Chart 1a shows the growth of actual GDP and the estimation of potential output from 1995 to 2020.
Overall, potential output grew by 4.5 per cent to 4.8 per cent based on the estimation of both Univariate methods,
i.e., linear trend and HP filter. During the period of 1995 to 2019, Malaysia has experienced three phases of
economic recession, namely the Asian Financial Crisis from 1997 to 1998, the technology bubble from 2001 to
2002, and the global financial crisis in 2009. Nevertheless, the lowest potential output recorded among the three
phases was during the Asian Financial Crisis at negative 4.5 per cent.
In 2019, potential output was estimated to grow slightly slower at 4.5 per cent compared to 2018 (4.6%).
This situation stems from the shrinking investment activity where private investment has recorded 1.6 per cent,
the slowest growth since the global financial crisis. Moreover, the decline of the Construction sector and the fall
in oil prices also affected the investment activities. Despite the economic uncertainty caused by the COVID-19
pandemic in 2020, the potential output is projected to grow at 4.5 per cent.
1
The original article was published in The National Accounts Capital Stock Statistics 2019. New arrangement and latest GDP data was used in
this article.
10 | MALAYSIAN ECONOMIC STATISTICS REVIEW - VOL. 3/2021Chart 1: Actual GDP and Potential Output
Chart 1a: Actual GDP and Potential Output, 1996 - 2020
Growth (%)
12.0
10.0
8.0
6.0 4.7
4.0 4.5
2.0
0.0
-2.0
-4.0
-6.0
-5.6
-8.0
-10.0
1996
1997
1998
1999
2000
2001
2002
2003
2004
2005
2006
2007
2008
2009
2010
2011
2012
2013
2014
2015
2016
2017
2018
2019
2020
HP Filter Linear Trend GDP
Source: Department of Statistics, Malaysia
Chart 1b shows the output gap from 1995 to 2020. During this period, Malaysia has gone through periodic
cycles of positive and negative output gaps. Significant negative gaps occurred during the four phases of the
economic downturn: the Asian Financial Crisis of 1997 to 1998, the technology bubble in 2001 to 2002, the
Chart
global financial crisis in 2009 and the COVID-19 2: Output Gap
pandemic in 2020.
Chart 1b: Output Gap, 1995 - 2020
RM billion % of potential
1,600 1,451.9 8.0
1,400 6.0
1,200 1,342.0 4.0
2.0
1,000
0.0
800
-2.0
600
-4.0
400 -6.0
-7.6
200 -8.0
- -10.0
1995
1996
1997
1998
1999
2000
2001
2002
2003
2004
2005
2006
2007
2008
2009
2010
2011
2012
2013
2014
2015
2016
2017
2018
2019
2020
Output gap Actual GDP Potential Output
Source: Department of Statistics, Malaysia
In 2019, the output gap was estimated to be narrower at 2.3 per cent compared to the previous year
(2018: 2.6%). This shows that Malaysia’s economy operated close to its potential despite the volatile external
economic environment. However, the study found that the output gap is widening to a negative 7.6 per cent due
to the COVID-19 pandemic.
CONCLUSION
This article describes the estimated potential output and output gap in Malaysia using the linear trend and HP
filter methods. The study found that the output gap was positive for almost the entire period (1995 to 2020)
except for the four phases of the economic downturn, i.e., during the Asian Financial Crisis, the technology
bubble, the global financial crisis and the COVID-19 pandemic. Before 2020, the largest and longest negative
output gap was during the Asian Financial Crisis, followed by the global financial crisis and the technology
bubble. In 2019, potential output was estimated to grow by 4.5 per cent (2018: 4.6%), while the output gap
was estimated to be smaller at 2.3 per cent compared to the previous year (2018: 2.6%). This shows that
the Malaysian economy operates close to its potential despite the volatile external economic environment.
However, the projected output gap widened in 2020, negative 7.6 per cent due to the economic instability of
the COVID-19 pandemic. Based on these findings, the Government needs to formulate measures and policies
to attract private investment with higher value-added to achieve more sustainable GDP growth and close the
output gap.
MALAYSIAN ECONOMIC STATISTICS REVIEW - VOL. 3/2021 | 11
11REFERENCES
Alichi, A. (2015, July). A New Methodology for Estimating the Output Gap in the United States. IMF Working
Paper WP/15/144. Retrieved from IMF website:https://www.imf.org/en/Publications/WP/Issues/2016/12/31/A-
New-Methodology-for- Estimating-the-Output-Gap-in-the-United-States-43040.
Bank Negara Malaysia (2012). Potential Output and the Output Gap in Malaysia. Bank Negara Malaysia:
Quarterly Bulletin, Second Quarter 2012. Kuala Lumpur: Bank Negara Malaysia.
Chuah, L. L., and Shahrier, N. A., (2014), Estimating Malaysia’s Output Gap: Have We Closed the Gap? Bank
Negara Malaysia Working Papers. WP4/2014. Retrieved from BNM website: https://www.bnm.gov.my/index.
php?ch=en_publication&pub=papers.
Darby. J. & McIntyre, S. (2018, June). The Output Gap: What it is, how can it be estimated and are estimates
fit for policy makers’ purposes? Fraser of Allander Institute: Economic Commentary, 42(2), 44-50. Glasgow:
University of Strathclyde.
European Central Bank (2011, January). Trends in Potential Output. European Central Bank: Monthly Bulletin,
73-85.
Ladiray, D., Mazzi, G. L., Sartori, F. (2003). Statistical Methods for Potential Output Estimation and Cycle
Extraction. European Commission Working Papers and Studies. Retrieved from https://ec.europa.eu/eurostat/
web/products-statistical-working-papers/-/KS-AN-03-015
Sarwat Jahan & Ahmed Saber Mahmud (2013, September). What is The Output Gap? Finance and Development:
Quarterly Publication of International Monetary, 50 (3), 38-39.
12 | MALAYSIAN ECONOMIC STATISTICS REVIEW - VOL. 3/2021SECTORAL PERFORMANCE
AGRICULTURE

Oil Palm
The production of fresh fruit bunches in February 2021 was 5,718,447 tonnes, decreased 4.8 per cent from
the previous month (Chart 2). The production also decreased by 12.3 per cent year-on-year as compared to
February 2020 (6,521,617 tonnes).

                       Chart 2: Production Chart
                                           of Fresh          Fruit
                                                 1: Production of fresh Bunches,           January
                                                                        fruit bunches, January             2020
                                                                                               2020 - February 2021 - February 2021

                                       Tonnes ('000)

                                      12,000.0

                                      10,000.0

                                       8,000.0

                                                                                                                                                                        5,718.4
                                       6,000.0

                                       4,000.0

                                       2,000.0

                                           0.0
                                                    Jan         Feb     Mar     Apr      May     June     July     Aug     Sep    Oct      Nov     Dec     Jan     Feb
                                                                                                   2020                                                      2021

                                      Source: Malaysian Palm Oil Board

The average production of fresh fruit bunches in February 2021 was 0.97 tonnes/ha, declined from
1.04 tonnes/ha in January 2021 (Table 2). By region, the production in Peninsular Malaysia increased to
1.04 tonnes/ha from 1.03 tonnes/ha in the previous month. Meanwhile, Sabah/Sarawak decreased to
0.91 tonnes/ha month-on-month (January 2021: 1.04 tonnes/ha).
                         Table 1: Average Production Of Fresh Fruit Bunches (tan/ha) by Region, February 2020 – February 2021

Table 2: Average Production of Fresh Fruit Bunches by Region, February 2020 - February 2021 (tonnes/ha)
                                                                                                                                  2020                                                               2021
                           Region
                                                                Feb           Mac         Apr           May          June          Jul           Aug        Sept             Oct    Nov    Dec    Jan    Feb
            Malaysia                                            1.10          1.19        1.41          1.44          1.65        1.59           1.62       1.65             1.50   1.33   1.19   1.04   0.97
            Peninsular Malaysia                                 1.15          1.30        1.57          1.49          1.84        1.76           1.77       1.77             1.55   1.37   1.23   1.03   1.04
            Sabah/ Sarawak                                      1.06          1.06        1.27          1.40          1.50        1.45           1.50       1.55             1.47   1.29   1.16   1.04   0.91

           Source: Malaysian Palm Oil Board

The four productions of major oil palm product decreased due to the decline in the average production of
fresh fruit bunches per hectare in February 2021. Production of Crude palm oil in February 2021 was
1,105,590 tonnes, dropped 1.9 per cent compared to January 2021 (1,126,457 tonnes) as shown in Chart 3.
Similarly, Palm kernel fell by 1.9 per cent. For the same period, Palm kernel cake and Crude palm kernel oil declined
4.4 per cent and 4.2 per cent respectively. Year-on-year comparison also showed a significant downward trend
for the four productions of major oil palm products namely Crude palm oil (-14.2%), Palm kernel (-18.1%),
Palm kernel cake (-19.3%) and Crude palm kernel oil (-19.6%).

                   Chart 3: Production Chart
                                        by2:Major       Oil Palm Products, January 2020 - February 2021
                                             Production by major oil palm products, January 2020 - February 2021

                                             Tonnes ('000)

                                           2,000.0

                                           1,800.0

                                           1,600.0

                                           1,400.0

                                           1,200.0
                                                                                                                                                                         1,105.6
                                           1,000.0

                                            800.0

                                            600.0

                                            400.0                                                                                                                    271.6

                                            200.0
                                                                                                                                                                          139.8
                                                 0.0                                                                                                                 123.3
                                                          Jan     Feb     Mar      Apr     May     June     July     Aug    Sep     Oct     Nov      Dec    Jan       Feb
                                                                                                        2020                                                     2021

                                                                  Crude palm oil           Palm kernel             Crude palm kernel oil          Palm kernel cake

                                       Source: Malaysian Palm Oil Board

      14                                                                  | MALAYSIAN ECONOMIC STATISTICS REVIEW - VOL. 3/2021
AGRICULTURE
Exports of oil palm products in February 2021 amounted to 1,517,222 tonnes with a value of
RM5,578.22 million (Chart 4). Year-on-year comparison showed a decrease of 11.6 per cent compared
to February 2020 (1,717,111 tonnes). Similarly, the exports went down 5.8 per cent month-on-month
(January 2021: 1,610,572 tonnes). The main contributors to the exports of oil palm products were palm oil which
accounted for 59.0 per cent (895,556 tonnes) followed by oleochemicals 17.0 per cent (257,222 tonnes) and
palm kernel cake 9.9 per cent (150,533 tonnes).
Chart 3: Exports of oil palm products, January 2020 - February 2021
Chart 4: Exports of Oil Palm Products, January 2020 - February 2021
Tonnes ('000)
3,000.0
2,500.0
2,000.0
1,500.0
1,517.2
1,000.0
500.0
0.0
Jan Feb Mar Apr May June July Aug Sep Oct Nov Dec Jan Feb
2020 2021
Source: Malaysian Palm Oil Board
Although palm oil is the main contributor to the exports of oil palm products, the quantity decreased by
17.8 per cent to 895,556 tonnes as against February 2020. The highest exports were to India at 141,173 tonnes
with a contribution of 15.8 per cent of total palm oil exports. This was followed by China (9.4%), the Netherlands
(6.8%), the Philippines (4.9%) and Saudi Arabia (3.7%).
Exports to European Union countries in February 2021 amounted to 108,076 tonnes, declined 27.2 per cent
from 148,477 tonnes in same month last year. The Netherlands was the highest importer of palm oil with a
contribution of 56.4 per cent, followed by Italy (17.3%) and Spain (10.4%).
Meanwhile, imports of palm oil in February 2021 were 87,326 tonnes, an increase of 30.9 per cent compared
to February 2020 (66,735 tonnes) as shown in Chart 5. Nonetheless, palm kernel oil and palm kernel posted
declines of 4.8 per cent and 19.7 per cent respectively. In terms of month-on-month comparison, palm kernel
increased significantly by 76.4 per cent compared to January 2021, while palm oil and palm kernel oil decreased
47.1 per cent and 29.8 per cent respectively.
Chart 4: Imports by oil palm products, January 2020 - February 2021
Chart 5: Imports by Oil Palm Products, January 2020 - February 2021
Tonnes ('000)
300.0
250.0
200.0
150.0
100.0
87.3
50.0
21.3
0.0 3.1
Jan Feb Mar Apr May June July Aug Sep Oct Nov Dec Jan Feb
2020 2021
Palm Oil Palm Kernel Oil Palm Kernel
Source: Malaysian Palm Oil Board
MALAYSIAN ECONOMIC STATISTICS REVIEW - VOL. 3/2021 | 15AGRICULTURE
Rubber
Malaysian Rubber Board allowed plantation and commodity sectors including rubber industry activity to operate
during the period of MCO, CMCO and RMCO in compliance with the SOP set by the National Security Council.
In January 2021, production of natural rubber decreased 8.1 per cent month-on-month to 45,735 tonnes
(December 2020: 49,825 tonnes). Year-on-year comparison also recorded a decline of 31.0 per cent from
66,259 tonnes in January 2020 as shown in Chart 6.
Chart 1: Production of Natural Rubber, January 2020 – January 2021
Chart 6: Production of Natural Rubber, January 2020 – January 2021
Tonnes ('000)
70.0
60.0
50.0 45.7
40.0
30.0
20.0
10.0
0.0
Jan Feb Mar Apr May June July Aug Sep Oct Nov Dec Jan
2020 2021
Source: Department of Statistics, Malaysia
In January 2021, 88.5 per cent (40,468 tonnes) of natural rubber production was recorded by smallholders
as compared to estates with 11.5 per cent (5,267 tonnes). Month-on-month comparison indicated that the
production by smallholders fell by 9.0 per cent and production of estates also decreased 1.9 per cent as
against December 2020. In comparison with January 2020, production of estates and smallholders decreased
17.3 per cent and 32.4 per cent respectively.
Exports of natural rubber decreased 21.8 per cent to 48,125 tonnes from 61,547 tonnes in December 2020.
Meanwhile, in terms of year-on-year comparison, exports of natural rubber showed an increase of 5.0 per cent
from 45,827 tonnes in the same month last year. The main destination for exports of natural rubber in January
2021 was P.R. China contributed 43.4 per cent of total exports followed by Iran (8.5%), Germany (5.9%), Turkey
(5.1%) and Finland (4.3%).
Standard Malaysian Rubber (S.M.R.) contributed 96.9 per cent (46,654 tonnes) of total natural rubber
exports with the S.M.R. 20 comprising 66.3 per cent (30,935 tonnes) of total exports. The highest exports
of rubber gloves was to the United States at 29,319 tonnes followed by Germany (5,848 tonnes) and China
(5,176 tonnes) as depicted in Table 3. Exports value increased by 21.6 per cent to RM5.6 billion as compared
to RM4.6 billion in December 2020.
Table 1: Top 10 Exports Countries of Rubber Gloves,
December 2020 and January 2021
Table 3: Top 10 Exports Countries of Rubber Gloves, December 2020 - January 2021
Quantity (Tonnes) Value (RM million)
Countries
December January December January
2020 2021 2020 2021
United States 27,247 29,319 1,709.9 2,156.5
Germany 5,600 5,848 314.0 408.1
China 5,611 5,176 237.8 241.0
Japan 3,929 4,296 273.6 315.6
United Kingdom 3,681 3,652 231.9 246.4
Brazil 1,654 3,022 70.7 147.2
Netherlands 2,281 2,565 149.3 187.3
Turkey 1,597 2,416 82.1 139.8
Canada 2,907 2,382 199.8 176.6
Spain 2,473 2,206 157.9 163.3
Source: Department of Statistics, Malaysia
16 | MALAYSIAN ECONOMIC STATISTICS REVIEW - VOL. 3/2021AGRICULTURE
Imports of natural rubber decreased 7.2 per cent to 132,152 tonnes in January 2021
(December 2020: 142,441 tonnes). Three main types of imported natural rubber were Latex Concentrated
(33,402 tonnes), Standard Rubber (17,298 tonnes) and Ribbed Smoked Sheets (7,305 tonnes). Natural rubber
was mainly imported from Thailand which amounted 45,048 tonnes in January 2021.
The stocks of natural rubber recorded 278,817 tonnes as compared to 249,551 tonnes in December 2020,
an increase of 11.7 per cent as depicted in Chart 7.
Chart 2: Stocks of Natural Rubber, January 2020 – January 2021
Chart 7: Stocks of Natural Rubber, January 2020 – January 2021
Tonnes ('000)
350.0
300.0 278.8
250.0
200.0
150.0
100.0
50.0
0.0
Jan Feb Mar Apr May June July Aug Sep Oct Nov Dec Jan
2020 2021
Source: Department of Statistics, Malaysia
Domestic consumption of natural rubber recorded 47,115 tonnes, an increase of 12.1 per cent year-on-year
(January 2020: 42,015 tonnes). More than 70 per cent of the natural rubber was used by the rubber gloves
industry at 76.4 per cent (35,978 tonnes), followed by rubber thread industry at 9.1 per cent (4,306 tonnes) and
tyres & tubes industry with 5.9 per cent (2,799 tonnes) .
Average price of Latex Concentrate recorded a decrease of 550.26 cent per kilogramme as compared to
December 2020 (582.79 cent per kilogramme). Standard Malaysian Rubber 20 (S.M.R. 20) also decreased to
628.58 cent per kilogramme as compared to 628.74 cent per kilogramme for the same period. Meanwhile, for
year-on-year the price increased 19.7 per cent for latex concentrated and increased 6.5 per cent for S.M.R 20
(Chart 8).
Chart 3: Monthly Average Prices for Natural Rubber, January 2020 – January 2021
Chart 8: Monthly Average Prices for Natural Rubber, January 2020 – January 2021
Cent/ Kg
750
700
650 633
600 629
550 550
500
487
450
400
350
300
250
Jan Feb Mar Apr May June July Aug Sep Oct Nov Dec Jan
2020 2021
Field Latex Price (Cent/ Kg) Scrap Price (Cent/ Kg)
Latex Concentrate Price (Cent/ Kg) SMR 20 Price (Cent/ Kg)
Source: Malaysian Rubber Board
Malaysia is one of the major producers of natural rubber under the Association of Natural Rubber Producing
Countries (ANRPC) with a production of 45.7 thousand tonnes in January 2021. Thailand recorded
475.8 thousand tonnes, Indonesia 237.9 thousand tonnes, Vietnam 100.0 thousand tonnes, India 88.0 thousand
tonnes, Cambodia 32.5 thousand tonnes, Philippines 5.3 thousand tonnes, Sri Lanka 7.5 thousand tonnes and
P.R. China 0.6 thousand tonnes.
MALAYSIAN ECONOMIC STATISTICS REVIEW - VOL. 3/2021 | 17INDUSTRY AND MANUFACTURING
Industrial Production Index (IPI)
The year 2021 is expected to bring hope and a positive impact to industry players in various sectors as the
demand for goods and services are expected to increase after experiencing a gloomy demand throughout
2020 due to the COVID-19 pandemic. The National COVID-19 Vaccination Programme in 2021 is a catalyst to
boost the confidence of industry players to increase their productions and subsequently the country’s economic
activities are expected to return to normal in the near future.
The performance of IPI in January 2021 recorded an increase of 1.2 per cent as compared to the same month
of the previous year (December 2020: 1.7%) as shown in Chart 9. The performance of IPI in January 2021
was driven by the Manufacturing index with a growth of 3.5 per cent. Meanwhile, Mining and Electricity index
contracted 4.5 per cent and 4.6 per cent respectively.
Chart 9: Industrial Production Index (Year-on-Year), January 2020 – January 2021
Per cent (%)
10.0 3.5
5.0 1.2
0.0
-4.5
-5.0
-4.6
-10.0
-15.0
-20.0
-25.0
-30.0
-35.0
-40.0
Jan Feb Mar Apr May June Jul Aug Sept Oct Nov Dec Jan
2020 2021
IPI Mining Manufacturing Electricity
Source: Department of Statistics, Malaysia
The Manufacturing sector, which is the largest component in the IPI, posted 3.5 per cent in January 2021 steered
by the growth of both exports and domestic-oriented output. Exports and domestic-oriented output continued
to record positive growth of 4.6 per cent (December 2020: 4.7%) and 1.5 per cent (December 2020: 3.0%)
respectively as compared to the same period of the previous year. The largest contributors to export-oriented
output were Manufacture of rubber products, 75.1 per cent (December 2020: 61.5%), Manufacture of plastic
products, 11.5 per cent (December 2020: 8.7%) and Manufacture of computer, electronic & optical products,
9.0 per cent (December 2020: 8.8%). Meanwhile, the growth of domestic-oriented output was dominated by the
increase of Manufacture of paper & paper products which grew 8.7 per cent (December 2020: 5.3%), followed
by Manufacture of food products, 6.3 per cent (December 2020: 3.8%) and Manufacture of basic metals,
4.8 per cent (December 2020: 3.6%).
IPI for the selected major trading partners of Malaysia showed positive growth in January 2021 such as China,
35.1 per cent (December 2020: 7.3%), Singapore, 8.6 per cent (December 2020: 16.2%) and South Korea,
7.5 per cent (December 2020: 2.8%). Meanwhile, the United States of America (USA) declined 1.8 per cent
(December 2020: -3.2%) while Japan dropped 5.3 per cent (December 2020: -3.2%).
The Mining sector’s output shrank 4.5 per cent in January 2021 as compared to the same period of the previous
year. The decrease was influenced by Crude Oil & Condensate (-9.4%) and Natural Gas (-0.5%).
18 | MALAYSIAN ECONOMIC STATISTICS REVIEW - VOL. 3/2021INDUSTRY AND MANUFACTURING
Manufacturing
In January 2021, Malaysia’s Manufacturing sales stood at RM122.9 billion, rose 4.1 per cent
(December 2020: 4.5%) as compared to the previous year (Chart 10). The rise in sales value was driven by the
growth registered in Food, beverages & tobacco Products (7.7%), Electrical & electronics products (6.4%) and
Transport equipment & other manufactures products (5.5%).
In addition, Malaysia’s exports in January 2021 registered a growth of 6.6 per cent (December 2020: 10.8%)
to RM89.6 billion as compared to the same month of the preceding year. Expansion in exports were seen in
China, USA, Viet Nam, Singapore and Hong Kong SAR. Exports of manufactured goods which contributed
88.5 per cent to Malaysia’s total exports, grew by 11.7 per cent to RM79.4 billion as compared to January 2020.
The growth was supported by higher exports of electrical & electronic (E&E) products notably in automotive
industry, 5G network and smart devices. The increase was also registered for rubber products, metal, chemicals
and chemical products as well as optical and scientific products.
Chart 10: Sales Value of Manufacturing Sector, January 2020 – January 2021
RM billion Year-on-Year (%)
140.0 10.0
122.9
5.0
120.0
4.1 0.0
100.0 -5.0
80.0 -10.0
-15.0
60.0 -20.0
40.0 -25.0
-30.0
20.0
-35.0
- -40.0
Jan Feb Mar Apr May June Jul Aug Sept Oct Nov Dec Jan
2020 2021
Source: Department of Statistics, Malaysia
Sales value Year-on-Year (%)
Based on Monthly Manufacturing Survey, total employees engaged in January 2021 were 2.23 million persons,
a decrease of 2.4 per cent as compared to 2.28 million persons in January 2020. The decline in total employees
was mainly attributed by industries of Textile, wearing apparel, leather & footwear (-16.4%); Transport equipment
& other manufactures (-5.6%) and Wood products, furniture, paper products and printing (-5.4%). Salaries &
wages paid amounted to RM7.6 billion, dropped by 1.4 per cent in January 2021 as against the same month
of the preceding year. The sales value per employee rose by 6.7 per cent to record RM55,213. Meanwhile, the
average salaries & wages per employee was RM3,396 (January 2020: RM3,360).
Signs of improvement for manufacturing activities in February 2021 are foreseen, as depicted by the better
performance of domestic exports during the month.
MALAYSIAN ECONOMIC STATISTICS REVIEW - VOL. 3/2021 | 19SERVICES
Wholesale and Retail Trade
It has been a year since the first COVID-19 case was confirmed in Malaysia and took a huge toll on the country.
However, the country was placed under the MCO again in January (MCO 2.0) in another bid to flatten the
curve of infection. The year 2020 ended with Malaysia’s Wholesale & Retail Trade recording a total sales of
RM1.2 trillion, slipped 5.9 per cent as compared to 2019, the slowest growth on record following the impact of
this pandemic.
Performance of Sales Value
Sales value of Wholesale & Retail Trade recorded RM111.7 billion in January 2021 to register a growth of
negative 2.7 per cent year-on-year. This fall was due to Motor Vehicles which contracted 13.8 per cent or
RM1.7 billion to record RM10.6 billion. Similarly, Retail Trade also recorded a decrease of RM1.2 billion
(-2.5 %) to register RM45.6 billion while Wholesale Trade decreased by RM0.2 billion to RM55.4 billion (-0.4%)
year-on-year (Exhibit 1).
Exhibit 1: Performance of Wholesale & Retail Trade Sector, January 2021
Exhibit 1: Performance of Wholesale & Retail Trade Sector, January 2021
126.8
Wholesale & Wholesale Retail Motor
Retail Trade Trade Trade Vehicles
RM billion
Jan. 2021 111.7 55.4 45.6 10.6
Sales
value YoY (%) -2.7 -0.4 -2.5 -13.8
MoM (%) -3.3 0.2 -2.6 -20.5
Original
130.5 131.8 142.9 90.6
Jan. 2021
Volume
YoY (%) -2.9 -0.1 -3.2 -13.1
Index MoM (%) -2.3 0.8 -1.7 -16.8
(2015=100)
Seasonally
Adjusted 126.8 129.1 138.4 87.4
(SA)
MoM (SA) -2.0 0.1 2.2 -18.2
Source: Department of Statistics, Malaysia
As for month-on-month comparison, sales value dropped 3.3 per cent in January 2021 after the implementation
of MCO 2.0 for six states starting from 13 January 2021.
Performance of Motor Vehicles
Motor Vehicles subsector registered a double-digit negative growth of 13.8 per cent owing to Sales of Motor
vehicles which slumped 17.6 per cent to RM5.3 billion this month due to the enforcement of MCO 2.0 that
impacted the traffic volume of showrooms. Apart from that, majority of the customers had made purchases in
advance with anticipation that the sales tax exemption incentive under the PENJANA package would end on
31 December 2020. Similarly, the Sales of Motor Vehicles Parts & Accessories also dropped 9.3 per cent to
record RM2.9 billion. Maintenance & Repair of Motor Vehicles also went down 9.5 per cent to RM1.5 billion.
Within the same period, the Sales for Maintenance & Repair of Motorcycles also recorded a negative growth of
11.1 per cent to RM0.9 billion (Chart 11).
20 | MALAYSIAN ECONOMIC STATISTICS REVIEW - VOL. 3/2021SERVICES
Chart 1: Performance of Motor Vehicles Subsector, January 2021
Chart 11: Performance of Motor Vehicles Subsector, January 2021
Sale, Maintenance & Repair of
Motorcycles
-11.1%
Sale of Motor Vehicles Parts &
Accessories
-9.3%
Maintenance and Repair of Motor
Vehicles
-9.5%
Sales of Motor Vehicles -17.6%
-20.0 -15.0 -10.0 -5.0 0.0
Source: Department of Statistics, Malaysia
Performance of Retail Trade
Sales value of Retail Trade declined 2.5 per cent due to the decrease in sales of non-essential products
namely Retail Sale of Other Goods in Specialised Stores (-7.0%), Retail Sale of Other Household Equipment
in Specialised Stores (-4.6%) and Retail Sale of Cultural & Recreation Goods in Specialised Stores (-5.1%).
However, sales of essential goods posted a positive growth namely Retail Sale in Non-specialised Stores which
registered 1.4 per cent to RM16.6 billion year-on-year. This was followed by Retail Sale of Food, Beverages
& Tobacco in Specialised Stores which rose 6.0 per cent to RM2.9 billion. Retail Trade Not in Stores, Stalls
or Markets also expanded 9.0 per cent to RM0.4 billion followed by Retail Sale via Stalls & Markets which
increased 5.6 per cent to RM0.1 billion (Chart 12).
Chart 2: Performance of Retail Trade Subsector, January 2021
Chart 12: Performance of Retail Trade Subsector, January 2021
Retail Trade Not in Stores, Stalls or Markets 9.0%
Retail Sale Via Stalls & Markets 5.6%
Retail Sale of Other Goods in Specialised Stores -7.0%
Retail Sale of Cultural & Recreation Goods in
-5.1%
Specialised Stores
Retail Sale of Other Household Equipment in
-4.6%
Specialised Stores
Retail Sale of Information & Communication
0.3%
Equipment in Specialised Stores
Retail Sale of Automotive Fuel in Specialised
-14.1%
Stores
Retail Sale of Food, Beverages & Tobacco in
6.0%
Specialised Stores
Retail Sale in Non-specialised Stores 1.4%
-18.0 -15.0 -12.0 -9.0 -6.0 -3.0 0.0 3.0 6.0 9.0 12.0
Source: Department of Statistics, Malaysia
MALAYSIAN ECONOMIC STATISTICS REVIEW - VOL. 3/2021 | 21SERVICES
Performance of Wholesale Trade
In January 2021, the fall of 0.4 per cent year-on-year for Wholesale Trade was mainly due to Other Specialised
Wholesale which contracted 4.9 per cent. This was followed by Wholesale of Agricultural Raw Materials &
Live Animals and Wholesale on a Fee or Contract Basis which posted a growth of negative 6.0 per cent and
negative 4.7 per cent respectively. However, the Wholesale of Food, Beverages & Tobacco grew 4.9 per cent to
settle at RM10.7 billion. This was followed by Wholesale of Household Goods which increased 4.2 per cent to
RM11.6 billion. Similarly, Wholesale of Machinery, Equipment & Supplies also expanded by 2.7 per cent
year-on-year to generate sales of RM4.8 billion (Chart 13).
Chart 3: Performance of Wholesale Trade Subsector, January 2021
Chart 13: Performance of Wholesale Trade Subsector, January 2021
Non-specialised Wholesale Trade 7.5%
Other Specialised Wholesale -4.9%
Wholesale of Machinery, Equipment & Supplies 2.7%
Wholesale of Household Goods 4.2%
Wholesale of Food, Beverages & Tobacco 4.9%
Wholesale of Agricultural Raw Materials & Live
-6.0%
Animals
Wholesale on a Fee or Contract Basis -4.7%
-9.0 -6.0 -3.0 0.0 3.0 6.0 9.0
Source: Department of Statistics, Malaysia
Performance of Volume Index
In terms of volume index, Wholesale & Retail Trade registered a fall of 2.9 per cent year-on-year due to Motor
Vehicles which decreased by 13.1 per cent. This was followed by Retail Trade and Wholesale Trade with a drop
of 3.2 per cent and 0.1 per cent respectively. In the meantime, the seasonally adjusted volume index inched
down to 2.0 per cent month-on-month (Chart 14).
Chart 4: Performance of Volume Index of Wholesale & Retail Trade Sector, January 2021
Chart 14: Performance of Volume Index of Wholesale & Retail Trade Sector, January 2020 - January 2021
Per cent (%)
10.0
0.0
-2.9
-10.0
-20.0
-30.0
-40.0
-50.0
Jan Feb Mar Apr May June July Aug Sep Oct Nov Dec Jan
2020 2021
Source: Department of Statistics, Malaysia
22 | MALAYSIAN ECONOMIC STATISTICS REVIEW - VOL. 3/2021SERVICES
Retail Sales Index of Selected Countries
Looking at the performance of retail sales in other selected countries, Singapore and Hong Kong portrayed
similar downward year-on-year trend as Malaysia. Hong Kong continues to post a notable year-on-year decline
amid the fourth wave of COVID-19 infection and it is expected that their retail trade will remain challenging in
the near term as the pandemic continues to pose a threat and inbound tourism remains frozen.
Similarly, Singapore dipped 8.4 per cent in January 2021 partly due to the base effect, as Chinese New Year
celebration last year led to higher sales recorded as compared to January this year. Furthermore, most industries
still recorded a decline in sales as they remain affected by low number of visitors’ arrivals.
On the other hand, the UK increased 2.2 per cent as compared to January 2020 whilst on a month-on-month
basis, retail sales registered a negative growth as they were affected by the renewed closure of non-essential
retailers in the latest lockdown. However, South Korea showed no change from the same period of the previous
year as shown in Table 4.
Table 1: Retail Sales Index of Selected Countries, Year-on-Year (%), January 2021
Table 4: Retail Sales Index of Selected Countries (Year-on-Year), January 2021 (%)
Singapore Hong Kong United Kingdom South Korea
-8.4 -14.5 2.2 0.0
Source: Other Selected NSOs
Prospect for February 2021
On the outlook of Wholesale & Retail Trade in February 2021, the slow performance is expected to remain due
to the short working month plus the extension of MCO. However, the Motor Vehicles subsector is expected
to improve due to the introduction of new models with the latest specifications and at very competitive prices.
Moreover, the continuation of sales tax exemption incentive under PENJANA and aggressive promotional
campaigns by car companies also helped to boost sales.
MALAYSIAN ECONOMIC STATISTICS REVIEW - VOL. 3/2021 | 23EXTERNAL SECTOR
Merchandise Trade
Malaysia experienced third wave of COVID-19 pandemic and was the largest outbreak in the country thus
far, but the impact on economic activity was not that bad as in the second quarter of 2020 as Malaysia is
adopting to live with the pandemic and new norms. Malaysia’s merchandise trade continued to perform
favourably in January 2021 with both exports and imports increased compared with the same month in 2020.
Exports expanded 6.6 per cent contributed by the increases in domestic exports and re-exports which grew
6.3 per cent and 7.5 per cent, respectively, while imports grew 1.3 per cent. Total trade in the current month
amounted to RM162.6 billion, rose 4.1 per cent from RM156.2 billion. The faster growth in exports compared with
imports contributed to the increase of trade surplus to RM16.6 billion, up 38.0 per cent from the same month last
year. On a month-on-month basis, exports and imports declined 6.4 per cent, 2.7 per cent respectively followed
by the declination of total trade and trade balance 4.8 per cent and 19.8 per cent respectively.
The increase in exports was mainly supported by higher outbound shipments of goods to China, which
increased by RM2.7 billion, followed by the USA (+RM1.6 billion), Vietnam (+RM1.2 billion), the EU
(+RM821.3 million) and Singapore (+RM621.0 million), while lower exports were recorded mainly to
the Republic of Korea, India and Switzerland which declined by RM783.2 million, RM611.3 million and
RM322.1 million, respectively. The rise in imports was led by higher inbound shipments of merchandise
from Taiwan (+RM1.0 billion), China (+RM793.9 million), Hong Kong (+RM686.1 million), Indonesia
(+RM662.1 million) and Thailand (+RM573.6 million), while imports from both Saudi Arabia and the
United States of America declined by RM1.1 billion, respectively. China, Singapore, the USA and the EU
remained as Malaysia’s major trading partners in January 2021 with total contributions of 48.7 per cent
(January 2020: 47.7%).
Malaysia’s exports of goods in January 2021 increased to RM89.6 billion from RM84.1 billion in January
2020. The expansion was contributed mainly from Electrical and electronic (E&E) products and Rubber
gloves with an increase of RM4.2 billion (+13.1%) and RM4.1 billion (+270.6%), respectively. Meanwhile
exports of palm oil and palm oil products returned to a negative trend with a year-on-year fall of 5.5 per cent
(-RM302.4 million) after surged 47.4 per cent in December 2020. Exports of Refined petroleum products, Liquefied
natural gas and Crude petroleum continued to decline by RM2.0 billion (-33.7%), RM1.6 billion (-40.0%) and
RM700.8 million (-31.9%), respectively as shown in Chart 15. E&E products, Rubber gloves and Palm oil and
palm oil-based products were Malaysia’s main export products in January 2021 with a total contribution of
51.1 per cent (January 2020: 52.1%).
Chart 15: Malaysia’s Exports by Top 10 Major and Selected Products, January 2021 (Percentage Change)
Iron & steel bars, rods 61.3 %
Heating and cooling equipment & parts 13.5 %
Crude petroleum -31.9 %
Timber and timber-based products -1.6 %
Liquefied natural gas -40.0 %
Professional, scientific and controlling instruments &
9.6 %
apparatus
Refined petroleum products -33.7 %
Palm oil & palm oil-based products -5.5 %
Rubber gloves 270.6 %
Electrical & electronic products 13.1 %
-100.0 -50.0 0.0 50.0 100.0 150.0 200.0 250.0 300.0
Source: Department of Statistics, Malaysia
24 | MALAYSIAN ECONOMIC STATISTICS REVIEW - VOL. 3/2021You can also read