A new Tactran Regional Transport Strategy
               2023-2033
    Main Issues Consultation Report
                  v3.0
←
→
Page content transcription
If your browser does not render page correctly, please read the page content below
A new Tactran Regional Transport Strategy
2023-2033
Main Issues Consultation Report
v3.0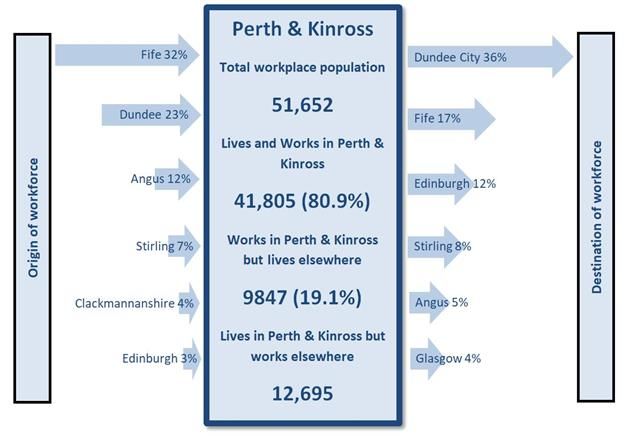
Executive Summary

Executive Summary

01/06/2021 16:27                                                                   p2/50
P:\4. Administration\5. Website\RTS\2021 06 01 MIR v3.0.docx
Executive Summary

Introduction                                                   Key stages for writing a new Regional Transport Strategy for the Tactran partners
What is the Regional Transport Strategy?                       Identify problems,         June/July 2021: Local members and other stakeholders to
The Regional Transport Strategy (RTS) is a                     opportunities issues and   consider issues highlighted in Main Issues Report
                                                               constraints
partnership plan setting the strategic transport
framework and priorities for the area covered by               Objective Setting          August/September 2021: Tactran Board consider feedback from
the Angus, Dundee, Perth and Kinross, and                                                 Councils and stakeholders and agree draft objectives
Stirling Councils.                                             Initial Option             Late 2021: Local members and stakeholders consider alternative
                                                               identification             strategies /options
                                                               Detailed Option            Early 2022: Tactran Board consider feedback from Councils and
Nature of the region                                           Appraisal                  stakeholders and agree preferred strategies/options
                                                                                          Summer 2022: Consult on draft plan
The key factors that shape the travel demands of
the region are:                                                Adoption                   Autumn 2022: New administrations consider draft plan and
                                                                                          responses
     •    the urban / rural split: 29% of our
                                                                                          Dec 2022: Tactran board to consider feedback from Councils
          population live in locations classified as
          remote or rural                             In addition, the following appraisal process will be undertaken to ensure proportionate
     •    national travel demands: predominately      consideration is taken of the our most critical priorities: Strategic Environmental
                                                      Appraisal, Equality & Human Rights Impact Assessment; Fairer Scotland Duty Assessment;
          via the A9, A90 and A82, as well as the
                                                      Health Inequalities Impact Assessment and Child Rights and Wellbeing Assessment
          Highland Mainline, East Coast Mainline
          and the West Highland Line, the region accommodates significant north-south travel to other parts of Scotland through the region
     •    regional travel demands: most of the work and shopping trips undertaken by most of the region fall within two travel to work areas
          covering Tayside (Angus, Dundee, Perth and Kinross and North Fife) and Forth Valley (Stirling, Clackmannanshire and Falkirk).
          Nonetheless, there are many of our communities that look towards either Aberdeen or Glasgow or even Oban as their closest or most
          easily accessed centres for shopping, employment or further education.

01/06/2021 16:27                                                                                                                                p3/50
P:\4. Administration\5. Website\RTS\2021 06 01 MIR v3.0.docx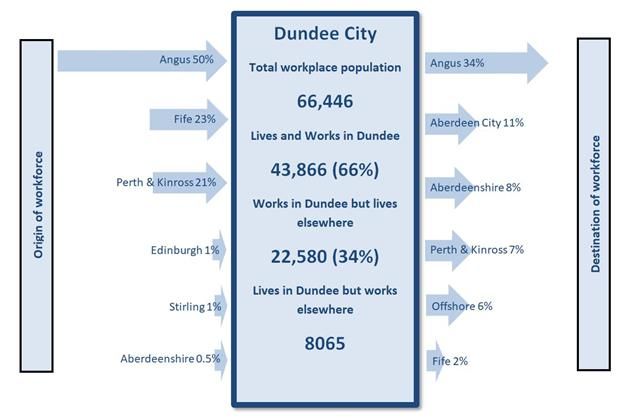
Executive Summary
The social Key social, environmental and economic problems and priorities
environmental and
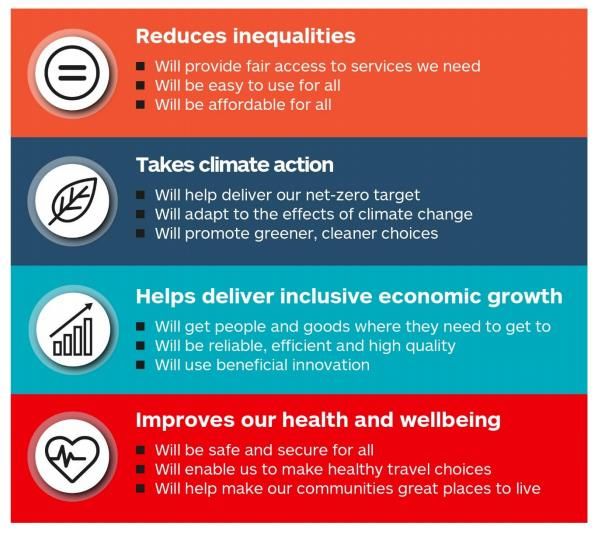
Reducing inequalities Taking climate action
economic priorities
for the region For our most disadvantaged communities, our rural Problems include:
communities, people with mobility difficulties, and at risk • The amount of trips made by car: Approximately 50%-
The RTS must support groups, problems include 70%3 of work trips in the region are made by car. This
the environmental, • The availability of transport options: e.g. 10%-15% 16-25yr is informed by where people live and need/chose to
social and economic olds have no public transport access to further education1 travel e.g. 29% of the population live in remote and
priorities for the • Transport poverty: e.g. 33%-54% of the Angus, Perth and rural locations
Kinross & Stirling datazones are at risk of Transport • The locations where rail-lines and key roads are at risk
region set by
Poverty2. during extreme weather events. Closure of routes in
development plans, • Inclusive networks. e.g. 10.5% of the people in Dundee our rural areas can lead to very long diversionary
city region deals, have a long term health problem or disability routes
economic and Helping deliver inclusive economic growth Improving our health and wellbeing
environmental
strategies and the • Supporting existing employment sectors and locations, • Addressing road safety problems
local outcome including tourism • Air quality problems: Low Emission Zone declared in
• Supporting growth sectors and locations in our City Region Dundee and Air Quality Management Areas declared in
improvement plans.
Deals and Local Development Plans Perth and Crieff
Under the four • Connecting goods and people to markets and opportunities. • Supporting access to health services: In Angus 60% of
In particular, Connecting Scotland’s cities is vital to the households without a car are more than 60mins drive
National Transport
growth of both our major settlements and Scotland as a from a hospital
Strategy priorities, key • Supporting areas of poor health: 33% of Dundee lives in
whole
problems and • Access to jobs and training: In Angus 43% of the population, the lowest 20% of SIMD datazones ranked by health
priorities for each local and in Perth&Kinross 33%, are unable to access a choice of
authority area have 3 employment locations within 60mins by public transport
been identified.
1 Tactran TRACC Accessibility Modelling
2 TayCities and Forth Valley STPR2 Case for Change Reports
3 Census and Scottish Household Survey data
01/06/2021 16:27 p4/50
P:\4. Administration\5. Website\RTS\2021 06 01 MIR v3.0.docx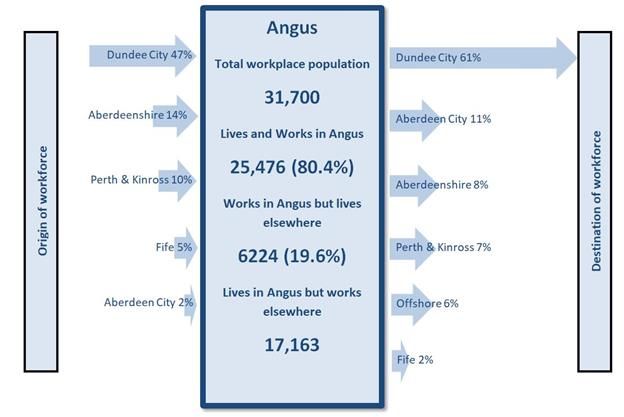
Executive Summary

New travel demands                                                                 Housing growth areas                  New     Approx %
                                                                                                                         housing increase in homes
Travel habits are changing at an unprecedented rate, and the uncertainties of
how, where and how often we travel will be considered later. Nonetheless,          Arbroath                              884      36%
the greatest new pressures on our transport networks will still come from new      Blairgowrie                           1677     41%
housing and economic developments as promoted in our development plans,            Bridge of Earn                        1797     156%
our economic strategies and the city region deals.
                                                                                   Crieff                                920      28%
New travel demands will also arise from growth of existing industries, such as     Dundee                                2855     4%
tourism. It is also worth remembering that significant growth in
                                                                                   Durieshill and South Stirling         2500 +   -
Aberdeen/shire and the Highlands will also add to new trips on the networks in
                                                                                   Gateway                               800
the Tactran area.
                                                                                   Stirling Eastern Villages (Cowie,     1718     56%
                                                                                   Fallin, Plean, Throsk)
                                                                                   Forfar                                978      15%
                 Economic growth areas                                             Luncarty                              760      110%
                 Arbroath / Montrose
                                                                                   Montrose                              702      12%
                 Dundee Waterfront / Western Gateway /                             Perth                                 8581+    40%
                 Linlathan / MSIP
                 Perth West / Ruthvenfield Rd                                      Scone                                 823      37%
                 Durieshill / Kildean / Forthside                                  Stirling City (excluding Durieshill   2088     14%
                                                                                   and South Stirling Gateway)

01/06/2021 16:27                                                                                                                         p5/50
P:\4. Administration\5. Website\RTS\2021 06 01 MIR v3.0.docx
Executive Summary

Problems and opportunities with our transport networks
The existing transport networks across the Tactran region have a range of problems and opportunities which will affect our ability to address
the environmental, economic and social priorities.
  Strengths and weaknesses of our transport networks to….
  Reduce inequalities                                                    Deliver inclusive economic growth
  Enabling access to local facilities                                    Reliable journey times
     +ve good daytime bus service in Dundee                                 -ve hindered by pinch points on our strategic networks at Dundee, Perth and Stirling
     -ve limited services across the rural areas. This is compounded     Enabling access to jobs
     by issues of transport poverty in rural and disadvantage               -ve limited public transport choices across much of the region
     communities                                                         Connecting the cities / region
  By being inclusive                                                         +ve our cities are well connected on the strategic trunk and rail networks
     -ve much of our transport networks are not inclusive for            Supporting tourism
     people with mobility difficulties                                      +ve Long distance walking and cycling routes, inc West Highland Way
                                                                            -ve limited sustainable travel options in our rural areas

  Take climate action                                                    Health and wellbeing
  Resilience to poor weather                                             Safety
     -ve Flooding (Larbert/Bridge of Allen/Dunblane) of rail lines;         -ve accident hotspots on A9 at junctions and on single carriageway sections
     landslips (West Highland Line); snow on higher level roads          Pollution
  By enabling sustainable travel                                            -ve traffic volumes and pinch points contributing to air quality issues
     +ve compact towns and cities, many small towns within cycling       Access to healthcare
     distance of each other                                                 -ve Rural communities and those disadvantaged communities not near our main
     -ve declining bus services, limited EV infrastructure and greater      hospital
     provision of walking and cycling facilities required                   +ve main hospitals near rail
                                                                         Enabling active travel
                                                                            +ve compact towns and cities, many small towns within cycling distance of each other
                                                                             ve greater provision of walking and cycling facilities required

01/06/2021 16:27                                                                                                                                 p6/50
P:\4. Administration\5. Website\RTS\2021 06 01 MIR v3.0.docx
Executive Summary
Future uncertainties and risks that may influence travel
There are more uncertainties now than at any other point in terms of where, how, and how often we travel. It will be important to identify
what are the future risks and opportunities that we need to take into account as we plan for the future.
For convenience, we have identified the following headings to help identify various uncertainties, but many uncertainties could easily fall
under more than one heading:
• Political or global ‘drivers’…. events that trigger society to change behaviour e.g.
• Technology…. technological advances which give us greater opportunities to how we may travel or live our lives
• Policy…. Government policy responding to political or global triggers, or the technologies that exist, to promote or manage
change
• Attitudes…. the public response to any of the above
Potential Uncertainties include:
• The pace at which Governments, business and society respond to Climate Change
• Increased use of technology may reduce work, shopping trips, etc
• Economic busts and booms which affect the amount of travel
• Driverless car technology may increase effective road capacity long term but in the medium term more capacity may be
required. Makes single occupancy car use available to everyone
• Pandemics and terrorism can affect willingness to use public transport
01/06/2021 16:27 p7/50
P:\4. Administration\5. Website\RTS\2021 06 01 MIR v3.0.docxIntroduction
Content
1. Introduction 1.1 What is the Regional Transport Strategy? P9
1.2 Why write a new Regional Transport Strategy (RTS3) now?
1.3 Process for preparing a new RTS & indicative timescales
1.4 Main Issues Report: Identifying the problems, issues, opportunities and
constraints
1.5 Alignment with Scotland’s Second National Transport Strategy
1.6 Alignment with other Government Strategies
2. Nature of the region 2.1 The Urban/Rural Split
2.2 Location in Scotland: National travel demands to and through the
region
2.3 Regional Travel Demands
2.4 Socio-economic profile
Social, environmental and 3.1 The priorities for reducing inequalities
economic priorities
01/06/2021 16:27 p8/50
P:\4. Administration\5. Website\RTS\2021 06 01 MIR v3.0.docxIntroduction
3.2 The priorities for taking climate action
3.3 The priorities for inclusive economic growth
3.4 The priorities for health and wellbeing
4. Significant new travel demands in the area
5. Problems and opportunities with our existing transport network
6. Future uncertainties and risks that may influence travel
7. What will the RTS look like?
8. Questions
01/06/2021 16:27 p9/50
P:\4. Administration\5. Website\RTS\2021 06 01 MIR v3.0.docxIntroduction
1. Introduction
01/06/2021 16:27 p10/50
P:\4. Administration\5. Website\RTS\2021 06 01 MIR v3.0.docxIntroduction
1.1 What is the Regional Transport Strategy? Figure 1: How the RTS supports national and local priorities
The Regional Transport
Strategy (RTS) sets the
National & Local Transport Strategies
strategic transport Strategic and Local Development Plans
framework and strategic NTS2 Priorities
Enhancing transport networks to enable development
transport priorities for the Reduce inequalities
Ensuring development is accessible by a choice of modes
area covered by the Take climate action
Angus, Dundee, Perth and Help deliver inclusive economic growth
Kinross, and Stirling Improve health and wellbeing Regional Transport Strategy
Councils. RTSs have promotes and brings forward the strategic
transport infrastructure to support local
statutory status, as environemntal, economic and social priorities
provided for in the in line with NTS2 priorities
Transport (Scotland) Act
2005. The Act places a Local Outcome Improvement Plans / Child Poverty
duty on constituent Action Plans / Climate Change Action Plans / LEZs and
Councils, Health Boards AQMPs
and other public bodies to Improving accessibility to jobs, training and services City Region Deals
perform their functions Ensuring transport networks enable and support inclusive
Promoting healthy and active lifestyles
economic growth
which relate to, or which Promoting safe and healthy communities
are affected by transport, Reducing carbon emissions
consistently with their Reducing pollutants from transport
respective Regional
Transport Strategy.
The Strategy takes account of the social, economic and environmental priorities for the region as identified both locally and nationally,
especially those priorities identified within the spatial strategies (the respective Regional Spatial Strategies and Local Development Plans) and
the economic strategies (including the respective City Region Deals).
01/06/2021 16:27 p11/50
P:\4. Administration\5. Website\RTS\2021 06 01 MIR v3.0.docxIntroduction
1.2 Why write a new Regional Transport Strategy now?
The last Regional Transport Strategy for the Tactran area was adopted in 2015. A lot has changed since then. We now need to consider the
impacts on the Region of:
• Climate Change Emergency
• National Transport Strategy (NTS2) & Strategic Transport Projects Review (STPR2)
• TayCities and Stirling & Clackmannanshire City Region Deals
• New and emerging Local and Regional Spatial Strategies
• The impacts of Covid 19
1.3 Process for preparing a new RTS & indicative timescales
Report preparation Engagement/decisions
Identify problems, opportunities issues and constraints Engagement: June-July: Local members and other stakeholders to consider issues
Main Issues Report identifies the potential issues shaping a RTS which will shape the strategy
for consultation with internal and external stakeholders Decision Point: August/September: Tactran Board consider feedback from
Objective Setting Councils and stakeholders and agree draft objectives
Initial Option identification Engagement: Late 2021 Local members and stakeholders consider alternative
Identify alternative strategies / options. High level appraisal of strategies /options
these options against objectives (e.g. prelim appraisal) Decision Point: Early 2022 Tactran Board consider feedback from Councils and
stakeholders and agree preferred strategies/options
Detailed option appraisal Engagement: Summer 2022: Stakeholder engagement on draft plan
Jan-May 2022 (detailed) Option appraisal, inc modelling where Engagement: Autumn 2022: New Tactran Board and new administrations to
appropriate consider responses to draft plan
Jan- May 2022: Draft RTS
Adoption Decision Point: Dec 2022: Tactran board to consider final RTS
01/06/2021 16:27 p12/50
P:\4. Administration\5. Website\RTS\2021 06 01 MIR v3.0.docxIntroduction
1.4 Main Issues Report: Identifying the problems, issues, opportunities and constraints
The first stage of the exercise is to identify the problems, issues, opportunities and constraints that will shape the Regional Transport Strategy.
We will do this by undertaking engagement exercises with stakeholders based on the content of this Main Issues Report, identifying the
problems, issues, opportunities and constraints which will help inform:
- What the RTS needs to
support
- The RTS objectives
- The alternative options
we have for achieving
the RTS objectives
This Main Issues Report
suggests the problems, issues,
opportunities and constraints
by considering:
- The nature of the
region
- The social, economic
and environmental
priorities for the region
- The key travel
demands
- The problems and opportunities the transport network
- Future uncertainties and risks that may influence travel
To help stakeholders respond to the questions posed in this main issues report, we gave an idea of what the Regional Transport Strategy itself
may look like in section 6.
01/06/2021 16:27 p13/50
P:\4. Administration\5. Website\RTS\2021 06 01 MIR v3.0.docxIntroduction
1.5 Alignment with Scotland’s Second National Transport Strategy Figure3: National Transport Strategy Priorities
There are a number of national, regional and local strategies that the RTS seeks
to support, in particular, Scotland’s Second National Transport Strategy (NTS2)
adopted in February 2020 which the RTS needs to align with. In structuring the
document around the NTS2 priorities, we will demonstrate how the RTS aligns
with, and delivers, national priorities.
Accordingly, this Main Issues Report considers:
- What are the problems and priorities in the region for reducing
inequalities; taking climate action; helping deliver inclusive economic
growth; and improving our health and wellbeing
- What are the strengths, weaknesses, opportunities and threats of and to
our transport networks for reducing inequalities; taking climate action;
helping deliver inclusive economic growth; and improving our health and
wellbeing
The writing of this Main Issues Report overlaps with Transport Scotland’s
Second Strategic Transport Projects Review (STPR2). Useful information on the
transport problems, opportunities, issues and constraints in the region can be found in the respective STPR2 Case for Change Reports:
Forth Valley STPR2 Case for Change Report
Tay Cities STPR2 Case for Change Report
01/06/2021 16:27 p14/50
P:\4. Administration\5. Website\RTS\2021 06 01 MIR v3.0.docxIntroduction
1.6 Alignment with other Government Strategies
The RTS will also ensure that it supports and helps bring forward those transport activities that support the priorities of all relevant national
strategies, including:
Table 1: Principal objectives of national strategies
National Clean Air for Climate Change Plan Fairer Public Health Priorities Economic
Planning Scotland Scotland for Scotland Strategy
Framework 4 Action Plan
• A plan for net • Meet • all greenhouse gases to net-zero by • A Fairer A Scotland where we: • investing in
zero national 2045 Scotland • live in vibrant, people
emissions emissions • Just Transition For All healthy and safe • fostering a
• A plan for ceiling • Phase out the need for petrol and diesel • Ending places and culture of
resilient directives cars and vans in Scotland by 2030 Child communities innovation
communities • remove the need for new petrol and Poverty • flourish in our early • stimulating
• A plan for diesel heavy vehicles by 2035. • A Strong years inclusive
wellbeing • ensure that the majority of new buses Start • have good mental growth
economy purchased from 2024 are zero-emission For All wellbeing • creating
• A plan for • decarbonise scheduled flights within Young • reduce the use of opportunity
better, Scotland by 2040 People • and harm from promoting
greener • Scotland’s passenger rail services will be • Fairer alcohol, tobacco and Scotland
places decarbonised by 2035 Working other drugs internationally
• Reduce car kilometres by 20% by 2030 Lives • have a sustainable,
• By 2032 low emissions solutions will be • A inclusive economy
widely adopted at Scottish ports Thriving with equality of
Third outcomes for all
Age • eat well, have a
healthy weight and
are physically active
01/06/2021 16:27 p15/50
P:\4. Administration\5. Website\RTS\2021 06 01 MIR v3.0.docx2. Nature of the region
Section 2 summarises the key characteristics of the region which shape our travel demands, namely:
- The urban/rural split
- National travel demands to and through the region
- Regional travel demands
- Socio- economic profile
Q1. Current travel demands: Have we captured the main factors which shape where (from/to) people and goods
travel to and through the region?
2.1 The Urban/Rural Split
The Tactran region covers the local authority areas of Angus, Dundee, Perth Urban/rural split
and Kinross and Stirling. Accordingly, it is a large geographic area including • 62.7% live in urban areas (Dundee, Perth, Stirling,
the cities of Dundee, Perth and Stirling as well as 13% of the most remote Arbroath, Forfar, Montrose, Brechin)4
communities in Scotland6. Whilst our transport networks to and within • 29% live in remote and rural areas, and 8.3% live in small
accessible towns4
Dundee, Perth and Stirling are constrained by their respective rivers, travel
• 12% of Angus, 9% of Perth and Kinross and 8% of Stirling’s
to and from our rural communities are often defined by the mountains and datazones are in the lowest 5% of SIMD access domain5
glens within which they sit.
4
Scottish Government Urban/Rural Classification https://www.gov.scot/publications/scottish-government-urban-rural-classification-2016/pages/2/
5 Scottish Indices of Multiple Deprivation 2020
6 SIMD 2020: 13% of the lowest 5% of national datazones ranked by the SIMD access domain are within the Tactran area
01/06/2021 16:27 p16/50
P:\4. Administration\5. Website\RTS\2021 06 01 MIR v3.0.docx2.2 Location in Scotland: National travel demands to and through the region
The area sits in the heart of Scotland with all trunk road and rail routes National Routes passing through the region
between the Highlands (inc Inverness and Fort William), the North East (inc
• M80/M9/A9
Aberdeen) and the Central Belt passing through the region. The travel
• M90/A90
demands to and from these locations therefore need to be taken into account
• A84/A82
when we consider transport and travel in the region.
• Aberdeen/Inverness to Glasgow/Edinburgh rail services
In addition to our towns, cities, mountains, glens and coast, we also have • Glasgow to Fort William/Oban rail services
major destinations which attract visitors to the region, including:
• Loch Lomond and the Trossachs and Cairngorms National Parks
• Blairdrummond Safari Park / Stirling Castle / Wallace Monument / V&A / Scone Palace / Glamis / Gleneagles / Carnoustie
2.3 Regional Travel Demands
Travel to work areas define where most of us live and work, and by extension where we are most likely to shop and play. Accordingly they
often reflect where the strongest demands for travel are. Travel to work areas are rarely contained within a single local authority area, and
there are two strong travel to work areas which cover a large proportion of the region’s population:
• TayCities TTWA covering Dundee, and large parts of Angus, Perth and Kinross and North-east Fife (79.8% Tay Cities residents work in
Tay Cities area (Of all journeys starting in Perth & Kinross, Angus and Dundee City, 81%, 86% and 90% end within the Tay Cities Region
respectively)7
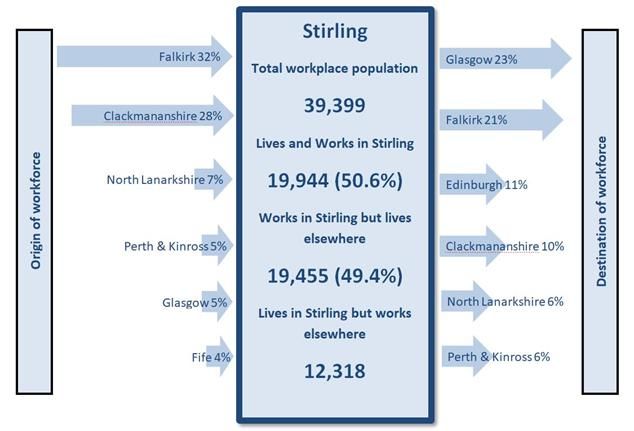
• Forth Valley TTWA covering large parts of Clackmannanshire, Falkirk and Stirling (65.1% Forth Valley residents work in Forth Valley
area)
These ‘travel to work areas’ areas are also reflected in the regional institutions that serve these areas such as:
7
2011 Census data
01/06/2021 16:27 p17/50
P:\4. Administration\5. Website\RTS\2021 06 01 MIR v3.0.docxTaycities: NHS Tayside, with hospitals in Dundee, Perth and Stracathro; Dundee and Angus College with principal sites in Dundee and
Arbroath
Forth Valley: NHS Forth Valley with hospital sites in Larbert, Alloa and Stirling; Forth Valley College with sites in Stirling, Alloa and
Falkirk.
It would however be wrong to not recognise that other communities on either side of the Tactran ‘boundary’ operate in different travel to
work areas, table 2 summarises the key cross boundary ‘communities’. Figure 4 shows the main travel to work flows for the four council areas.
Table 2: Cross boundary travel to work areas
Area Issues New developments on the edge of the
Tactran boundary
TayCities TTWA (Angus, Perth Taybridgehead and NE Fife towns access key health, leisure, retail and Newport (150 houses)
and Kinross, Dundee and employment in Dundee. Wormit (212 houses)
North east Fife) Guardbridge Papermill (St Andrews
University)
Guardbridge (350 houses)
St Andrews Western Expansion (1000+
houses)
Forth Valley TTWA (Stirling/ Stirling City is a net importer of work trips, largely due to the proximity of the Grangemouth Investment Zone / Falkirk
Clackmannanshire / Falkirk) communities in Forth Valley. Access for much of the Clackmannanshire Growth Deal
population to Glasgow and the west is via Stirling. Key regional hospital (Forth
Valley Hospital) located in Larbert.
Kinross-shire / Fife (Kinross / Strong links to Fife for health, leisure and employment. Also at edge of West Fife developments have potential
Dunfermline) Edinburgh TTW area. Queen Margaret Hospital (Dunfermline) to increase traffic towards M90 corridor
eg Westfield Business Park
NE Angus / Aberdeenshire Linkages to Aberdeen/Aberdeenshire with commuters. Also inflow from rural Edzell (200 houses)
(Montrose / Laurencekirk / Aberdeenshire communities such as Edzel to access services in Brechin etc. Laurencekirk (1100+ houses)
Stonehaven) Potential for inward flow to economic development around Montrose area.
01/06/2021 16:27 p18/50
P:\4. Administration\5. Website\RTS\2021 06 01 MIR v3.0.docxTable 2: Cross boundary travel to work areas NW Stirling / Oban Access to railway network means that travel to Oban is better than bus links to (Crianlarich / Tyndrum / Stirling for further education, shopping etc Dalmally / Oban) SW Stirling / Glasgow Access to health, leisure, employment largely within East (Strathblane / Balfron / Dunbartonshire/Glasgow area. Limited Public Transport options. Milngarvie) 01/06/2021 16:27 p19/50 P:\4. Administration\5. Website\RTS\2021 06 01 MIR v3.0.docx
Figure4: Travel to work flows

01/06/2021 16:27                                                                               p20/50
P:\4. Administration\5. Website\RTS\2021 06 01 MIR v3.0.docx
2.4 Socio-economic profile                                 Table3: Economic profile of the population                      Angus   DCC    PKC    Stirling     Scotland
Tables 3&4, and figure 5, highlight                        Economic activity
some of the key socio-economic                             Employees - full-time                                            39.5   34.7   40.1      36.7             39.6
characteristics of the region relating                     Employees - part-time                                            14.3   12.6   14.3      12.6             13.3
                                                           Self-employed                                                     8.5    4.9   10.6       9.3              7.5
to:
                                                           Economically inactive                                            30.7   35.6     29        32               31
     •    The level of economic activity,                  Retired                                                          18.1   14.2   17.2      15.1             14.9
          the kind of jobs people do and                   Student                                                           3.7   10.1    3.5       7.6              5.5
          what industries these are in                     Long-term sick or disabled                                        3.8      6    3.3       4.1              5.1
     •    Health and disability                            Unemployed                                                        4.2    5.7    3.3       3.9              4.8
     •    Car ownership                                    Occupation of those employed
                                                           Professional occupations                                         14.7   16.5   16.4        20             16.8
Key messages:                                              Skilled trades occupations                                       15.9   10.5   14.1      11.7             12.5
                                                           Associate professional and technical occupations                 12.9   11.5   12.4      12.7             12.6
     •    Dundee City (5.7%) is above
                                                           Elementary occupations                                           11.6   13.6   12.1      11.5             11.6
          the national average for
                                                           Administrative and secretarial occupations                       10.5   11.3     10       9.6             11.4
          unemployment (4.8%). Dundee
                                                           Caring, leisure and other service occupations                     9.4   10.3    8.9       8.7              9.7
          City is also above average for
                                                           Sales and customer service occupations                            7.6   12.2    9.3       8.8              9.3
          economically inactive, at 35.6%                  Managers, directors and senior officials                          8.2    6.2   10.5      11.1              8.4
          compared to the national                         Process, plant and machine operatives                             9.1    7.8    6.4         6              7.7
          average of 31%.                                  Key Industries in which people are employed
     •    Both Angus (18.1%) and Perth                     Human health and social work activities                          16.2   18.8   14.4      13.6               15
          and Kinross (17.2%), are above                   Wholesale and retail trade; repair of vehicles and m’cycles      14.6   17.6   15.6      14.9               15
          the national average (14.9%)                     Education                                                         8.6     10      8      10.2              8.4
          for the proportion of the                        Manufacturing                                                    10.7    7.4    6.1       6.6                8
          population that is retired                       Construction                                                      9.1      7    8.8       8.6                8
     •    Dundee and Stirling Cities, with                 Public administration and defence; compulsory social security     7.1    7.2    5.9         7                7
                                                           Accommodation and food service activities                         5.4    6.9    8.6       8.3              6.3
          their respective universities,
01/06/2021 16:27                                                                                                                                            p21/50
P:\4. Administration\5. Website\RTS\2021 06 01 MIR v3.0.docx
have a much higher % of students than the national average. NB Stirling City will have a much higher % of its population being students
than the council wide average would suggest
• Low levels of car ownership are not limited to our urban centres. Many households in our rural communities do not have access to a
car or van
Table4: Health profile Angus DCC PKC Stirling Scotland
Long-term health problem or disability (%)
Limited a lot 8.4 10.5 7.8 8.1 9.6
Limited a little 10.5 10.4 10.3 9.4 10.1
Not limited 81 79.1 81.9 82.5 80.4
Percentage of economically inactive people aged 16 to 12.3 17 11.5 13 16.6
74 who are long-term sick or disabled
Figure5: % of households with no access to a car or van
45
40
35
30
25
20
15
10
5
0
8
8
Census 2011
01/06/2021 16:27 p22/50
P:\4. Administration\5. Website\RTS\2021 06 01 MIR v3.0.docx3. Social, environmental and economic priorities
This section sets out the key social, economic and environmental problems and priorities for the region – as they relate to
the four NTS2 priorities - that our transport systems need to address.
Q2. Key social, environmental and economic priorities: Have we captured the key social (e.g. issues of inequalities and
health), environmental (e.g. climate change) and economic (e.g. promoting growth and access to jobs and training)
priorities which transport needs to support?
3.1 The priorities for reducing inequalities
All the local and regional partners recognise the problems of inequalities, in particular as they relate to:
- Our most disadvantaged communities
- People with mobility difficulties
- At risk groups
- Child poverty
The problems these groups experience include
The problem For who
The availability of • Our most deprived areas will have the lowest levels of car ownership, and will be more dependent on
transport to access public transport
services and education • Our rural areas, with lower population densities, will have limited public transport. 1:7 household in many
of our rural areas do not have access to a car9
(NB access to employment and healthcare are considered in sections 3.3 and 3.4)
9
2011 Census data
01/06/2021 16:27 p23/50
P:\4. Administration\5. Website\RTS\2021 06 01 MIR v3.0.docxThe problem For who
The cost of transport • For our most deprived residents, and also for residents in rural areas where travel costs are higher,
and the issues of transport costs will take up a disproportionate proportion of their income. This may mean people either go
transport poverty without to pay for travel, or miss out on services or opportunities by not being able to access them.
The ability to make the • The above issue of transport poverty is further compounded by those living the most chaotic lifestyles
most of the transport being unlikely to be aware of, and to be able to take advantage of, all the transport options that are
services that exist available.
• As new technologies and rules are introduced to promote clean and sustainable travel, there is a risk that
only the better off can afford to take advantage of the new opportunities, further exacerbating the
inequality gap in society.
The ability of people • Any journey is door to door. This requires people with mobility difficulties to have the confidence that they
with mobility will be able to make every stage of their journey.
difficulties to use our
transport networks
The above assumptions are based on are pre-covid data. We assume that the consequences of the covid-19 pandemic is that inequalities have
been increased, increasing the problems felt by our most at risk groups and communities, and perhaps pushing more people into poverty.
Table5 below, helps identify where and for who our priorities for reducing inequalities may lie in the region.
01/06/2021 16:27 p24/50
P:\4. Administration\5. Website\RTS\2021 06 01 MIR v3.0.docxTable 5: where are our priorities for reducing inequalities?
Angus Dundee Perth and Kinross Stirling
Our most disadvantaged Pts Arbroath Pts Whitfield / Fintry / 10% Pts Muirton / Tulloch / Pt Cornton / Raploch
communities (Centre/Harbour) Douglas / Linlathen & Rattray
(SIMD worst 5%) Midcraigie / Kirkton /
Ardler & St Mary’s / The
Glens / Hilltown / Fairmuir
/ Lochee / Menzieshill /
City Centre
37% of the City’s datazones
in lowest 20%. Twice the
national average.
Economically inactive 12.3% 17% 11.5% 13%
people 16 to 74 who are
long-term sick or disabled
At risk groups (Tactran Include….young single parents / people with mobility difficulties / reliant on seasonal employment / cultural or religious
EqIA) barriers / gender inequalities / elderly
Access to services & 20% of datazones are within 21% of datazones are 17% of datazones are within
education the bottom 10% of within the bottom 10% of the bottom 10% of
(TRACC accessibility datazones for geographic datazones for geographic datazones for geographic
modelling / SIMD) access (SIMD) access (SIMD) access (SIMD)
16-25yrs No PT access to 11.8% 1.6% 15.1% 10.4%
further education
65+ yrs No car households 30- 16.9% 11.3% 41.8% 12.0%
60mins to retail centre
01/06/2021 16:27 p25/50
P:\4. Administration\5. Website\RTS\2021 06 01 MIR v3.0.docxTable 5: where are our priorities for reducing inequalities?
Angus Dundee Perth and Kinross Stirling
Transport poverty
Average cost of full rail fare 2nd highest in Scotland 3rd highest in Scotland
In both cities and larger towns, transport expenditure is generally comparable to the Outside Stirling City, much of
% weekly income spent on Scottish average, with the majority of urban areas ranging between 9% and 16% of area spends above national
transport household spending. In deeper rural areas of Perth & Kinross and Angus transport average (14.1% of income) on
expenditure is generally high, reaching 20% of household income transport
54% 11% 35% 35%
% datazones at high risk of
transport poverty10 Scotland average: high risk 36%
10
STPR2 Case for Change Reports: Factor of car availability/income/public transport access
01/06/2021 16:27 p26/50
P:\4. Administration\5. Website\RTS\2021 06 01 MIR v3.0.docx3.2 The priorities for taking climate action
The problems, here and now, for the region created by climate change are largely related to the resilience of our transport networks to
adverse weather events, which appear to be increasing in frequency. Longer term issues may relate to the impact of rising sea levels on our
coastal communities. The issue of the resilience of our networks to climate change is considered in section 5 ‘Strengths and weaknesses of the
transport network’.
The priorities for climate change arise from the global need to reduce climate emissions, and this section considers the key problems for
achieving this in the region. It is estimated that transport is responsible for 35.6%11 of carbon emissions in Scotland. The ‘transport’ problems
we face in taking climate action are summarised as:
• Our lifestyles, i.e. Where people live and need/chose to travel (in particular the mode share of car trips).
• The barriers and opportunities that people and businesses have for changing to more sustainable modes of travel
Table5 below, helps identify where and for who the priorities for taking climate action may need to focus in the region. Again, please
remember that the statistics are all pre-covid-19 data.
Table 6: Problems and priorities for taking climate action
Angus Dundee Perth and Kinross Stirling
Climate Change Strategy Climate Action Plan Climate Change Action Climate Change
and Action Plan LEZ Plan Sustainable Development
Strategy
The problem: Where Rural population with Most trips start and end in Rural population with limited public transport options / Perth
people live and limited public transport Dundee City, but are and Stirling cities have numerous rural villages/towns in
need/chose to travel sustainable transport hinterland
networks sufficiently
attractive to encourage
change? Hilly.
11
https://www.gov.scot/publications/securing-green-recovery-path-net-zero-update-climate-change-plan-20182032/
01/06/2021 16:27 p27/50
P:\4. Administration\5. Website\RTS\2021 06 01 MIR v3.0.docxTable 6: Problems and priorities for taking climate action
Angus Dundee Perth and Kinross Stirling
Climate Change Strategy Climate Action Plan Climate Change Action Climate Change
and Action Plan LEZ Plan Sustainable Development
Strategy
Continual reduction of services, and centralisation of services, increases the distances people have to travel
% of trips over 5km12 36% 19% 44% 33%
Mode Walk and cycle 23% 19% 18% 19%
share
Bus and train 5% 13% 9% 7%
travel to
work13 Car 71% 64% 71% 69%
Homeworking13 10% 11% 14% 14%
The barriers to change Section 5 highlights some of the strengths, opportunities, weaknesses and threats our transport networks present for enabling
For personal trips, more sustainable travel habits. The key challenge is the need for travel and the ability to provide alternatives, both
business and fleet, considerations which are exacerbated with large rural hinterlands. Problems include:
freight, rail • Existence of, awareness of and ability to use alternatives to the private car for private trips (active travel, public
transport)
• Take up and support networks for low emission technology, for both personal travel and emissions. Remember
almost all freight trips to & from the Highlands and Aberdeenshire pass through the region.
o Gap between current and target EV infrastructure14 (0.7% current registrations, target 60-70% coverage by
2032). Issues include: public sector fleets; availability of infrastructure at rural and tourist locations (including
remote tourist parking areas); tenements & flats / Cost of EVs and the risks of increasing inequalities
• Availability and cost of technology to reduce the need to travel
12 SHS Travel Diary 2019
13
Census 2011
14
Tactran Regional EV Strategy 2019
01/06/2021 16:27 p28/50
P:\4. Administration\5. Website\RTS\2021 06 01 MIR v3.0.docx3.3 The priorities for inclusive economic growth
The priorities for where and how transport supports inclusive economic growth relate to supporting:
• Existing employment sectors and locations, including tourism
• Growth sectors and locations: The respective Economic Strategies and the City Region Deals set out the priorities for economic growth
in the region
o Many of these existing and growth industries rely on good access to markets, and in the first instance, that means good access
to the rest of Scotland, including providing strong connections between Scotland’s Cities
• Access to employment and training: inclusive economic growth means designing growth so that everyone in society benefits. As far as
this relates to transport, this means maximising access to opportunities for all
Table 7 below, helps identify what industries, where and for who our priorities for supporting inclusive economic growth may lie in the region.
Table 7: Priorities for promoting inclusive economic growth
Angus Dundee Perth and Kinross Stirling
Principal employment Arbroath, Brechin, Forfar, Universities / Ninewells / Inveralmond / Broxden & Springkerse / Castle Business
locations Montrose business and industrial parks Cherrybank/ Friarton / City Park, Kildean & Prudential /
off Kingsway / City Centre Centre City Centre / Stirling
University Innovation Park
Where are the tourism • Angus Glens Waterfront (V&A) / City • A9/A93/Blairgowrie- • LLTNP (Callander A84;
pressures? • Carnoustie Centre Dunkeld – Aberfeldy - East Loch Lomond; Killin)
Tay Tourism Strategy Kenmore-Aberfeldy- • Stirling Castle
Pitlochry; Blair Atholl • Blairdrummond Safari
(+House of Bruar) Park
• Crieff;
• City Hall (Stone of
Destiny); Scone Palace
and racecourse;
• Gleneagles
01/06/2021 16:27 p29/50
P:\4. Administration\5. Website\RTS\2021 06 01 MIR v3.0.docxTable 7: Priorities for promoting inclusive economic growth
Angus Dundee Perth and Kinross Stirling
Growth sectors and • Tourism & Culture • Innovation
locations • Food & Drink • Digital
• Engineering & Manufacturing • Developing culture,
Tay Cities City Region • Energy (including Renewables, Offshore Wind, Oil & Gas heritage and tourism
Deal Decommissioning); assets
Tay Cities Region • Digital & Creative Industries • Transport, connectivity and
Economic Strategy 2019- • Biomedical, Life Sciences and MedTech low carbon
2039 • Construction • Infrastructure
Stirling and • Skills and inclusion
Clackmannanshire City
North Angus (Montrose) Michelin Scotland North & West Perth • University: Scotland’s
Region Deal
Innovation Park / James Hutton Institute National Environment
Waterfront (inc V&A) Centre & The National
Aquaculture Technology
and Innovation Hub
• Developing Culture,
Heritage & Tourism Assets:
National Tartan Centre
• Infrastructure (MoD
Forthside)
Connecting Glasgow Road (Forfar) 125mins Road 103mins Road 74mins Road 39 mins
Scotland’s Rail (Montrose) 115mins Rail 80mins Rail 56mins Rail 27 mins
cities
Edinburgh Road (Forfar) 107mins Road 87mins Road 64 mins Road 62 mins
Journey
Rail (Montrose) 105mins Rail 71mins Rail 71 mins Rail 41 mins
times
(fastest rail Rail fares ramp up north of Stirling. This means not only are The rail trip to Edinburgh
journey fares to Edinburgh/Glasgow from Perth/Dundee are takes longer than making
shown) proportionally high, but also fares between Stirling and the trip by road
Dundee are twice as high as the fare from Stirling to
01/06/2021 16:27 p30/50
P:\4. Administration\5. Website\RTS\2021 06 01 MIR v3.0.docxTable 7: Priorities for promoting inclusive economic growth
Angus Dundee Perth and Kinross Stirling
Edinburgh although the journey takes a similar time. This
encourages trips to Glasgow and Edinburgh at the expense
of other cities
Ensuring access to jobs Public transport availability to make shifts / cost of travel / ability to interchange / changing work patterns (increasing levels of
and training part-time work)
Pop without car unable to
access 3 emp sites by PT 43.4% 3.9% 33.2% 16.6%
within 60mins15
16-24 year olds no access to
11.8% 1.6% 15.1% 10.4%
Further Education by PT16
15
TRACC Accessibility Modelling 2018
01/06/2021 16:27 p31/50
P:\4. Administration\5. Website\RTS\2021 06 01 MIR v3.0.docx3.4 The priorities for health and wellbeing
Health and wellbeing is crucial to our quality of life. Conversely, poor health is a burden on the public purse. The health and wellbeing aspects
of transport relate to:
• Road safety
• Air and noise pollution
• The amount we walk and cycling as part of active daily routines (see table 3.2)
• Ability to access health services
The adverse impacts of these aspects will be felt, respectively by:
• Vulnerable road users, such as pedestrians and cyclists
• Those living near busy roads or major transport generators such as rail lines and airports
• Those communities with poor health
• Those that need to access health facilities the most, and non-car owning households that are not well served by alternatives such as
public transport
Table 8 below, helps identify where and for who transport creates problems for health and wellbeing in the region.
Table 8: Priorities for health and wellbeing / transport implications
Angus Dundee Perth and Kinross Stirling
Road safety problems A90 / A92 A90/A92/A972 A9 Perth to Inverness / A9 A9 Kier / A811 / A84
Growing % of elderly Auchterarder / A93
involved, increasing severity.
Air quality problems LEZ Perth City AQMA
Crieff AQMA
Noise problems The Scottish Government’s ‘Scotland’s Noise’ website estimates the amount of traffic noise that localities experience.
01/06/2021 16:27 p32/50
P:\4. Administration\5. Website\RTS\2021 06 01 MIR v3.0.docxTable 8: Priorities for health and wellbeing / transport implications
Angus Dundee Perth and Kinross Stirling
Where are the areas of 33% of the population lives
poor health? in a SIMD area ranked in the
bottom 20% for health
Access to healthcare Ability to access healthcare for those without access to a car, particularly those in a rural location
Households without a car
(More than 60mins to 80.5% 0% 13.3% 19.2%
hospital)
65+ yr olds (no public
transport to primary 7.9% 0.5% 11.2% 10.1%
health care)
01/06/2021 16:27 p33/50
P:\4. Administration\5. Website\RTS\2021 06 01 MIR v3.0.docx4. Significant new travel demands in the area
This section considers those major new developments that will increase the demand for travel in the region.
Q3. New travel demands: Most new trips are generated by new developments. Are there other significant generators
of new trips in or through the region?
Travel habits are changing at an unprecedented rate. Section 6 will consider the broader set of uncertainties in travel demand and supply that
the RTS may need to consider.
Nonetheless, the greatest new pressures on our transport networks are likely to still come from new housing and economic developments as
promoted in the development plans, economic strategies and the city region deals in our region. In addition, growth promoted beyond the
region, for example in Aberdeen/shire and the Highlands will also increase the travel demands in the region.
Table 9 below, helps identify where new development may will create increased travel demands in the region. The economic growth sectors
are covered in Section 3.
Table 9: Locations of major developments
Angus Dundee Perth and Kinross Stirling
Indicative North Angus Growth Dundee Waterfront / Michelin Perth Eco Innovation Park @ Innovative Connected
Regional Opportunity Scotland Innovation Park / PerthWest / Oudenarde Economic Centres (e.g. Town
Spatial Dundee Port / Dundee James Hutton Institute centres / Stirling Uni)
Strategies Western Gateway / Linlathen Innovation Hub Forth Valley Tourism (National
Employment Site Tartan Centre)
01/06/2021 16:27 p34/50
P:\4. Administration\5. Website\RTS\2021 06 01 MIR v3.0.docxTable 9: Locations of major developments
Angus Dundee Perth and Kinross Stirling
Local 2016-2026: 2019-2029 2018-2029 2015-2037
Development Arbroath 884 (36%) Dundee 2855 (4%) Blairgowrie 1677 (41%) Stirling City Area
Plans16 Forfar 978 (15%) Bridge of Earn 1797 (156%) • Durieshill 2500 and South
New Housing Montrose 702 (12%) Crieff 920 (28%) Stirling Gateway 800 (new)
(% increase in Luncarty 760 (110%) • Stirling City 2088 (14%)
settlement) Perth 8581+ (40%) • Eastern Villages (Cowie,
Scone 823 (37%) Fallin, Plean, Throsk) 1718
(56%)
= 24% increase across City area
by 2037
Business Arbroath: Elliot Ind Estate Dundee Waterfront / Western Invergowrie: James Hutton Durieshill
(21ha) Gateway 50ha / Linlathan 40ha Institute Kildean
Montrose: Montrose Port; / MSIP Western Perth: Bertha Park Forthside
Montrose Airport (50ha); Principal Economic (25ha); Almond Valley; Perth Callander: Claish Farm
Development Areas: Goudie / West (25ha) (190homes + 48ha tourism)
Dryborough / Dunsinane / Ruthvenfield Rd (23.6ha)
West Pitkerro / Claypotts /
Port of Dundee Bridge of Earn: Oudenarde
Specialist Economic 35ha
Development Areas: Seabraes
/ MediPark / Technopole /
Technology Park
16
Angus LDP 2016-2026 Dundee LDP 2019-2029 PKC LDP 2019-2029 Stirling LDP 2018-2037 LLTNPA LDP 2017-2021 TAYPlan
01/06/2021 16:27 p35/50
P:\4. Administration\5. Website\RTS\2021 06 01 MIR v3.0.docx5. Problems and opportunities with our existing transport network
This section considers the key problems and opportunities in our existing transport systems which affect our ability to
reduce inequalities, take climate action, help deliver inclusive economic growth and improve health and wellbeing.
Q4. Problems and opportunities with our existing transport networks: Have we captured the key problems and
opportunities in our existing transport networks which either hinder or help us support the social, environmental and
economic priorities?
Our transport networks and systems will help or hinder us
Reduce inequalities by Deliver inclusive economic growth by
• Enabling access to local facilities • Providing reliable journey times
• Being inclusive, enabling everyone, including those with mobility • Enabling access to jobs and training
difficulties, to be able to access and use them • Connecting the region to the rest of Scotland, and ensuring good
connectivity between Scotland’s cities
• Supporting tourism
Take climate action by Improve health and wellbeing by
• Being resilient to adverse weather • Being safe
• Enabling sustainable travel • Minimising air and noise pollution
• Enabling access to healthcare facilities
• Enabling walking and cycling as part of an active lifestyle
01/06/2021 16:27 p36/50
P:\4. Administration\5. Website\RTS\2021 06 01 MIR v3.0.docxTable10 below summarises those strengths/opportunities and weaknesses/threats with our existing transport networks which could shape the
options we have to address the social, environmental and economic priorities
Table 10: Problems and opportunities of the transport network
Reduce inequalities Opportunities • Dundee: Good public transport network (day time), but decreasing….
• By enabling • Angus, Perth and Kinross and Stirling: Good demand responsive transport (DRT) network / Good community
access to local transport sector in some areas
facilities • MaaS platforms exist
• By being Problems
inclusive • Limited public transport, and other transport choices, in most of our rural areas
• Cost of travel of travel is an issue in both our deprived and rural communities. Issue is compounded by
awareness of travel options
• Most networks not inclusive for people with mobility difficulties
Take climate action Opportunities • Compact towns and cities present active travel opportunities
• By being • Many settlements with cycling distance of each other / NCN
resilient to • Dundee: Leading authority on EV
adverse weather • City Region Deal support for Broxden Low Carbon Hub
• By enabling • City Region Deal support for active travel
sustainable
Problems • Extent and quality of pedestrian and cycle environments (and poor perception)
travel
• EV infrastructure
• Snow: on higher level road routes inc Angus Glens / A9 / A93
• Coastal erosion: Carnoustie
• Wind: Tay road and rail bridge, Friarton Bridge
• Flooding: Angus: Angus Glens; Dundee: Broughty Ferry /localised flooding in City (Dychtie Burn); Perth City
/ Aberfeldy / Kinross / Comrie / Almondbank; Alloa Road, Stirling
• Flooding of rail lines: Dundee-Glasgow rail line at Cornton / West Highland Line (+landslips) / Larbert
Deliver inclusive Opportunities • Dundee/Angus: Connected on strategic networks road and rail networks (n/s)
economic growth • Perth and Kinross / Stirling: Well connected on strategic road and rail networks (n/s/e/w)
• Limited corridors in Cities present p&c opportunities
01/06/2021 16:27 p37/50
P:\4. Administration\5. Website\RTS\2021 06 01 MIR v3.0.docxTable 10: Problems and opportunities of the transport network
• By providing • Opportunity: City Region Deal support for North Angus
reliable journey • Ports: port of Montrose; Port of Dundee, Perth Harbour
times • Dundee Airport
• By Enabling
access to jobs Problems Angus: Poor links to Port of Montrose / North Angus
• By Connecting Dundee: Pinch points / unreliable journey times:
the cities / • A90 (Kingsway) Swallow Roundabout / Claypotts
region
• By Supporting • A92 (Arbroath Road)
tourism Perth & Kinross: Pinch points / unreliable journey times:
• A9 Broxden / Inveralmond
• Perth City Centre
• Perth to Edinburgh rail times/cost
Stirling: Pinch points / unreliable journey times:
• Strategic: Craigforth / Kier / A91
• City Centre (Craigs & Customs Rndbts)
• Sustainable transport links into National Park
• Poor connections to neighbouring regional centres outside Forth Valley
Health and Opportunities • Compact towns and cities present active travel opportunities
wellbeing • Many settlements within cycling distance of each other
• By being safe • Central Scotland Green network
• By not polluting • Principal hospitals being close to rail stations
• By enabling • Central Scotland Green network
access to health
• By enabling Problems • Dundee: Traffic creating air quality issues
active travel • Perceived and actual road safety problems
• Angus, Perth and Kinross and Stirling: Poor active travel connectivity between settlements
• Dundee, Perth and Stirling: City Centre pinch points creating congestion and air quality issues
01/06/2021 16:27 p38/50
P:\4. Administration\5. Website\RTS\2021 06 01 MIR v3.0.docx6. Future uncertainties and risks that may influence travel
This section considers the future uncertainties that we need to take into account in shaping the RTS
Q5. Future uncertainties in how, where and why we travel: Have we captured the most significant uncertainties in
how, where and why we will travel in the future?
The problem of uncertain futures
There are many uncertainties about the future which will shape why, where, how much and how we travel? Not least:
• Technology is rapidly evolving, changing what we can do and how we do it
• Worldwide events, like climate change, are challenging how we lead our lives
The Regional Transport Strategy considers how best to meet travel demands over a 20year period to align with the land use planning
processes. What are the uncertainties of travel demand and supply that we need to take into account when writing the strategy? Over time,
these uncertainties will evolve and change, and new ones emerge
How do we ensure that the RTS considers uncertain futures and is responsive?
• Regular reviews of programmes to ensure that the strategy remains relevant and responsive
• ‘Scenario mapping’ helps us highlight the likely impact of uncertainties to inform policies and programmes
Scenario Mapping: key steps
We will consider the future uncertainties in a three stage process, rather like a simple risk assessment
1. Future risks and opportunities that may influence travel demands
2. Consideration of the potential impact of the uncertainties
3. Consideration of the likelihood of the uncertainties
Taking this 3 stage process will enable us to consider
01/06/2021 16:27 p39/50
P:\4. Administration\5. Website\RTS\2021 06 01 MIR v3.0.docx• For Positive impacts, do we want to encourage the impact?
• For Negative impacts: Do we want to discourage impact? Or mitigate against?
Table 11: Future risks and opportunities that may influence travel demands
Political or global ‘drivers’…. events that trigger society to Technology…. technological advances which give us greater
change behaviour opportunities to how we may travel or live our lives
Climate change & adverse weather could affect Technology provides us with tools to help us achieve objectives:
- Network resilience • Electric / hydrogen vehicles (reduces emissions)
- Policy • Demand management tools (e.g. road pricing tech)
Economic booms and bust (inc those triggered by disruptions • Solutions such as MaaS
like pandemics) affect Technology affecting how we travel (what needs to be accommodated?)
- Trip generation in the region from house building and • Driverless cars (road capacity requirements increase then
general activity decrease)
- Trips through the region (e.g. to/from Aberdeen) • How deliveries are made
Brexit could affect Existing transport networks
• Economic activity (volume and type) • Future of buses
• Demographics (immigration and birth rates) • Cost of energy & travel (as we transfer from ‘carbon’ to ‘green’)
Attitudes…. the peoples response to any of the above! Policy…. Government policy responding to political or global triggers, or
the technologies that exist, to promote or manage change
Pandemics (covid-19) & terrorism can affect Transport policy
• willingness to use mass transit • Prioritisation of modes & where will funding be directed (e.g.
• willingness to travel / stay at home parking policy / road & congestion charging)
Public response to climate change can affect attitude to Land use policy
sustainable travel • Where will there be a demand for housing?
Car ownership and shared mobility can affect whether people • What will be the role of our town centres? (shops/offices etc)
automatically jump in a car Fiscal Policy
01/06/2021 16:27 p40/50
P:\4. Administration\5. Website\RTS\2021 06 01 MIR v3.0.docxYou can also read