Saldanha Bay Municipality 2017 - Western Cape Government
←
→
Page content transcription
If your browser does not render page correctly, please read the page content below
Saldanha Bay Municipality
2017
SALDANHA BAY: AT A GLANCE

1.   DEMOGRAPHICS                  1

2.   EDUCATION                     3

3.   HEALTH                        7

4.   POVERTY                      12

5.   BASIC SERVICE DELIVERY       15

6.   SAFETY AND SECURITY          19

7.   THE ECONOMY                  24

8.   INFRASTRUCTURE DEVELOPMENT   28

SOURCES                           34

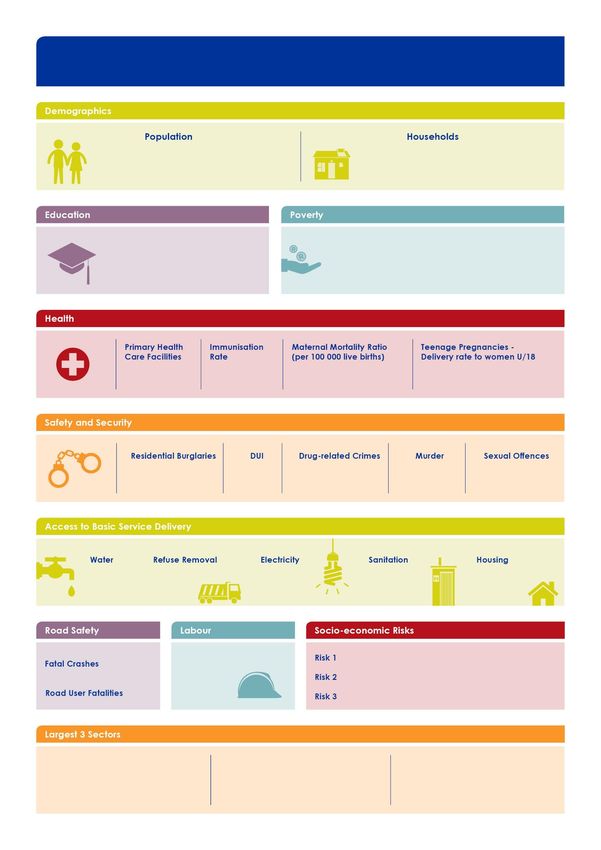
Saldanha Bay: At a Glance

                                                                   Population Estimates, 2018; Actual households, 2016

         113 239                                                                35 550
                                        2016                                                                        2016

        Matric Pass Rate           81.3%                     Gini Coefficient                                  0.59
        Learner-Teacher Ratio       48.4
                                                             Human Development Index                        0.73
        Gr 12 Drop-out Rate        29.5%

                                                                                                                    2016

                   8               77.8%                       0.1                            6.9%

                                    Percentage change between 2016 and 2017 in number of reported cases per 100 000

                     1.5%            -26.7%              21.7%                   6.1%                -17.2

                                                         Percentage of households with access to basic services, 2016

 99.5%               86.5%                      86.5%                   85.8%                    74.8%

              2016                              2016

                                                                 Drought
             14             Unemployment Rate
                                                                 Financial Sustainability (Grant dependency)

             20             17.0%                                Stagnating Economic Growth

                                                                                            Contribution to GDP, 2015

Agriculture, forestry and                 Wholesale and retail trade,             Finance, insurance, real estate
         fishing                         catering and accommodation                   and business services

  31.0%                                         17.8%                                    10.8%
Community Survey, 2016

                                             1
                            DEMOGRAPHICS

    This first chapter of the SEP focusses on the people living in Saldanha Bay itself. A demographic
    perspective on a municipality allows to observe not only simple changes in population growth,
    but also to look at other various developments that influence the social life of every citizen.
    Demographics allow to emphasise aspects of society like, e.g. gender, race, migration or life
    expectancy. Decisions made by politicians as well as by the administration affect in almost
    every case at least one aspect of Demographics. Therefore, a good understanding of this area
    is crucial for the government’s work.

    The overview of key demographic factors given in this chapter comprises of the estimates of
    population size, the distribution of population within age cohorts and furthermore the
    dependency ratio, which is of high importance for understanding economic activity in the
    area as well as for planning welfare systems. With this short, but informative overview, the SEP
    tries to help the municipalities in their budgeting process by delivering precise data as a solid
    foundation for future decisions.

1   2017 Socio-economic Profile: Saldanha Bay Municipality
POPULATION
     140 000
     120 000
     100 000
      80 000
      60 000
      40 000
      20 000
             0
                   Bergrivier       Cederberg          Matzikama      Saldanha Bay       Swartland
         2018       68 751            53 917               72 564       113 239           124 969
         2019       69 688            54 462               73 316       115 125           126 448
         2020       70 597            54 998               74 046       116 972           127 884
         2021       71 502            55 519               74 769       118 776           129 279
         2022       72 379            56 029               75 478       120 541           130 629
         2023       73 232            56 518               76 174       122 264           131 940

    As the chart above shows, the total population of Saldanha Bay is estimated to grow every
    year (albeit marginally) from 2018 until 2023. In the year 2018 this Municipality will have an
    estimated population of 113 239, after five years this population is estimated to be 122 264. This
    equates to an estimated growth rate of 8 per cent for the said period. The estimated
    population growth rate of Saldanha Bay is therefore 1.8 per cent higher than the estimated
    population growth of the West Coast which is 6.2 per cent.

    AGE COHORTS
                    Children:                  Working Age:             Aged:           Dependency
      Year
                   0 – 14 Years                15 – 65 Years             65 +              Ratio
      2011             25 090                     68 905                5 198               44.0

      2018             28 596                     77 137                7 505               46.8

      2023             29 598                     83 251                9 416               46.9

    Above table depicts the population composition regarding age cohorts. The total population
    is broken down into three different groups: Age 0 - 14: children; Age 15 - 65: working age
    population; Age 65+: seniors. The confrontation of the basis year of 2011 and the estimated
    numbers for 2023 show a growth in the percentage of seniors, a decline in the percentage of
    children despite a growth in total numbers, and a steady percentage in the working age
    population.

    This last fact is an important factor in the calculation of the dependency ratio. In Saldanha Bay,
    this ratio was 44.0 in 2011 and will only slightly increase to an estimated 46.9 in 2023. This ratio
    expresses the dependency of people who are part of the workforce (age 15 - 65) and those,
    who are depending on them (children and seniors). A higher dependency ratio means a
    higher pressure on social systems and the delivery of basic services.

2   2017 Socio-economic Profile: Saldanha Bay Municipality
2
                                   EDUCATION
    Education and training improves access to employment opportunities and helps to sustain and
    accelerate overall development. It expands the range of options available from which a
    person can choose to create opportunities for a fulfilling life. Through indirect positive effects
    on health and life expectancy, the level of education of a population also influences its
    welfare.

3   2017 Socio-economic Profile: Saldanha Bay Municipality
LEARNER ENROLMENT
      20 000
      18 000
      16 000
      14 000
      12 000
      10 000
       8 000
       6 000
       4 000
       2 000
          0
                  Bergrivier         Matzikama         Swartland       Saldanha Bay      Cederberg
         2014       7 981               9 913           16 613            15 530            7 464
         2015       8 126              10 004           16 933            16 300            7 546
         2016       8 212              10 247           17 356            16 886            7 647

    Learner enrolment in Saldanha Bay increased at an annual average growth rate of
    8.7 per cent between 2014 and 2016, which is an indication that access to education has
    improved within the Saldanha Bay municipal area.

    LEARNER-TEACHER RATIO
                               The learner–teacher ratio in Saldanha Bay increased notably from 30.7
                               in 2014 to 47.66 in 2015 and up to 48.38 in 2016, which could in future
                               affect learner performance within the Saldanha Bay municipal area.
                               Factors influencing the learner-teacher ratio is the ability of schools to
                               employ more educators when needed and the ability to collect fees.

    GRADE 12 DROP-OUT RATES
    A total of 29.5 per cent of students that enrolled in Grade 10 in 2014 dropped out of school by
    the time they reached Grade 12 in 2016. Although this number is alarmingly high, it is a slight
    improvement from the 2015 drop-out rate of 32.2 per cent. These high levels of drop-outs are
    influenced by a wide array of economic factors including unemployment, poverty, indigent
    households, high levels of households with no income or rely on less than R515 a month and
    teenage pregnancies.

4   2017 Socio-economic Profile: Saldanha Bay Municipality
EDUCATIONAL FACILITIES
    The availability of adequate education facilities such as schools, FET colleges and schools
    equipped with libraries and media centres could affect academic outcomes positively.

          25

          20

          15

          10

           5

           0
                     Number of Schools with Libraries                          Total Number of Schools
         2014                       9                                                    22
         2015                      10                                                    22
         2016                      10                                                    23

    Saldanha Bay had 23 schools in 2016. Given the tough economic climate, schools have been
    reporting an increase in parents being unable to pay their school fees. However, the
    proportion of no-fee schools deteriorated from 54.60 per cent in 2014 to 52.17 per cent in 2016,
    This could in future further increase the drop-out rate. The number of schools equipped with
    libraries remain unchanged at 10 for the period 2015 to 2016, this potentially could in future
    affect the matric pass rate within the Saldanha Bay municipal area.

     100,0%
      90,0%
      80,0%
      70,0%
      60,0%
      50,0%
      40,0%
      30,0%
      20,0%
      10,0%
       0,0%
                                                Proportion of no-fee schools
        2014                                               54,6%
        2015                                               54,6%
        2016                                               52,2%

    This chart displays the proportion of no-fee schools within Saldanha Bay municipal area. The
    proportion of no-fee schools within Saldanha Bay municipal area remained unchanged at
    54.6 per cent between 2014 and 2015. However, in 2016 the proportion declined to 52.2 per
    cent. This decline could result in the exclusion of vulnerable groups to access of education.

5   2017 Socio-economic Profile: Saldanha Bay Municipality
EDUCATION OUTCOMES
                              Education remains one of the key avenues through which the state
                              is involved in the economy. In preparing individuals for future
                              engagements in the broader market, policy decisions and choices in
                              the sphere of education play a critical role in determining the extent
                              to which future economy and poverty reduction plans can be
                              realised. This section measures the matric pass rate within the
                              Saldanha Bay municipal area.

     100,00%
      90,00%
      80,00%
      70,00%
      60,00%
      50,00%
      40,00%
      30,00%
      20,00%
      10,00%
       0,00%
                 Bergrivier       Matzikama         Swartland      Saldanha Bay      Cederberg
         2014     84,10%            93,70%           88,30%          87,90%           88,20%
         2015     91,90%            93,80%           86,50%          87,90%           89,00%
         2016     92,60%            91,10%           89,40%          81,30%           89,50%

    Saldanha Bay matric pass rate remained steady at 87.9 per cent between 2014 and 2015.
    However, the matric pass deteriorated slightly to 81.3 per cent in 2016, which could affect
    access for learners to higher education to broaden their economic opportunities/disposable
    incomes.

6   2017 Socio-economic Profile: Saldanha Bay Municipality
3
                                          HEALTH

    Health is another major factor contributing to the general quality of life in Saldanha Bay. It is
    therefore for the Municipality important to monitor the public health facilities as well as a
    variety of factors such as diseases like HIV or TB and general topics that affect the community,
    like maternal health. This Socio-economic Profile provides the basic statistics concerning those
    issues. Since this profile focusses on the public health facilities, private facilities do not appear
    in it.

7   2017 Socio-economic Profile: Saldanha Bay Municipality
HEALTHCARE FACILITIES
All citizens’ right to access to healthcare services are directly affected by the number and
spread of facilities within their geographical reach. South Africa’s healthcare system is geared
in such a way that people have to move from primary, with a referral system, to secondary
and tertiary levels.
16
14
12
10
8
6
4
2
0
Total
number of
Number of Number of
Number of PHC
Communit Communit ART Number of PHC Clinic - Number of Number of
TB clinics/ facilities
y Day y Health clinics/ district non-fixed PHC Clinics regional
treatment (Fixed
Centres Centre treatment hospitals (mobiles/s - Fixed hospitals
sites Clinics,
sites atelite)
CHCs and
CDCs)
2014 0 0 6 1 4 8 0 15 8
2015 0 0 6 1 3 8 0 11 8
2016 0 0 6 1 3 8 0 11 8
In total, Saldanha Bay had 8 public healthcare (PHC) facilities in 2016 of which all were fixed
PHC clinics. There were however also 3 non-fixed PHC clinics within the municipal area. In
addition, there are 6 ART and 11 TB treatment sites as well as one district hospital in Saldanha.
The area does however have no regional hospital as well as no community day centre or
community health centre.
EMERGENCY MEDICAL SERVICES
Access to emergency medical services is critical for rural citizens
due to rural distances between towns and health facilities being
much greater than in the urban areas. Combined with the
relatively lower population per square kilometre in rural areas,
ambulance coverage is greater in rural areas in order to
maintain adequate coverage for rural communities.
A bigger number of operational ambulances can provide a
greater coverage of emergency medical services.
Saldanha Bay with 0.4 ambulances per 10 000 inhabitants in
2016, is below the District figure of 0.9 ambulances per 10 000.
8 2017 Socio-economic Profile: Saldanha Bay MunicipalityHIV/AIDS
HIV/AIDS management is crucial given its implications for
the labour force and the demand for healthcare services.
Registered patients Number of new ART
HIV Transmission Rate
receiving ART patients
Area
2014 2015 2016 2014 2015 2016 2014 2015 2016
Saldanha Bay 2 054 2 449 2 958 446 577 558 0.5 1.0 0.0
West Coast District 6 521 7 651 8 910 1 484 1 790 1 835 1.4 1.5 0.8
Saldanha Bay is witnessing a steady rise in patients receiving antiretroviral treatment (ART) over
the past three years. Patients receiving antiretroviral treatment increased from 2 054 to 2 958
between 2014 and 2016. For the 2 958 patients receiving antiretroviral treatment in 2016, as
shown earlier in this chapter, are treated in 6 clinics or treatment sites. A total of 8 910 registered
patients received antiretroviral treatment in West Coast District in 2016.
The number of new antiretroviral patients in Saldanha Bay increased from 446 in 2014 to 558 in
2016.
HIV transmission rate for the Saldanha Bay Municipality shows an improvement from
0.5 per cent in 2014 to 0.0 per cent in 2016. This is lower than the West Coast District’s
transmission rate of 0.8 per cent in 2016.
TUBERCULOSIS
1 000
897
786
800 718
600 2014
2015
400
2016
200
0
Number of TB patients
In addition to the rising numbers of HIV/AIDS cases, Saldanha Bay experiences an increase in
tuberculosis (TB) cases. In 2016 the Municipality accounted for 897 cases of TB which is up from
the 718 cases reported in 2014.
9 2017 Socio-economic Profile: Saldanha Bay MunicipalityCHILD HEALTH
West Coast
Health Indicator Saldanha Bay
District
Immunisation 77.8% 81.8%
Malnutrition 1.3 1.8
Neonatal mortality rate 4.3 3.7
Low birth weight 7.7% 13.3%
Immunisation rate in Saldanha Bay municipal area has increased steadily from 71.6 per cent
in 2014 to 77.8 per cent in 2016. The Department of Health strongly advises mothers to protect
their children from infectious diseases by getting them vaccinated from birth to when they are
12 years old.
Saldanha Bay Municipality’s malnutrition rate decreased notably from 5.8 per cent in 2014 to
1.3 per cent in 2016.
Neonatal mortality rate (NMR) in Saldanha Bay municipal area has shown a decrease from
4.5 per 1 000 live births in 2014 to 2.9 deaths per 1 000 live births in 2015 and has recorded a
slide back to previous levels in 2016 of 4.3 deaths per 1 000 live births. A rise in the NMR may
indicate deterioration in new-born health outcomes, or it may indicate an improvement in the
reporting of neonatal deaths.
This indicator has registered an improvement between 2014 and 2016.
DEFINITIONS
Immunisation: The immunisation rate is calculated as the number of children immunised as
a percentage of the total number of children less than one year of age. Immunisation
protects both adults and children against preventable infectious diseases. Low immunisation
rates speak to the need for parents to understand the critical importance of immunisation,
as well as the need to encourage parents to have their young children immunised.
Malnutrition: Expressed as the number of malnourished children under five years per
100 000 people. Malnutrition (either under- or over-nutrition) refers to the condition whereby
an individual does not receive adequate amounts or receives excessive amounts of
nutrients.
Neonatal mortality rate: Measured as the number of neonates dying before reaching
28 days of age, per 1 000 live births in a given year. The first 28 days of life (neonatal period)
represent the most vulnerable time for a child’s survival. The Province’s target for 2019 is
6.0 per 1 000 live births.
Low birth weight: Percentage of all babies born in facility that weighed less than 2 500 g. Low
birth weight is associated with a range of both short- and long-term consequences.
10 2017 Socio-economic Profile: Saldanha Bay MunicipalityMATERNAL HEALTH
Saldanha West Coast
Health Indicator
Bay District
Maternal Mortality Ratio 0.1 0
Delivery Rate to Women
6.9% 8.7%
under 18 years
Termination of Pregnancy
1.0% 0.4%
Rate
Maternal mortality rate: A positive development can be observed in the of ratio for Saldanha
Bay which remains at 0.1 in 2016. This is unchanged from the 0.1 recorded in 2015.
Births to teenage mothers: A positive development can be observed in the delivery rate to
women under 18 years, which is declining from 2015 figure of 7.0 to its current level of 6.9 in
2016.
Termination of pregnancy: The termination of pregnancy rate reflects a slight increase from 0.3
in 2014 to 1.0 in 2016.
DEFINITIONS
Maternal health refers to the health of women during pregnancy, childbirth and the
postpartum period.
Maternal mortality rate: Maternal deaths per 100 000 live births in health facilities. Maternal
death is death occurring during pregnancy, childbirth and the puerperium of a woman
while pregnant or within 42 days of termination of pregnancy, irrespective of the duration
and site of pregnancy and irrespective of the cause of death (obstetric and non-obstetric).
Births to teenage mothers: Percentage of babies born to mothers under the age of 18 years.
Teenage pregnancy is almost always unplanned; as a result, when young parents are
placed in a position to care for their children, life can become particularly tough, especially
if they do not have family or social support.
Termination of pregnancy: The percentage of terminations as a proportion of the female
population aged 15 to 44 years. Government hospitals, designated private doctors and
gynaecologists, and non-profit providers offer safe and legal termination of pregnancy. To
have a free abortion, the request must be made at a primary healthcare clinic, where the
pregnancy will be confirmed, counselling provided, an appointment made, and a referral
letter be given to a facility where the procedure can be performed.
11 2017 Socio-economic Profile: Saldanha Bay Municipality4
POVERTY
The deteriorating financial health of households and individuals under the weight of economic
pressures, specifically between 2011 and 2015, has resulted in an increase in the poverty levels,
according to the Poverty Trends in South Africa report released by Statistics South Africa in
2017. The report cites rising unemployment levels, low commodity prices, higher consumer
prices, lower investment levels, household dependency on credit, and policy uncertainty as
the key contributors to the economic decline in recent times. These recent findings indicate
that the country will have to reduce poverty at a faster rate than previously planned.
According to the report the categories of people vulnerable to poverty remained to be
African females, children 17 years and younger, people from rural areas, and those with no
education. Inflation-adjusted poverty lines show that food poverty increased from R219 in 2006
to R531 per person per month in 2017. The lower-bound poverty line has increased from R370
in 2006 to R758 per person per month in 2017 while the upper-bound poverty line has increased
from R575 in 2006 to R1 138 per person per month in 2017.
12 2017 Socio-economic Profile: Saldanha Bay MunicipalityGDPR PER CAPITA
An increase in real GDPR per capita, i.e. GDPR per person, is experienced only if the real
economic growth rate exceeds the population growth rate. Below figures indicates that the
real GDPR per capita for Saldanha Bay is above the average real GDPR per capita rates for
the West Coast District but below the Western Cape GDPR trend-line for the assessed period.
70 000
60 000
50 000
GDPR per capita
40 000
30 000
20 000
10 000
0
2005 2006 2007 2008 2009 2010 2011 2012 2013 2014 2015 2016
Saldanha Bay 50 609 50 814 53 340 55 341 52 790 53 691 54 479 53 980 53 948 54 472 54 014 53 112
West Coast 42 249 42 104 44 279 47 945 46 395 46 713 47 469 47 690 47 959 49 067 47 889 46 623
Western Cape 54 363 56 550 59 251 60 656 58 845 59 197 60 423 61 095 61 648 61 935 61 794 61 199
Even though real GDP per capita reflects changes in the overall well-being of the population,
not everyone within an economy will earn the same amount of money as estimated by the
real GDPR per capita indicator.
INCOME INEQUALITY
The National Development Plan has set a target of reducing income inequality in South Africa
from a Gini coefficient of 0.7 in 2010 to 0.6 by 2030. Income inequality has increased between
2010 and 2016 with the exception of 2010 - 2012 and 2015, when it dropped below 0.56.
0,62
0,60
0,58
0,56
0,54
0,52
0,50
0,48
Matzikama Cederberg Bergrivier Saldanha Bay Swartland West Coast Western Cape
2010 2011 2012 2013 2014 2015 2016
Income inequality levels were considerably higher in Saldanha Bay than in the West Coast
District and the Western Cape despite the dominance of agriculture in the municipal area
which indicates inequality between the incomes of farmers and farm workers. Saldanha Bay’s
Gini coefficient was in 2016 calculated to be 0.59.
13 2017 Socio-economic Profile: Saldanha Bay MunicipalityHUMAN DEVELOPMENT
The United Nations uses the Human Development Index (HDI) 1 to assess the relative level of
socio-economic development in countries.
0,74
0,72
0,7
0,68
0,66
0,64
0,62
0,6
0,58
0,56
0,54
Matzikama Cederberg Bergrivier Saldanha Bay Swartland West Coast WC
2010 2011 2012 2013 2014 2015
The above graph shows that there has been a general increase in the HDI in Saldanha Bay,
West Coast District and the whole of the Western Cape between the period 2010 and 2015.
Indicators that measure human development are education, housing, access to basic services
and health. Saldanha Bay’s HDI was estimated to be 0.73 in 2015.
INDIGENT HOUSEHOLDS
The objective of the indigent policies of municipalities is to alleviate poverty in economically
disadvantaged communities and the Saldanha Bay municipal area experienced an increase
in the number of indigents between 2014 and 2016, implying reduced burdens on municipal
financial resources.
Area 2014 2015 2016
Saldanha Bay 1 921 2 679 2 926
West Coast District 20 655 22 454 23 471
Western Cape 404 413 505 585 516 321
Source: Department of Local Government, 2017
In contrast, the overall number of indigent households has increased in the West Coast District
as well as the Western Cape, indicating an increasing demand for indigent support from other
areas within the District and the Province. For Saldanha Bay, the trend is not too dissimilar with
a gradual increase witnessed from 1 921 indigents in 2014 to 2 926 indigents in 2016.
1 The HDI is a composite indicator reflecting education levels, health, and income. It is a measure of peoples' ability
to live a long and healthy life, to communicate, participate in the community and to have sufficient means to be
able to afford a decent living. The HDI is represented by a number between 0 and 1, where 1 indicates a high
level of human development and 0 represents no human development.
14 2017 Socio-economic Profile: Saldanha Bay Municipality5
BASIC SERVICE DELIVERY
The Constitution of the Republic of South Africa states that every citizen has the right to access
to adequate housing and that the state must take reasonable legislative and other measures
within its available resources to achieve the progressive realisation of this right. Access to
housing also includes access to services such as potable water, basic sanitation, safe energy
sources and refuse removal services, to ensure that households enjoy a decent standard of
living.
This section reflects on housing and basic services access levels (Census 2011) and the
incremental progress municipalities have made hereto within the last 5 years (Community
Survey 2016).
15 2017 Socio-economic Profile: Saldanha Bay MunicipalityHOUSEHOLDS
In order to ensure basic service delivery to all, municipal
budget allocations should be informed by credible and
accurate assumptions regarding the number of households
within a municipal area.
Access to formal housing and services in Saldanha Bay is
measured against a total number of households of 28 835 in
2011 and 35 550 in 2016.
Average Average
Area 2011 2016 annual annual growth
increase 2011 - 2016
Saldanha Bay 28 835 35 550 1 343 4.3%
West Coast District 106 781 129 862 4 616 4.0%
ACCESS TO HOUSING
SERVICE STANDARD DEFINITION: Households with access to a formal dwelling.
Average Average
Total
annual annual
Area 2011 2016 increase
increase growth
2011 - 2016
2011 - 2016 2011 - 2016
Saldanha Bay 81.7% 74.8% 3 028 606 2.4%
West Coast District 87.9% 85.8% 17 557 3 511 3.5%
The number of formal dwellings in Saldanha Bay witnessed an
average annual increase of 606 units between 2011 and 2016,
at an average annual rate of 2.4 per cent, which translates
into approximately 121 additional formal dwellings per year
over this period. This increase in formal dwellings has failed to
keep pace with the growth in the total number of households,
resulting in the proportion of formal households declining
constant from 81.7 per cent in 2011 to 74.8 per cent in 2016.
16 2017 Socio-economic Profile: Saldanha Bay MunicipalityACCESS TO WATER
Given the Western Cape’s current drought situation, great focus is currently placed on water
availability and supply. This goes hand in hand with due consideration for water quality. Access
to safe potable water is essential to prevent the contraction and spread of diseases and
maintaining a healthy life.
SERVICE STANDARD DEFINITION: Households with access to piped water inside the dwelling
or yard or within 200 metres from the yard.
Average Average
Total
annual annual
Area 2011 2016 increase
increase growth
2011 - 2016
2011 - 2016 2011 - 2016
Saldanha Bay 99.4% 99.5% 6 703 1 341 4.3%
West Coast District 99.0% 96.5% 19 626 3 925 3.5%
Although Saldanha Bay experienced an annual increase of household access to piped water
(to within 200 metres of the yard) of approximately 1 341 households per annum between 2011
and 2016, the proportion of households with access remain unchanged over this period from
99.4 per cent in 2011 to 99.5 per cent in 2016. This again indicating that access to piped water
was unable to keep pace with the growth in the total number of households.
ACCESS TO SANITATION
Sanitation promotes health through the provision of safe disposal and treatment of human
waste. Where sanitation systems are inadequate, negative health effects can be extremely
serious. Access to a flush toilet not only advances physical health but also provides the user
with a sense of human dignity. The current drought highlights challenges in the use of potable
water within the sanitation services process.
SERVICE STANDARD DEFINITION: Households with access to a flush or chemical toilet
connected to the sewerage system.
Average Average
Total
annual annual
Area 2011 2016 increase
increase growth
2011 - 2016
2011 - 2016 2011 - 2016
Saldanha Bay 96.3% 85.8% 2 730 546 1.9%
West Coast District 87.5% 92.5% 26 696 5 339 5.2%
With the proportion of households with access to acceptable standards of sanitation services
decreasing from 96.3 per cent in 2011 to 85.8 per cent in 2016, Saldanha Bay experienced
significant progress in household access to sanitation services over this period but was unable
to match the growth in formal dwellings and related service delivery. The Municipality was able
to provide an additional 546 households with access annually; access growing at an average
annual rate of 1.9 per cent.
17 2017 Socio-economic Profile: Saldanha Bay MunicipalityACCESS TO ELECTRICITY
Energy is essential for human life; generally identified household uses include energy for
cooking, heating and lighting. Energy sources also have usage risks; for example, health and
safety risks especially in the use of paraffin and open flame usage. The information below
relates to the use of electricity for lighting purposes.
SERVICE STANDARD DEFINITION: Households with access to electricity as the primary source
of lighting.
Average Average
Total
annual annual
Area 2011 2016 increase
increase growth
2011 - 2016
2011 - 2016 2011 - 2016
Saldanha Bay 97.0% 86.5% 2 777 555 1.9%
West Coast District 94.4% 94.1% 21 395 4 279 3.9%
The annual growth in household access to electricity of 555 fell short of the total household
growth of approximately 1 343 on average per annum. This coincides with a decrease in the
proportion of households with access to electricity, decreasing from 97.0 per cent in 2011 to
86.5 per cent in 2016.
ACCESS TO REFUSE REMOVAL
Refuse removal is an essential service that ensures that health related problems are kept at
bay. A lack of or inadequate service is likely to result in uncontrolled and unregulated
dumping. There are growing concerns around the land and environmental limitations in the
creation and lifespan of landfill sites. This would benefit greatly from the ‘reduce – reuse –
recycle’ approach, that firstly encourages non-wasteful consumption practices (reduce), the
reuse of products where possible (reuse) and the recycling of the product where its use in
current form has been exhausted (recycle).
SERVICE STANDARD DEFINITION: Households who have waste removed by local authorities at
least weekly.
Average Average
Total
annual annual
Area 2011 2016 increase
increase growth
2011 - 2016
2011 - 2016 2011 - 2016
Saldanha Bay 96.6% 86.5% 2 886 577 2.0%
West Coast District 76.5% 83.4% 26 625 5 325 5.8%
Household access to refuse removal services in Saldanha Bay has decreased from
96.6 per cent in 2011 to 86.5 per cent in 2016; household access to this service increasing at a
slower rate (additional 1 343 households annually) than the growth in formal households
(577 annually), but significantly faster than total household growth (268 per annum on average
over the period).
18 2017 Socio-economic Profile: Saldanha Bay Municipality6
SAFETY AND SECURITY
The Constitution upholds the notion that everybody has the right to freedom and security of
the person. The safety of persons and property is therefore vitally important to the physical and
emotional well-being of people and business. Without the respect of person and property, it
would be impossible for people to live peacefully, without fear of attack and for businesses to
flourish.
The extent of crime in South Africa does however not only have a significant impact on the
livelihood of citizens, but also affects the general economy. Crime hampers growth and
discourages investment and capital accumulation. If not addressed with seriousness, it has the
potential to derail both social and economic prosperity.
People’s general impressions, as well as official statistics on safety and crime issues, mould
perceptions of areas as living spaces or places in which to establish businesses. The discussion
in this section that follows is limited to the reported contact and property-related crime such
as murder and sexual crimes, as well as crime heavily dependent on police action for
detecting drug-related crimes and driving under the influence of alcohol/drugs.
Note: Percentage change calculation will differ from the actuals reflected due to rounding
down to per 100 000 population.
Data source: The data depicted in the following section was sourced from the 2017 Crime
Statistics released by the South African Police Service (SAPS) in October 2017. Incidences of
crime per 100 000 were calculated using actual crime and estimated population figures
provided by SAPS. Also note that although the crime data contained in the following section
is for ease of reference depicted as a single calendar year, it is in actual fact referring to
criminal activity within a financial year i.e. incidences of murder for 2016 is referring to
occurrences within the period April 2016 to March 2017.
The information relating to fatal crashes and crash fatalities were sourced from the
Department of Transport and Public Works.
19 2017 Socio-economic Profile: Saldanha Bay MunicipalityMURDER
Area 2016 2017 % Change
Saldanha Bay
26 27 6.1
(per 100 000)
West Coast District
33 27 -18.3
(per 100 000)
Definition: Murder is a social contact crime resulting in the loss of life of the victim, but excludes
cases where the loss of life occurred as a result of a response to a crime, for example
self-defence.
Crime remains a prominent issue in South Africa at a high socio-economic cost. Overall, the
country has a very high rate of murder when compared to most countries.
Within the Saldanha Bay area, the murder rate showed an increase of 6.1 per cent from 26 in
2016 to 27 in 2017 (per 100 000 population), whereas the murder rate within the West Coast
District declined by 18.3 per cent from 33 in 2016 to 27 in 2017. The murder rate nevertheless
remains a grave concern throughout the West Coast District; however, the significantly lower
murder rate for 2016/17 is a welcome relief.
SEXUAL OFFENCES
Area 2016 2017 % Change
Saldanha Bay
93 77 -17.2
(per 100 000)
West Coast District
136 131 -3.6
(per 100 000)
Definition: Sexual offences includes rape (updated to the new definition of rape to provide for
the inclusion of male rape), sex work, pornography, public indecency and human trafficking.
The rate of sexual violence in South Africa is amongst the highest in the world. In addition, a
number of sexual offence incidences often go unreported (as in the case of rape).
The cases of sexual offences in the Saldanha Bay area decreased by 17.2 per cent from 93 in
2016 to 77 in 2017 (per 100 000 population), whereas, the cases of sexual offences in the West
Coast District area overall declined by 3.6 per cent from 136 in 2016 to 131 in 2017 (per
100 000 population).
20 2017 Socio-economic Profile: Saldanha Bay MunicipalityDRUG-RELATED CRIMES
Area 2016 2017 % Change
Saldanha Bay
815 992 21.7
(per 100 000)
West Coast District
1 348 1 686 25.1
(per 100 000)
Definition: Drug-related crimes refers to the situation where the perpetrator is found to be in
possession of, under the influence of, or selling illegal drugs. This is a crime detected through
police activity rather than reports by members of the public. An increase in crimes of this nature
may therefore reflect an increase in police.
Drug-related crimes have a negative impact on human development by degrading the
quality of life as it infiltrates all aspects of society including families, health, the work
environment and the economy. Drug-related crimes within the Saldanha Bay area shows a
sharp increase in 2017, up by 21.7 per cent from 815 cases in 2016 to 992 cases in 2017 (per
100 000 population). The West Coast District’s trend is also on an increasing trajectory, with
drug-related crimes increasing by 25.1 per cent from 1 348 in 2016 to 1 686 in 2017 (per
100 000 population).
DRIVING UNDER THE INFLUENCE
Area 2016 2017 % Change
Saldanha Bay
117 86 -26.7
(per 100 000)
West Coast District
115 123 7.2
(per 100 000)
Definition: DUI refers to a situation where the driver of a vehicle is found to be over the legal
blood alcohol limit. This is a crime detected through police activity rather than reports by
members of the public.
Despite concerted efforts by government our roads are still considered amongst the most
dangerous in the world. Reckless driving and alcohol consumption remain the top reason for
road accidents.
The number of cases of driving under the influence of alcohol or drugs in the Saldanha Bay
area show a decrease of 26.7 per cent from 117 in 2017 to 86 in 2017 (per 100 000 population).
In the West Coast District area, the number of cases increased albeit at a lower rate of
7.2 per cent from 115 in 2016 to 123 in 2017 (per 100 000 population).
21 2017 Socio-economic Profile: Saldanha Bay MunicipalityRESIDENTIAL BURGLARIES
Area 2016 2017 % Change
Saldanha Bay
1 173 1 191 1.5
(per 100 000)
West Coast District
736 722 -1.9
(per 100 000)
Definition: Residential burglary is defined as the unlawful entry of a residential structure with the
intent to commit a crime, usually a theft.
Given its regular occurrence and the psychological impact on victims, residential burglaries
are an obstinate concern in South Africa. Residential burglary cases within the Saldanha Bay
area increased marginally by 1.5 per cent from 117 in 2016 to 119 in 2017 (per
100 000 population). Similarly, residential burglaries within the West Coast District shows a
decline of 1.9 per cent from 736 in 2016 to 722 in 2017 (per 100 000 population). The number of
cases of residential burglaries crimes remain a serious concern throughout the West Coast
District area, especially within Saldanha Bay as it experienced a significantly higher rate of
residential burglaries than the District.
FATAL CRASHES
Area 2015 2016 % Change
Saldanha Bay 27 14 -48.2
West Coast District 112 73 -34.8
Definition: A crash occurrence that caused immediate death to a road user, i.e. death upon
impact, flung from the wreckage, burnt to death, etc.
Above graphic indicates that in 2015 there were a total of 27 fatal crashes involving motor
vehicles, motorcycles, cyclists and pedestrians within the jurisdiction of the Saldanha Bay
Municipality. This number decreased by 48.2 per cent to 14 in 2017. The number of fatal crashes
in the broader West Coast District decreased by 34.8 per cent from 112 crashes in 2015 to 73 in
2016.
22 2017 Socio-economic Profile: Saldanha Bay MunicipalityROAD USER FATALITIES
Area 2015 2016 % Change
Saldanha Bay 31 20 -35.5
West Coast District 135 92 -31.9
Definition: The type of road user that died in or during a crash, i.e. driver, cyclist, passengers,
pedestrians.
According to a recent study, the majority of road fatalities in Africa fall within the working age
cohort - between the ages of 15 - 44 years – whilst three out of four fatalities were found to be
male (Peden et al., 2013). The untimely death of these primary breadwinners therefore impacts
directly upon not only the livelihood of family structures, but deprive society of active
economic participants that contribute towards growth and development. The
socio-economic impact of such road fatalities has proven to be particularly devastating in
South Africa where the majority of road users hail from poor and vulnerable communities.
The previous section specified that 14 fatal crashes occurred within the Saldanha Bay region
in 2016. The above table indicates that a total of 20 road users died in these specific crashes.
This is a notable decline on the 31 fatalities recorded in 2015 which equates to a welcomed -
35.5 per cent decrease in road user fatalities.
Additional, lower-level information regarding the time, location, gender, ages of above
specified crashes is available from the Department of Transport and Public Works upon request.
23 2017 Socio-economic Profile: Saldanha Bay Municipality7
THE ECONOMY
Economic activity within municipal boundaries is important as it shows the extent of human
development and living standards of communities. Although municipalities have no power to
increase or decrease taxes in order to stimulate economic activity, there are few levers that
local government authorities have control over to contribute to economic performance,
including, among others, procurement of goods and services, job creation through expanded
public works programmes as well as creating an enabling environment for small businesses.
The ability of households to pay for services such as water, electricity, sanitation, and refuse
removal depends on income generated from economic activities. A slowdown in economic
activity may result in job losses and inability of households to pay for services leading to
reduced municipal revenues. Data on macroeconomic performance, especially the
information on sectoral growth and employment, is useful for municipalities’ revenue and
expenditure projections.
24 2017 Socio-economic Profile: Saldanha Bay MunicipalityECONOMIC SECTOR PERFORMANCE
The Saldanha Bay municipal area is the largest economy within the WCD, with economic
activities focussing on manufacturing as well as tertiary sector activities. Over the last five years,
the Saldanha Bay economy has grown at an average annual rate of 2.2 per cent. This
municipal area managed to achieve a positive growth rate in 2016, while the District GDPR
contracted with 0.6 per cent. The table below indicates the Saldanha Bay municipal area’s
GDPR performance per sector.
Saldanha Bay GDPR performance per sector, 2005 - 2016
Contribution R million Trend Real GDPR growth (%)
to GDPR (%) value
Sector 2015 2015 2005 - 2015 2010 - 2015 2011 2012 2013 2014 2015 2016e
Primary Sector 15.4 1 185.1 2.3 3.7 6.3 2.0 5.2 5.1 0.0 -2.7
Agriculture, forestry and 14.9 1 149.2 2.5 3.8 6.6 2.1 5.4 5.1 0.0 -2.5
fishing
Mining and quarrying 0.5 35.9 -2.2 0.5 0.4 -1.1 0.7 4.4 -1.6 -8.5
Secondary Sector 29.1 2 239.9 1.0 -0.1 0.4 -1.0 0.3 0.3 -0.6 -1.1
Manufacturing 22.7 1 747.7 0.6 -0.4 1.0 -1.6 -0.3 -0.4 -0.7 -1.4
Electricity, gas and 1.2 94.5 -0.3 -0.3 2.5 -0.3 -1.4 -1.3 -1.1 -6.5
water
Construction 5.2 397.7 4.8 1.8 -3.6 2.4 4.8 5.1 0.2 1.7
Tertiary Sector 55.5 4 273.5 3.3 3.1 4.2 3.5 3.2 2.6 1.9 1.5
Wholesale and retail 14.9 1 143.9 3.6 3.5 5.0 4.7 3.2 2.5 2.4 2.1
trade, catering and
accommodation
Transport, storage and 9.2 711.7 -0.3 -0.2 1.1 -0.2 0.1 0.8 -2.8 -3.1
communication
Finance, insurance, real 15.0 1 155.4 4.8 3.9 4.2 4.1 3.6 3.4 4.2 3.0
estate and business
services
General government 10.2 783.2 3.6 3.5 5.8 3.3 4.6 3.1 0.9 1.5
Community, social and 6.2 479.3 3.5 3.2 4.0 4.5 3.8 2.0 1.8 1.6
personal services
Total Saldanha Bay 100 7 698.5 2.4 2.2 3.4 1.9 2.7 2.3 0.9 0.1
Source: Quantec Research, 2017 (e denotes estimate)
The economy of the Saldanha Bay area is driven by the manufacturing sector which
contributed R1.7 billion (22.7 per cent) to the economy of the area in 2015. Other leading
sectors include the finance, insurance, real estate and business services sector (15.0 per cent),
the wholesale and retail trade, catering and accommodation sector (14.9 per cent) and the
agriculture, forestry and fishing sector (14.9 per cent). Compared to other municipal areas in
the District, the Saldanha Bay municipal area has less agricultural land available for crop
farming, meaning that fishing is the primary activity of the agriculture, forestry and fishing
sector.
Over the last five years, the agriculture, forestry and fishing sector as well as the majority tertiary
sectors have achieved above average growth. The manufacturing sector has however
contracted since 2012, at an average annual rate of 0.4 per cent over the last five years. The
manufacturing sector within this local municipal area depends heavily on inputs from the
agriculture and fishing sector as well as from iron ore that is imported for the manufacturing of
steel. Global and national factors impacting iron ore production, prices and the increase of
25 2017 Socio-economic Profile: Saldanha Bay Municipalitycheaper imports of steel from China will, therefore, affect the economy of the Saldanha Bay
area. The current drought is also impacting the local manufacturing sector as approximately
60.0 per cent water use in the Saldanha Bay area is for industrial purposes 2.
The transport, storage and communication sector also contracted in 2015 and 2016. This sector
is also heavily reliant on the steel manufacturing industry as well as iron ore mining in the
Northern Cape since one of the main activities of the Saldanha Bay harbour is the export of
iron ore, meaning that factors that have an impact on the mining industry such as changes in
legislation, labour unrest and global demand factors can have an indirect effect on this local
sector.
Even though the construction sector is relatively small in comparison with other local sectors, it
grew at above average rates in 2013 and 2014 in the Saldanha Bay area, indicating new
investment in the area during that time, especially in the construction of residential units.
Saldanha Bay employment growth per sector, 2005 - 2016
Contribution to
employment Number Trend Employment (net change)
(%) of jobs
Sector 2015 2015 2005 - 2015 2010 - 2015 2011 2012 2013 2014 2015 2016e
Primary Sector 31.1 14 429 -869 3 347 -28 1 433 1 295 -407 1 054 -99
Agriculture, forestry 31.0 14 379 -838 3 366 -28 1433 1315 -407 1 053 -97
and fishing
Mining and 0.1 50 -31 -19 0 0 -20 0 1 -2
quarrying
Secondary Sector 16.0 7 444 -668 117 -65 -107 212 -11 88 78
Manufacturing 10.8 5 032 -876 -180 -124 -172 172 -114 58 -1
Electricity, gas and 0.1 63 21 8 3 2 2 0 1 3
water
Construction 5.1 2 349 187 289 56 63 38 103 29 76
Tertiary Sector 52.8 24 512 6 994 3 643 662 652 855 757 717 379
Wholesale and retail 17.8 8 277 2 382 1273 257 277 230 228 281 151
trade, catering and
accommodation
Transport, storage 3.6 1 690 339 125 -8 48 52 -56 89 -95
and communication
Finance, insurance, 10.8 5 028 1 324 658 141 91 145 75 206 108
real estate and
business services
General 10.4 4 820 1 435 620 216 103 97 300 -96 108
government
Community, social 10.1 4 697 1 514 967 56 133 331 210 237 107
and personal
services
Total Saldanha Bay 100 46 385 5 457 7 107 569 1 978 2 362 339 1 859 358
Source: Quantec Research, 2017 (e denotes estimate)
2 Saldanha Bay Municipality MERO 2017 Survey response
26 2017 Socio-economic Profile: Saldanha Bay MunicipalityEven though the manufacturing sector (22.7 per cent) contributes the most towards the local
economy’s GDPR, it only contributes 10.8 per cent to employment - indicating a high level of
mechanisation within the manufacturing sector. Over the last 10 years, more than 800 jobs
were lost in the manufacturing sector, which is a result of the contracting sector in terms of
GDPR.
The agriculture, forestry and fishing sector and the wholesale and retail trade, catering and
accommodation sector collectively contribute 48.8 per cent to employment. Employment in
the agriculture, forestry and fishing sector is volatile. However, over the last five years, this sector
has employed an additional 3 366 people. The wholesale and retail trade, catering and
accommodation sector had a net increase of 1 273 jobs over the last five years.
In 2016 the following sectors all shed jobs: the agriculture, forestry and fishing (97); transport,
storage and communication (95); mining and quarrying (2); and the manufacturing sector (1),
while employment growth in other sectors was generally slow when compared to employment
in other years.
Skills level
Education levels in any given market area will influence economic and human development.
Better employment opportunities and overall development are sustained and accelerated by
education and training. Further benefits of higher skills levels include positive effects on health
and life expectancy as well as the welfare of the population. A skilled population does not
necessarily aspire to employment but to entrepreneurship, which will add businesses to the
area, increase economic activity and consequently increase the number of jobs available.
Saldanha Bay skills level, 2015
Skill level contribution (%) Average growth (%) Number of jobs
Formal employment by skill 2015 2005 - 2015 2015
Skilled 17.3 1.8 6 335
Semi-skilled 41.7 -0.6 15 217
Low-skilled 41.0 0.6 14 969
Total Saldanha Bay 100 0.3 36 521
Source: Quantec Research, 2017
The majority of the formally employed workers in Saldanha Bay are semi-skilled (41.7 per cent)
or low-skilled (41.0 per cent). In Saldanha Bay there were 36 521 formally employed individuals,
indicating that 9 864 individuals were informally employed in 2015. Skilled and low-skilled formal
employees have increased marginally between 2005 and 2015, while the number of
semi-skilled formal employees have been contracting between 2005 and 2015 - which is in line
with the decline in manufacturing sector workers.
27 2017 Socio-economic Profile: Saldanha Bay Municipality8
INFRASTRUCTURE DEVELOPMENT
As Economic theory and empirical work suggest that public investment in infrastructure will
boost economic growth by stimulating related private sector investments – the so-called
“crowding-in effect” – as well as providing a solid foundation for social development (Swilling,
2006). In South Africa the importance of infrastructure has not only been emphasised at
national level but also at regional level. The Western Cape Government’s main infrastructure
budgets and investment, both in social and economic infrastructure over the 2017 MTEF,
includes spending by provincial government departments and public entities; as well as
spending on public private partnerships.
In the Western Cape, the region needs efficient transport systems, water and sanitation,
telecommunications and power supplies in order to influence the standard of living of their
populations and regional economic growth. There is, thus, a pressing need to determine
whether government’s strategy on infrastructure investment will yield the desired economic
growth benefits at micro (i.e. project or sector level) or at national or macro level.
28 2017 Socio-economic Profile: Saldanha Bay MunicipalityPROVINCIAL INFRASTRUCTURE SPEND
Empirical evidence at National level has shown that investment in economic infrastructure has
a positive impact on National growth. This growth however depends crucially on provincial
and municipal performance. All municipalities are tasked with basic service delivery objectives
in order to stimulate local economic development. Population growth and deteriorating
infrastructure has continued to place strain on infrastructure budgets. The objective of this
section is to determine if there is a relationship between infrastructure investment and growth
in the West Coast region and to show the success the region has had in providing infrastructure.
West Coast
R731.5 million
Overberg 9% Across districts
R416.0 million R2.6 billion
5% 30%
Eden
R1 billion
12%
Cape Winelands
City of Cape Town R1.3 billion
R2.4 billion Central Karoo 15%
28% R127.7 million
1%
For the financial year 2017/18, the City of Cape Town assumes the majority of the Western
Cape’s infrastructure allocations with an estimated infrastructure spend of R2.4 billion
(30 per cent of Provincial allocation). The Cape Winelands region is another notable receiver
of Infrastructure funding with approximately R1.3 billion (15 per cent of Provincial allocation)
allocated from the Provincial Government. As will be discussed during the course of this
chapter, it’s the mirroring of Provincial infrastructure allocation with Municipal infrastructure
budgets and plans which will truly set the municipality and the Province on a higher growth
path and improved socio-economic environment.
There have been varying levels of infrastructure investments and development across the
131 towns outside the Cape Town Metropolitan areas. Some towns have solid development
potential while others are declining. A number of growth factors have contributed to this
decline (Donaldson et al 2010). Amongst these factors is a deteriorating infrastructure.
Municipal infrastructure consists mainly of bulk treatment plants, pump networks, pump stations
treatment works, reservoirs and distribution pipelines, electricity transmission and distribution
infrastructure. In some municipalities’ infrastructure remains under threat and requires
increasingly more astute management whilst other municipalities have invested significantly in
infrastructure provision and experience high growth rates.
29 2017 Socio-economic Profile: Saldanha Bay MunicipalityInfrastructure Allocations: West Coast
With the growing emphasis on infrastructure investments municipalities within the WCD have
continued in their efforts to improve infrastructure availability. Some municipalities have had
relatively more success in addressing backlogs within their jurisdictions than others. The results
of the 2014 Growth Potential Study of Towns conducted by Donaldson et al (2014) revealed
that the best performing municipalities in the WCD using the Infrastructure index 3 are
Saldanha Bay and Swartland. Bergrivier Municipality was rated as a medium performer whilst
Cederberg and Matzikama were rated low according to the infrastructure index. This
difference in performance may be a result of the differences in real infrastructure expenditure
that has been recorded across the municipalities (see table below4) or differing management
practices.
Vote West Coast Saldanha
Matzikama Cederberg Bergrivier Swartland Total
R’000 District Bay
CapeNature - - - - - - -
Education - - - - 17 000 5 600 22 600
Health - - 550 525 73 532 1 255 75 862
Human
- 5 400 19 540 11 820 20 918 22 250 79 928
Settlements
Public Works - - 10 000 - - - 10 000
Social
- 116 - - - - 116
Development
Roads 186 321 700 26 000 167 000 151 000 12 000 543 021
Total 186 321 6 216 56 090 179 345 262 450 41 105 731 527
Source: Provincial Treasury, 2017
The Provincial expenditure on infrastructure is concentrated in Saldanha Bay (R262.4 million)
followed by Bergrivier (R179.3 million). The region’s second largest economic powerhouse of
Swartland displays a lower allocation in 2017/18 of R41.1 million. However, their dominant
position economically and relatively high infrastructure index as per previous Provincial
Treasury publications renders their infrastructure requirements somewhat different to the
surrounding neighbouring municipalities. Overall, in 2017/18 the WCD infrastructure
expenditure made up 9.0 per cent of the total infrastructure expenditure for the whole
Province.
3 Their final core indicators where vacant industrial stands, distance to nearest scheduled airport, distance to nearest
small harbour and slipway, percentage households with in-house access to water, percentage household with
access to electricity, and spare capacity of waste water treatment works (WWTW) (Donaldson 2010:66).
4 Note these figures have been inflation adjusted.
30 2017 Socio-economic Profile: Saldanha Bay MunicipalityIn relation to Provincial Budgeted figures for 2017/18 by Vote, Education infrastructure
allocation is concentrated in Saldanha Bay (R17.0 million) and partially in Swartland
(R5.6 million) while Health has a strong focus in Saldanha Bay (R73.5 million). Bergrivier
(R167.0 million) and Saldanha Bay (R151.0 million) account for the majority of the Roads
allocation, while Cederberg (R26.0 million) and Swartland (R12.0 million) receive moderate
allocations. Matzikama has not been earmarked for significant Roads allocations (R700 000).
In relation to Human Settlements, Cederberg (R26.0 million), Bergrivier (R167.0 million) and
Saldanha Bay (R151.0 million) account for the notable allocations. Naturally, the question arises
as to the readiness of the macro-economy and socio-economy in its ability to absorb these
Human Settlements provisions. In particular, with the demand for services set to rise and the
ability to pay for these services rendered is to be measured by per capita incomes. This in turn
becomes the question of concern.
The following table lists the Top 10 2017/18 capital projects (in terms of value) that contribute
to Saldanha Bay’s total infrastructure allocation:
R’000
Sector Project/Programme Name
2017/18 2018/19 2019/20
Transport C975.1 AFR Saldanha Bay IDZ 41 000 90 000 72 000
Transport C415.2 AFR Saldanha TR77 106 000 46 000 3 000
Health CI830080: Vredenburg - Vredenburg 69 830 44 500 800
Hospital - Upgrade Ph2B Completion
Transport C1010 Vredenburg-Stompneusbaai - - 50 000
Education Saldanha Middelpos PS (Replacing 1 500 5 000 30 000
Buhrein Estate PS
Education Panorama PS N2 15 000 19 258 -
Transport C802.4 St Helena Bay-Stompneus Bay - - 20 000
Health CI810096: Vredenburg - Vredenburg 50 1 000 15 000
CDC - New
Human Settlements 3144-02 - St Helena Bay Laingville - 10 480 -
(176 services) UISP
Public Works GB Vredenburg Shared Office Building - - 9 451
Provincial Government infrastructure spend in Saldanha Bay amounts to R233.3 million in
2017/18, the bulk (R147.0 million) will be directed towards road projects in Saldanha Bay
(economic infrastructure). The major project to be funded through this allocation accrues to
the Saldanha TR77 project (R106.0 million in 2017/18). Next follows the Vredenburg Hospital
upgrade project (R69.8 million) and Saldanha Bay IDZ road project (R41.0 million).
31 2017 Socio-economic Profile: Saldanha Bay MunicipalityMUNICIPAL INFRASTRUCTURE SPEND
National and Provincial Transfers
The main sources of infrastructure funding at Municipal level mainly emanate from either
internal (own) revenue sources and National Government and Provincial Government in the
form of grants. These grants are complimentary to municipal own funding and are aimed to
address historical social and economic infrastructure backlogs.
The following table contains the total capital transfers and grants received by the Cederberg
Municipality from National and Provincial Government over the 2017/18 MTREF. The
information depicted below was obtained from the budget schedules within the Municipality’s
2017/18 approved budget. The names of specific grants may therefore differ from their official
wording.
2017/18 Medium Term Revenue
Audited Audited Audited Full Year and Expenditure Framework
Description Outcome Outcome Outcome Forecast
R’000 Budget Budget Budget
2013/14 2014/15 2015/16 2016/17 Year Year +1 Year +2
2017/18 2018/19 2019/20
National Government 17 694 19 490 20 778 19 605 21 743 22 567 25 480
Municipal Infrastructure Grant 17 040 17 470 17 948 17 605 18 703 19 567 20 480
(MIG)
Integrated Electricity Programme - 2 000 2 000 2 000 3 000 3 000 5 000
Finance Management Grant - 20 30 - 40 - -
Municipal Systems Improvement 100 - 800 - - - -
EPWP Incentive 554 - - - - - -
Local Government Equitable - - - - - - -
Share
Provincial Government 32 122 22 161 49 529 19 301 12 883 13 480 -
Housing 24 122 22 011 3 652 3 630 - 10 480 -
Regional Socio- Economic Project - - 3 500 7 854 8 400 3 000 -
Helix Programme - - - - 50 - -
Vredenburg Urban Revitalisation - - 34 257 5 932 4 433 - -
Grant
Contribution towards acceleration 8 000 - 7 000 - - - -
of housing delivery
Cultural Affairs and Sport Library - 150 1 120 - - - -
services
ACIP - - 1 885 1 885 - - -
Donation Transnet - 8 000 9 000 5 749 - - -
Donation Afrisam - - - 2 105 - - -
Donations Afrisam - - - - 2 000 - -
Total Capital Transfers and Grants 49 816 49 650 79 307 46 760 36 626 36 047 25 480
Source: Municipal Approved Budget, 2017 (Budget Schedule SA18)
32 2017 Socio-economic Profile: Saldanha Bay MunicipalityIn relation to Budget Schedule SA18 of Saldanha Bay’s approved budget for 2017/18, the
seven-year review commencing in 2013/14 and concluding in the outer MTREF year of 2019/20
reveals an increasing trend in the total capital grants from 2013/14 to 2017/18, peaking at
R79.3 million in 2015/16 and subsequently contracts to R46.7 million in 2016/17 and R36.6 million
in 2017/18. In 2017/18, the national and provincial infrastructure grants display a
disproportionate split at R21.7 million and R12.8 million respectively.
In 2017/18, the largest infrastructure grant from national government is the Municipal
Infrastructure Grant (MIG) of R18.7 million; other national grants being the Integrated National
Electrification Programme Grant (R3.0 million).
The main source of infrastructure grants from the Western Cape Government relate to the
Regional Socio-Economic Project Grant (R8.4 million) and the Vredenburg Urban Revitalisation
Grant (R4.4 million).
33 2017 Socio-economic Profile: Saldanha Bay MunicipalityYou can also read