Detection and modeling of soil salinity variations in arid lands using remote sensing data
←
→
Page content transcription
If your browser does not render page correctly, please read the page content below
Open Geosciences 2021; 13: 443–453
Research Article
Abduldaem S. Alqasemi, Majed Ibrahim*, Ayad M. Fadhil Al-Quraishi, Hakim Saibi,
A’kif Al-Fugara, and Gordana Kaplan
Detection and modeling of soil salinity variations
in arid lands using remote sensing data
https://doi.org/10.1515/geo-2020-0244 Keywords: electrical conductivity, remote sensing, Landsat 8,
received September 26, 2020; accepted March 15, 2021 salinity salinization, spectral index, LST
Abstract: Soil salinization is a ubiquitous global problem.
The literature supports the integration of remote sensing
(RS) techniques and field measurements as effective
methods for developing soil salinity prediction models. 1 Introduction
The objectives of this study were to (i) estimate the level
of soil salinity in Abu Dhabi using spectral indices and Soil salinization, which is a common form of soil degra-
field measurements and (ii) develop a model for detecting dation, is one of the world’s most widespread environ-
and mapping soil salinity variations in the study area mental problems [1–5]. This global problem results in
using RS data. We integrated Landsat 8 data with the elec- land degradation, especially in irrigated areas in arid
trical conductivity measurements of soil samples taken and semiarid environments as well as in some subhumid
from the study area. Statistical analysis of the integrated regions [3,6]. Soil salinization has become increasingly
data showed that the normalized difference vegetation serious in recent decades, with salinization exceeding the
index and bare soil index showed moderate correlations average level of soil salinity in the past few years because
among the examined indices. The relation between these of unsustainable agricultural practices that lead to the
two indices can contribute to the development of suc- accumulation of soluble salts in soil [3,5,7,8]. Soil salini-
cessful soil salinity prediction models. Results show that zation reduces the land value and productivity [9,10].
31% of the soil in the study area is moderately saline and By reducing the soil quality, soil salinization limits the
46% of the soil is highly saline. The results support that suitability of the land for agriculture or reclamation and
geoinformatic techniques using RS data and technologies can increase soil dispersion and erosion.
constitute an effective tool for detecting soil salinity by Soil salinization is a severe environmental hazard
modeling and mapping the spatial distribution of saline that influences almost half of the existing irrigation plans
soils. Furthermore, we observed a low correlation between of worldwide soils facing the threat of secondary salini-
soil salinity and the nighttime land surface temperature. zation [3,11,12]. General estimates indicate that approxi-
mately 1 billion hectares of land are affected by saliniza-
tion worldwide, constituting 7% of the continental area of
* Corresponding author: Majed Ibrahim, Geographic Information
the Earth and 58% of the irrigated land [3,13,14]. The
System and Remote Sensing Department, Erath and Environmental main causes of soil salinization in dry regions include
Science Institute, Al al-Bayt University, Al Mafraq, Jordan, irrigation (i.e., overpumping), poor water drainage, and
e-mail: majed.ibrahim@aabu.edu.jo climate change [15–19]. Therefore, areas of agricultural or
Abduldaem S. Alqasemi: Geography and Urban Sustainability, arable lands will dwindle because of salinization [5].
College of Humanities & Social Science, UAEU, Al-Ain,
Additionally, many countries are confronted with varying
United Arab Emirates
Ayad M. Fadhil Al-Quraishi: Surveying and Geomatics Engineering degrees of soil salinization. The Food and Agriculture
Department, Faculty of Engineering, Tishk International University, Organization has estimated that 397 million hectares of
Erbil, Iraq the world’s agricultural or nonagricultural lands have
Hakim Saibi: Geology Department, College of Science, UAEU, Al-Ain, been affected by soil salinization [3,6,10,11,20,21]. Thus,
United Arab Emirates
it is crucial to determine which lands are affected by soil
A’kif Al-Fugara: Surveying Engineering Department,
Engineering-College, Al al-Bayt University, Al Mafraq, Jordan
salinization, evaluate soil salinity, and determine the root
Gordana Kaplan: Institute of Earth and Space Sciences, causes of salinization to help decision makers develop
Eskisehir Technical University, Eskisehir, Turkey management plans for ensuring the sustainability of
Open Access. © 2021 Abduldaem S. Alqasemi et al., published by De Gruyter. This work is licensed under the Creative Commons Attribution
4.0 International License.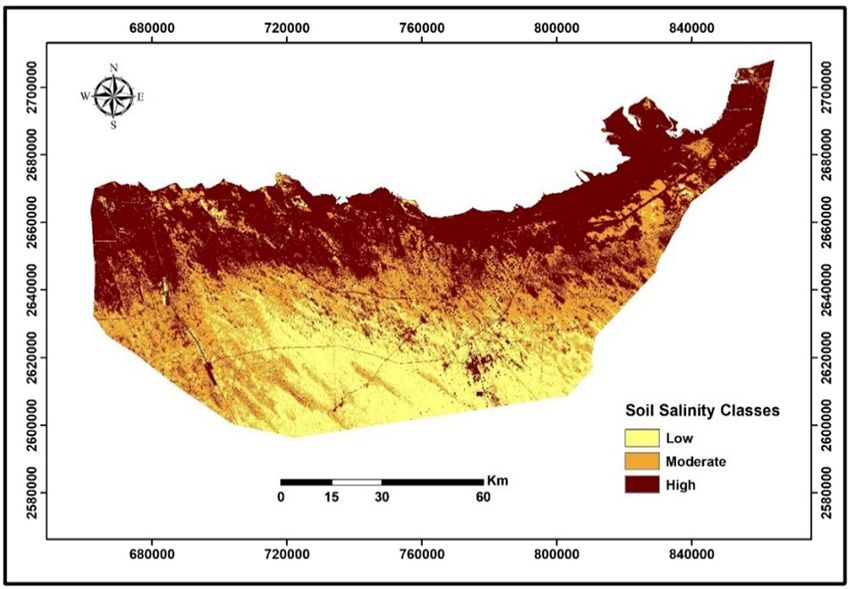
444 Abduldaem S. Alqasemi et al.
Figure 1: Locations of the study area and sampling sites.
agricultural land. This must be prioritized globally researchers (e.g., ref. [31]) have studied soil salinity
because soil salinization has deleterious impacts on based on moisture content using the normalized differ-
the soil quality and productivity and is ubiquitous in ence infrared index. Other researchers have assessed
the arid and semiarid parts of the world [1,3,22,23]. the relations between soil salinity and vegetation indices
Researchers have recently shown significant interest [5,26,32–36]. Other studies have analyzed soil salinity
in evaluating and mapping soil salinity in many regions using the thermal and short infrared wavelength bands
around the world, especially in arid and semiarid areas [3,5,28,34,37] to examine the relation between soil salinity
that are heavily affected by salinization. For soil salinity and the land surface temperature (LST). These studies
evaluation and mapping, data must be collected using used satellite imagery containing thermal bands such
traditional soil sampling and laboratory analysis methods. as a moderate resolution imaging spectroradiometer
However, these methods are time-consuming and costly, (MODIS), which provides useful information about the
thereby limiting surveys to small areas [1,3,5,24]. To over- soil properties [38–40]. Recently, the multispectral data
come this limitation, several techniques have been devel- derived from sources, such as the System Pour I, Obser-
oped for evaluating soil salinity. One such technique is vation de la Terre (SPOT), IKONOS, Quick Bird, Indian
based on remote sensing (RS), which has demonstrated Remote Sensing, and Landsat satellites, have been used
considerable success in mapping and assessing soil salinity to explore map soil salinity. Several other indices, such
[5,25,26]. as the salinity index [41] and the soil adjusted vegeta-
Metternicht [27], Metternicht and Zinck [28], Eldeiry tion index [42], are also commonly employed to monitor
and Garcia [29], and Furby et al. [30] observed that mean- soil salinity. However, Eldeiry and Garcia [29] and Hu et al.
ingful results could be obtained by studying the spectral [43] recommended the combined use of spectral response
properties and radar backscatter of saline soils. Some index and best band [44,45].
Detection and modeling of soil salinity variations in arid lands using RS data 445
The RS tools and data must be integrated with the field in the deposition of large amounts of salts in the soil, increa-
measurements of salinity to achieve soil salinity evaluation sing the percentage of insoluble salts beyond saturation.
and monitoring. RS is an efficient tool for spatial analysis of These factors and the associated soil salinization pose
soil salinity in arid and semiarid areas; therefore, we aimed serious environmental threats to the soil environment in
to estimate the soil salinity in Abu Dhabi using specific the Sabkha area. Soil degradation leads to decreased soil
spectral indices combined with field measurements. The productivity, and uneven dehydration of gypsum contri-
soil salinity mapping model developed in this study is butes to the development of cracks in the soil surface. High
based on the electrical conductivity (EC) of soil and shows concentrations of sulfate and carbonate salts lead to the
a promising correlation, which can be further improved by corrosion of the steel pipes of water and oil distribution
considering the soil salinity–LST relation. This model is networks [9,56].
helpful to develop effective soil salinity forecasting strate-
gies for sustainable development and land management.
3 Methodology
2 Methods The methods followed in this study can be broadly divided
into three categories: (i) field measurements, (ii) image
processing, and (iii) statistical analysis.
2.1 Study area
The study area is located in the western part of the United
Arab Emirates (UAE) near the coast of Abu Dhabi (Figure 1). 3.1 In situ and laboratory measurements
The study area covers parts of the central and south-
western areas of Abu Dhabi and lies between 24.44° After consideration of heterogeneity, soil samples of dif-
and 23.46°N latitude and 52.59° and 54.49°E longitude. ferent types of with diverse salinity levels were collected
The study area exhibits a hot arid climate with high from 80 sites in a desert area with dominant sand dunes.
temperatures through the night during summer. The Soil samples were collected in two directions along a
mean minimum and maximum summer temperatures stretch of the existing roads in the study area at different
are 21.7 and 33°C, respectively [9,46]. In the zones away distance to ensure that the samples covered different
from the Sabkha area, mean temperatures can reach 43°C types of land and included inland Sabkha and saline
in summer and 17°C in winter [47,48]. The mean annual soil areas. The samples were divided into two groups,
rainfall is slightly less than 120 mm, which corresponds i.e., soil samples collected from the areas in dune zones
to extremely arid climatic conditions. This rainfall is 37% near major roads and those collected from the inland
of the precipitation near the Strait of Hormuz, 40–50% of Sabkha and saline soil areas. This categorization of the
that in the shallow depths of the UAE coastal areas, soil samples allowed the assessment of the soil salinity
60–70% of that in lagoons and embayments, and 65% and degradation index. Some samples from both groups
of that in the Arabian Gulf coastal lagoons [47,49–52]. were used in salinity estimation and model development,
Aridisols, Entisols, and Inceptisols types of soil covered and the remaining samples were employed for model
Emirate, where the soils have been classified into three validation. The fieldwork was conducted in November
soil orders [53]. Most of the Emirate areas were covered by 2016, and sampling was performed during dry weather
Entisols, then Aridisols to a lesser extent, and Inceptisols conditions, indicating the occurrence of no rainfall in the
are the least common in the region. Entisols and Aridisols study area during sample collection.
are the types of soil that covered Abu Dhabi [54,55]. The soil samples were analyzed in the laboratories of
The study area is categorized as one of the largest United Arab Emirates University. Following the standard
Sabkha surfaces, both coastal and inland, in the world. soil analysis methods presented by Evans et al. [51], the
This region is dominated by the hot arid climate zone, as soil samples were air-dried at room temperature, frag-
evidenced by the salt flats and marshes, which are cate- mented by hand or using a geological hammer, and
gorized as the geological features of Sabkha commonly then ground. A 1:2 soil–water suspension was prepared
observed under arid and semiarid climatic conditions [47,51]. by mixing the soil mass with a volume of deionized water
Evaporation is considerably higher because of the extre- equivalent to double the soil mass. An EC meter (ExStik
mely hot climatic conditions of the study area. This results EC 400) was used to measure the conductance of the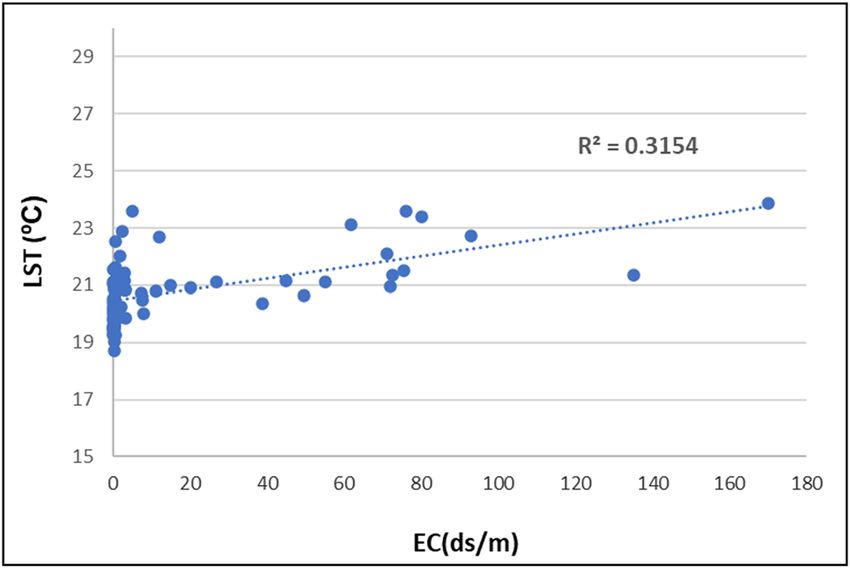
446 Abduldaem S. Alqasemi et al.
soil suspension to indicate the amount of soluble salts 3.3 Image analysis
in the soil. This EC meter measures conductivity in the
ranges of 0–199.9, 200–1999, and 2.00–19.99 mS/cm. Four spectral indices were utilized in this study to achieve
Soil samples with EC values higher than the EC meter’s the study objectives. These indices are normalized differ-
upper limit were further diluted to enable accurate EC ence vegetation index (NDVI), the bare soil index (BSI),
measurements. the spectral salinity index 1 (SSI1), and SI.
Following Kissel and Sonon [57], soil salinity was
classified into three classes in terms of soil quality and
suitability for plant growth, as shown in Table 1. Previous 3.4 NDVI
research projects developed soil salinity scales (e.g., the
soil quality guideline) in terms of the sodium adsorption NDVI represents the normalized ratio of near-infrared and
ratio and EC for unrestricted land use [7,57]. The compar- red reflectance has been used in many scientific studies
ison of the soil EC values obtained in this study with the related to environmental issues such as soil and vegetation
soil salinity scale found in the Soil Test Handbook for degradation [58]. NDVI is calculated as follows:
Georgia [57] indicates that most of the study samples
λ NIR − λ Red
are in the very high salinity level. NDVI = , (1)
λ NIR + λ Red
where NIR is the near-infrared reflectance (λ ≈ 0.8 µm)
and red is the red-band reflectance (λ ≈ 0.64 µm).
3.2 Data acquisition Variations in soil brightness can lead to noticeable varia-
tions in NDVI values [59].
The RS data for this research were downloaded from the
US Geological Survey Earth Explorer (https://earthexplorer.
usgs.gov/). The data collected were the Landsat 8 Opera-
3.5 BSI
tional Land Imager (OLI) and day and night MODIS LST
BSI is the second index considered in this study. It com-
data (Aqua and Terra) MYD11A1 and MOD11A1, which
bines the surface reflections of blue, red, green, and near-
were geometrically corrected and rectified to UTM zone
infrared radiation and is employed to detect soil varia-
39. The images acquired on November 6, 2016 (path 161
tions from the Landsat 8 OLI and Thematic Mapper
and rows 43 and 44) were utilized to correspond with the
images. BSI was used to assess the condition of barren
fieldwork. MODIS data with horizontal (h) and vertical (v)
soil, which is helpful in determining the state of land
title number h22v06 were downloaded. All image data
degradation because of salinity. BSI also helps to deter-
were prepared and analyzed after performing atmospheric
mine the relation between soil salinity and plant growth,
correction. The images were indexed and analyzed and
mainly in the coastal and inland Sabkha that covers most
the database created. The GIS environment tools were
of the study area [60]. BSI is calculated as follows [61]:
used to compose the images and to map soil salinity.
MODIS/Terra and Aqua satellite imageries were used (λ Red + λ Green) − (λ Red + λ Blue)
BSI =
to examine the correlation between in situ salinity mea- (λ NIR + λ Green) + (λ Red + λ Blue)
surements and LST values obtained from satellite imagery (2)
in the study area. The results were analyzed statistically × 100 + 100
using Microsoft Excel.
Table 1: Soil salinity classes (modified from Kissel and Sonon [57])
EC (dS/m) Soil salinity class Description
2.00 High – Suitable for some types of plants and unsuitable for seedlings or cuttings
– If the EC increases to more than 2 dS/m, then the soil will be unsuitable for plant growth
– Plants will be severely dwarfed, and the seedlings and rooted cuttings will frequently dieDetection and modeling of soil salinity variations in arid lands using RS data 447
3.6 SSI1 Table 2: Descriptive statistics for five study variables (EC, SI, SSI1,
NDVI, and BSI)
SSI1 was also employed in this study. It is one of the
common indices used to estimate soil salinity in dry Parameter EC (dS/m) SI SSI1 NDVI BSI
land and in arid and semiarid areas, and it is sensitive Min. 0.09 0.06 0.10 0.00 0.6
to the soil salinity in arid and semiarid regions [60]. SSI1 Max. 170.10 0.18 0.26 0.10 0.12
is calculated as follows [60]: Mean 15.67 0.08 0.21 0.07 0.08
Standard deviation 32.66 0.03 0.03 0.02 0.03
SSI1 = Blue × SWIR2, (3) Standard error 3.65 0.00 0.00 0.00 0.00
where SWIR2 is the shortwave infrared-2 reflectance
(λ ≈ 2.2 µm) and blue is the blue-band reflectance
Table 3: Results of the analysis of correlation among the study
(λ ≈ 0.48 µm). variables
Variable Soil salinity SI SSI1 BSI NDVI
Soil salinity 1
3.7 SI SI 0.21 1
SSI1 0.21 0.26 1
SI is the salinity index derived from the broadband sate- BSI 0.25 0.23 0.41 1
llite images that indicate the relation between the actual NDVI 0.43 0.19 0.46 0.80 1
soil salinity and the variation in vegetation. Thus, many
Note: The significance for all bold values were less than 0.05.
studies have evaluated soil salinity by referring to vege-
tation reflectance [62]. This index is defined as the square
root of the reflectance of blue radiation multiplied by the area are highly saline (Table 3). The highly saline parts
reflectance of the red radiation [63]. of Sabkha area are categorized as salt flats. Additionally,
(4) although the maximum EC value in the study area is
SI = Blue × Red,
170.1 dS/m, most of the nonsaline soil locations are located
where blue and red denote the reflectance in the blue and far from the Sabkha and have a minimum EC value of
red light regions of the spectrum (λ ≈ 0.48 µm and λ ≈ 0.09 dS/m. Statistical analyses were conducted on the five
0.64 µm), respectively. main study variables: EC, SI, SSI1, NDVI, and BSI (Table 2).
NDVI and BSI show the strongest correlations with
soil salinity, with coefficient of determination (R2) values
of 0.43 and 0.25, respectively (Table 3). Regression ana-
3.8 LST lysis demonstrates that the model predicting EC from
NDVI and BSI has a prediction power of 80%, as indi-
Temperature was converted from kelvin (K) to Celsius cated by an R2 value of 0.80. Thus, only NDVI and BSI
(°C) using the following equation. First, we multiplied were used to generate the final salinity model for the
the unit by an assigned scale factor of 0.02 to obtain study area. Results reveal that the probability (p) values
the value in kelvin, after which the resulting value was were less than 0.05, indicating a statistically significant
subtracted by 273.15 to convert K to °C. correlation between the RS data and field measurements.
LST (°C) = a × DN – 273.15 (5) Thus, these data can be used to model the spatial distri-
bution of soil salinity in the study area.
where °C is the LST in Celsius and a is the scaling factor of
the MODIS LST product [43].
4.1 Relation between vegetation indices and
soil salinity
4 Results and discussion
The soil analysis results show that the relation between
Results of the laboratory analyses of soil samples indi- NDVI and soil salinity is statistically significant (R2 = 0.43,
cated that although nonsaline soils characterize certain p < 0.05). This statistical significance indicates that the
parts of the study area, soils in the majority of the Sabkha relation between NDVI and soil salinity is caused by one448 Abduldaem S. Alqasemi et al.
Figure 2: Relation between the measured soil salinity and NDVI.
Figure 3: Relation between the NDVI and BSI.
of them affecting the other and that there is less than 5%
probability of rejecting the relation between NDVI and soil
prediction power (R2 = 0.79) This relation is obtained
salinity. Table 3 and Figure 2 show the regression model
because NDVI and BSI use the red and NIR spectra in
quantifying this relation.
the equations. Additionally, BSI reflects the percentage
Salinity = −1074.8 × NDVI + 92.83 (6) of land degradation when generally considering a low
NDVI maps of study were produced to explore the rainfall; however, it does not indicate whether an area is
seasonal vegetation cover variation and its relation with extremely low in vegetation, as estimated by NDVI. Low
on soil salinity. The results showed a significant inverse NDVI values are associated with extreme climatic conditions
correlation between the NDVI values and soil salinity such as extremely low annual rainfall (≤120 mm/year) and
value (R2 = 0.43). Sabkha soil areas which are located high evaporation rates (2,000 mm/year). Furthermore, sali-
in northern and central regions of the study area have nization has negative effects on plant roots, which passively
high values of soil salinity and low values of NDVI. On the affects plant growth.
other hand, the southern region of the study area has The NDVI and BSI maps were produced and com-
the most green-covered area with high values of NDVI pared with each other. The results showed significant
and low soil salinity values. Generally, the north-eastern positive relationship (R2 = 0.79). The low values of BSI
region of the study is lacking the most in terms of vegeta- and NDVI were recorded in the north-central regions of
tion and greenland due to salinization layers which dis- the study area, whereas high values were recorded in the
able plant growth. The salinity of the soil thus plays a southern parts. Despite the presence of saline layers in
larger role in the breakdown of the physical structure of south-central region, soil moisture in winter contributes
the soil, leading to a loss of the canopy of vegetation to the availability of soil vitality at a minimum level. This
in the areas. Therefore, an immediate need is felt to means soil salinity plays greater role in preventing the
research the causes and consequences of soil salinity. availability of the appropriate environment to increase
vegetation cover and soil productivity.
4.2 The relation between soil salinity and 4.2.2 Relation between soil salinity and BSI
NDVI differs from site to site in the
study area We investigated the relation between the measured soil
salinity and BSI to determine whether soil salinity leads
4.2.1 Relation between NDVI and BSI to land degradation. Results (Figure 4) revealed a statis-
tically significant relation between soil salinity and BSI
Figure 3 shows the relation between land degradation (R2 = 0.25, p < 0.05), indicating a strong evidence against
(expressed in terms of BSI) and vegetation cover (in terms no relation between soil salinity and BSI (Table 3). The
of the NDVI). Results indicate a statistically significant relation level was different from the expectations because
relation between BSI and NDVI (p < 0.05), and the regres- the salinity in Sabkha soil can be attributed to the salty
sion model that predicts BSI from NDVI has a moderate groundwater near the surface in that area, which is basedDetection and modeling of soil salinity variations in arid lands using RS data 449
Figure 4: Relation between the measured soil salinity and BSI.
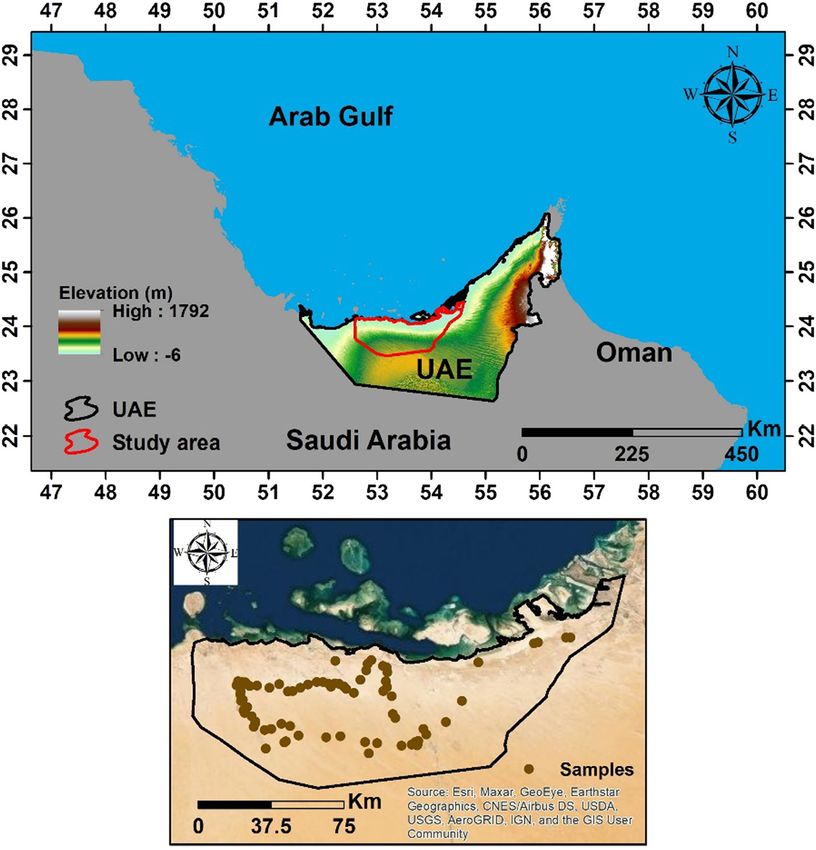
Figure 5: Predicted digital soil salinity map.
on Al-Mhaidib [64]. Thus, shallow water that can be
attributed to droughts or very low rainfall can affect the
BSI results. The linear regression model describing the mapped based on the classification given by Kissel and
relation between these variables can be expressed as Sonon [57]. Figure 5 presents the predicted soil salinity
follows: map for the study area generated based on the NDVI-BSI
regression model (equation (8)), which can be expressed
Salinity = −567.74 × BSI + 59.381 (7)
as follows:
BSI maps of the study area are produced to investi-
Soil salinity = −284 × BSI – 537 × NDVI + 76 (8)
gate the relationship between the spatial distribution of
soil degradation and soil salinity. The BSI values ranged BSI is sensitive to soil salinity and is thus regarded as
from low to moderate in the northern and central regions a good model for mapping the high soil salinity levels of
of the study area. While the BSI values increase from the Sabkha area. However, this index does not accurately
moderate to high values, the further we move from the predict low soil salinity levels. This can be attributed to
shore in south direction and inversely with the soil sali- the fact that certain types of soils, such as low salinity
nity values, it is therefore very evident that the north- soils, show no spectral response in the NIR-SWIR spectral
middle direction of the areas is dominated by the humidity range [9].
and these areas are affected by the impact of salt water, The model obtained based on these indices has proved
which forms salt layers. Soil moisture from seawater pre- to be capable of mapping and accurately estimating soil
vents absolute drought and soil degradation in the northern salinity at different levels within the study area and has a
part of the study area, particularly during the winter season, prediction power of 36% (R2 = 0.36). This model is based
but at the same time contributes to the formation of salini- on NDVI and BSI, which are calculated using the surface
zation layers due to the high temperatures caused by hot reflectance of NIR radiation, making this a useful tool for
events during summer season, which affect the reading of monitoring soil salinity.
RS data in the Sabkha soil area. The study findings show that most saline soils are
Results support that any increase in soil salinity will located in the inland Sabkha, which may be attributed
adversely affect the growth of vegetation, thereby decrea- to the salty groundwater near the surface in that area.
sing the NDVI and increasing the BSI. In consideration of Al-Mhaidib [64] mentioned that the upward movement
these results, the ArcGIS software was used to generate a of water due to capillary action because of the increased
digital soil salinity map based on the aforementioned continuous evaporation rate results in increased salinity
regression models using the raster calculator. Regression of Sabkha soils and salt deposition at the top surface of
models were used to estimate and model soil salinity for the Sabkha. Additionally, soil salinity is generally higher
the study area. in the northern part of the study area near the Arabian
This study aims to present an example of soil salinity Gulf, which can be attributed to the deposition of carbo-
mapping based on the soil salinity categories and shows nates by wind erosion of inland dunes due to the northerly
the geospatial distribution of soil salinity within the (Shamal) winds [9]. The nonsaline soils are mostly located
study area. The soil salinity levels were classified and in the southern inland parts of the study area.450 Abduldaem S. Alqasemi et al.
4.2.3 Relation between soil salinity and LST
The MODIS LST data were analyzed against the in situ
salinity data. However, some of the daily LST data were
excluded from correlation analysis because the corre-
sponding in situ salinity data were unavailable. Here,
we present the most meaningful and relevant results of
the analyses. Results showed no statistically significant
relation between LST/NDVI and LST/BSI, with correla-
tions of R2 = 0.14 and 0.05 for LST/BSI and LST/NDVI,
respectively. p < 0.05 indicates less than 5% probability
to reject the relation between LST and various indices, Figure 7: Relation between the measured EC values and soil salinity
where the effect of LST on vegetation and land degradation estimated from the model.
is different, as indicated by the correlation values. All the
LST data were obtained on November 6, 2016, in correspon-
the presented results demonstrate that the best correla-
dence with the in situ measurements. Four types of LST data
tion could be achieved using the nighttime LST data.
were analyzed against the in situ salinity data, and the
Considering the low spatial resolution of the MODIS
correlation of all the data varied from 0.22 to 0.56. The night-
data, the obtained results are statistically significant.
time LST data exhibited a significant correlation of greater
Results show that salinity will increase more in areas
than 0.4, as shown in Table 4. Results indicate a statisti-
with higher temperatures and that increased temperatures
cally significant physical process-driven correlation.
can lead to increased salinity. This assumption is supported
The highest positive correlation for salinity can be
by the statistical results, where a correlation of 56% and an
observed with the nighttime Aqua LST data (0.56; Table 4),
R2 of 0.32 were achieved. For future studies, the number of
whereas the correlation with daytime LST is very low.
in situ measurements must be increased and satellite data
Figure 6 shows the LST correlation against in situ salinity
with higher spatial resolution must be used.
from this highest correlation on November 6, 2016. Thus,
Table 4: LST with salinity in situ correlation results
4.3 Validation
Aqua_Day Aqua_Night Terra_Day Terra_Night A low correlation (R2 = 0.36) was found between the
measured EC values and the corresponding soil salinity
r 0.22 0.56 0.25 0.43
estimates of the model when validating the developed
R2 0.05 0.32 0.06 0.16
model (Figure 7). Nevertheless, the soil salinity model
developed based on NDVI and BSI can be used for detec-
tion and prediction in case of salt-affected soils.
Generally, the reflectance in the visible and NIR
bands is beneficial for identifying saline and nonsaline
surfaces. Many studies [3,5,8,25,62] have shown that spectral
indices (e.g., NDVI, SI, SSI1, and BSI) can be used to assess
soil salinity and identify the salt-affected areas using imagery
data. Thus, the model developed in this study is a promising
tool for tracking soil salinity in the study area.
5 Conclusion
We developed a model for estimating and monitoring soil
Figure 6: Relation between the nighttime Aqua LST and salinity salinity in Abu Dhabi (UAE) using RS-based spectral indices
correlation. and field measurements of soil salinity. Results support theDetection and modeling of soil salinity variations in arid lands using RS data 451
possibility of modeling and mapping soil salinity using RS Author contributions: M. I. and A. A. were involved in
and GIS techniques. The results show that 31% of the soil is conceptualization; M. I. contributed to methodology;
moderately salty in the sample region and that 46% of the M. I., G. K., and A. A were in charge of software; A. A., A. H.,
soil is extremely salty. The findings suggest a statistically and A. A. were involved in validation; A. A., A. H., and A. A.
significant relationship between NDVI and soil salinity were in charge of formal analysis; A. A., A. H., and A. A. were in
(R2 = 0.43, p < 0.05) and a significant relationship between charge of resources; A. A. and A. H. performed data curation;
LST/NDVI and LST/BSI, with a correlation between R2 = M. I. wrote the original draft; M. I., A. A. and A. A. contributed
0.14 and 0.05 for LST/BSI and LST/NDVI, respectively. to writing (review and editing); M. I. supervised the project;
The regression model that forecasts NDVI BSI has a medium A. A. managed the project; A. A. was in charge of funding
predictive power (R2 = 0.79). Study findings suggest that acquisition. All authors have read, and agreed on, the pub-
any increase in soil salinity will adversely affect vegetation lished version of the manuscript.
growth. In the light of these findings, the ArcGIS software
was used to generate a digital soil salinity map based on the Conflict of interest: The authors declare no conflict of
regression models using the raster calculator. The integra- interest and that the funders had no role in the design
tion of RS data and field measurements is a powerful tool of the study; in the collection, analysis, or interpretation
for detecting salt-affected soils. The developed model could of data; in the writing of the manuscript, or in the decision
detect 77% of the salt-affected soils in the study area. Thus, to publish the results.
this model can be confidently used to detect soil salinity in
areas experiencing soil salinization. This model’s ease of
use and acceptable results make it a promising tool for
predicting soil salinity. Although the imagery data used References
in this study are of low resolution (30 m × 30 m), the
model provides useful results reflecting the variations [1] Farifteh J, Farshad A, George R. Assessing salt-affected soils
in soil salinity distribution. Accordingly, this study using remote sensing, solute modelling, and geophysics.
proves the model’s ability to determine degrees of soil Geoderma. 2006;130:191–206.
[2] Fernandez-Buces N, Siebe C, Cram S, Palacio J. Mapping soil
salinity in the region using RS data and GIS geospatial
salinity using a combined spectral response index for bare soil
analysis for effective soil management and monitoring. and vegetation: a case study in the former lake Texcoco,
In addition, this study showed a low correlation between Mexico. J Arid Environ. 2006;65:644–67.
soil salinity and nighttime LST, indicating that salinity will [3] Ibrahim M. Modeling soil salinity and mapping using spectral
increase with the increasing temperature. However, the remote sensing data in the arid and semi-arid region.
Int J Remote Sens Appl. 2016;6:76–83.
correlation between soil salinity and LST is an ongoing
[4] Mougenot B, Pouget M, Epema G. Remote sensing of salt
research topic. For future work, we recommend more
affected soils. Remote Sens Rev. 1993;7:241–59.
detailed investigation on this topic by increasing the [5] Wu W, Mhaimeed AS, Al-Shafie WM, Ziadat F, Dhehibi B,
number of in situ measurements and using satellite data Nangia V, et al. Mapping soil salinity changes using remote
with higher spatial resolutions. sensing in Central Iraq. Geo Reg. 2014;2:21–31.
[6] Dehni A, Lounis M. Remote sensing techniques for salt
affected soil mapping: application to the Oran region of
Supplementary materials: The imagery data (Landsat 8
Algeria. Proc Eng. 2012;33:188–98.
OLI (Operational Land Imager), TIRS (Thermal Infrared [7] Ibrahim MMF. The use of geoinformatics in investigating the
Sensor)) and MODIS data are available online (https:// impact of agricultural activities between 1990 and 2010 on land
earthexplorer.usgs.gov/). degradation in NE of Jordan. Germany: Verlag Nicht
Ermittelbar; 2014.
[8] Noroozi AA, Homaee M, ABBASI F. Integrated application
Acknowledgments: The researchers thank the College
of remote sensing and spatial statistical models to the
of Graduate Studies at United Arab Emirates University
identification of soil salinity: a case study from Garmsar Plain,
for funding this work. The researchers also thank the Iran. Environ Sci. 2011;9(1):59–74.
members of the Department of Earth and Environmental [9] Abuelgasim A, Ammad R. Mapping soil salinity in arid and
Sciences in Al al-Bayt University for providing all neces- semi-arid regions using Landsat 8 OLI satellite data. Remote
sary support. Sens Appl Soc Environ. 2019;13:415–25.
[10] Elhag M. Evaluation of different soil salinity mapping using
remote sensing techniques in arid ecosystems, Saudi Arabia.
Funding information: This research was funded by the J Sens. 2016;2016:1–8.
College of Graduate Studies at the United Arab Emirates [11] Al-Khaier F. Soil salinity detection using satellite remote
University. sensing. Enschede, Netherlands: ITC; 2003.452 Abduldaem S. Alqasemi et al.
[12] Zewdu S, Suryabhagavan K, Balakrishnan M. Geo-spatial [29] Eldeiry AA, Garcia LA. Comparison of ordinary kriging,
approach for soil salinity mapping in Sego Irrigation Farm, regression kriging, and cokriging techniques to estimate soil
South Ethiopia. J Saudi Soc Agric Sci. 2017;16:16–24. salinity using LANDSAT images. J Irrig Drain Eng.
[13] Ghassemi F, Jakeman AJ, Nix HA. Salinisation of land and water 2010;136:355–64.
resources: human causes, extent, management and case stu- [30] Furby S, Caccetta P, Wallace J. Salinity monitoring in Western
dies. Wallingford (United Kingdom): CAB International; 1995. Australia using remotely sensed and other spatial data.
[14] Shrestha DP, Farshad A. Mapping salinity hazard: an inte- J Environ Qual. 2010;39:16–25.
grated application of remote sensing and modeling-based [31] Hardisky M, Klemas V, Smart M. The influence of soil salinity,
techniques. Remote sensing of soil salinization impact on land growth form, and leaf moisture on the spectral radiance of.
management. United States of America: Taylor & Francis Spartina Alterniflora. 1983;49:77–83.
Group; 2009. p. 257. [32] Brunner P, Li H, Kinzelbach W, Li W. Generating soil electrical
[15] Shrivastava P, Kumar R. Soil salinity: a serious environmental conductivity maps at regional level by integrating measure-
issue and plant growth promoting bacteria as one of the tools ments on the ground and remote sensing data. Int J Remote
for its alleviation. Saudi J Biol Sci. 2015;22:123–31. Sens. 2007;28:3341–61.
[16] Ali R, Moghanm F. Variation of soil properties over the land- [33] Huete A, Liu H, Batchily K, Van, Leeuwen W. A comparison of
forms around Idku lake, Egypt. Egypt J Remote Sens Space Sci. vegetation indices over a global set of TM images for EOS-
2013;16:91–101. MODIS. Remote Sens Environ. 1997;59:440–51.
[17] El Bastawesy M, Ali RR, Al Harbi K, Faid A. Impact of the geo- [34] Iqbal F. Detection of salt affected soil in rice-wheat area using
morphology and soil management on the development of satellite image. Afr J Agric Res. 2011;6:4973–82.
waterlogging in closed drainage basins of Egypt and Saudi [35] Steven M, Malthus T, Jaggard F, Andrieu B. Monitoring
Arabia. Environ Earth Sci. 2013;68:1271–83. responses of vegetation to stress. Remote sensing from
[18] El-Bastawesy M, Ali RR. The use of GIS and remote sensing for research to operation. Proceedings of the 18th annual con-
the assessment of waterlogging in the dryland irrigated ference of the remote sensing society United Kingdom; 1992.
catchments of Farafra Oasis in Egypt. Hydrol Earth Syst Sci [36] Zhang T-T, Zeng S-L, Gao Y, Ouyang Z-T, Li B, Fang C-M, et al.
Discuss. 2011;8:10535–63. Using hyperspectral vegetation indices as a proxy to monitor
[19] El Bastawesy M, Ali RR, Deocampo DM, Al, Baroudi MS. soil salinity. Ecol Indic. 2011;11:1552–62.
Detection and assessment of the waterlogging in the dryland [37] Goossens R, Van Ranst E. The use of remote sensing to map
drainage basins using remote sensing and GIS techniques. gypsiferous soils in the Ismailia Province (Egypt). Geoderma.
IEEE J Sel Top Appl Earth Obs Remote Sens. 2012;5:1564–71. 1998;87:47–56.
[20] Hu J, Peng J, Zhou Y, Xu D, Zhao R, Jiang Q, et al. Quantitative [38] Fallah Shamsi SR, Zare S, Abtahi SA. Soil salinity character-
estimation of soil salinity using UAV-borne hyperspectral and istics using moderate resolution imaging spectroradiometer
satellite multispectral images. Remote Sens. 2019;11:736. (MODIS) images and statistical analysis. Arch Agron Soil Sci.
[21] Ibrahim M, Koch B. Assessment and mapping of groundwater 2013;59:471–89.
vulnerability using SAR concentrations and GIS: a case study [39] Ibrahim M, Abu-Mallouh H. Estimate land surface temperature
in Al-Mafraq, Jordan. J Water Resour Prot. 2015;7:588. in relation to land use types and geological formations using
[22] Mehrjardi RT, Mahmoodi S, Taze M, Sahebjalal E. Accuracy spectral remote sensing data in Northeast Jordan. Open J Geol.
assessment of soil salinity map in Yazd-Ardakan Plain, Central 2018;8:174–85.
Iran, based on Landsat ETM + imagery. Am Eur J Agric Environ [40] Ibrahim M, Koch B, Data P. Evaluate the effect the land surface
Sci. 2008;3:708–12. temperature in the arid and semi-arid lands using potential
[23] Sanaeinejad SH, Astaraei A, Mousavi PM, Ghaemi M. Selection remote sensing data and GIS technique. Int J Glob Warm
of best band combination for soil salinity studies using ETM (Forthcoming articles). 2020. doi: 10.1504/
satellite images (A case study: Nyshaboor region, Iran). IJGW.2020.10031655
International conference on geographic information sys- [41] Khan NM, Rastoskuev VV, Sato Y, Shiozawa S. Assessment of
tems; 2009. hydrosaline land degradation by using a simple approach of
[24] Lhissou R, El Harti A, Chokmani K. Mapping soil salinity in remote sensing indicators. Agric Water Manag.
irrigated land using optical remote sensing data. Eurasian J 2005;77:96–109.
Soil Sci. 2014;3:82. [42] Huete HA. AR a soil-adjusted vegetation index (SAVI). Remote
[25] Asfaw E, Suryabhagavan K, Argaw M. Soil salinity modeling Sens Environ. 1988;25:295–309.
and mapping using remote sensing and GIS: the case of Wonji [43] Hu W, Shao MA, Wan L, Si BC. Spatial variability of soil elec-
sugar cane irrigation farm. Ethiopia J Saudi Soc Agric Sci. trical conductivity in a small watershed on the Loess Plateau of
2018;17:250–8. China. Geoderma. 2014;230:212–20.
[26] Garcia L, Eldeiry A, Elhaddad A. Estimating soil salinity using [44] Abou Samra RM, Ali R. The development of an overlay model to
remote sensing data. Proceedings of the 2005 central plains predict soil salinity risks by using remote sensing and GIS
irrigation conference, Citeseer; 2005. techniques: a case study in soils around Idku Lake, Egypt.
[27] Metternicht G. Analysing the relationship between ground Environ Monit Assess. 2018;190:706.
based reflectance and environmental indicators of salinity [45] Ali R, Shalaby A. Response of topsoil features to the seasonal
processes in the Cochabamba valleys (Bolivia). Int J Ecol changes of land surface temperature in the arid environment.
Environ Sci. 1998;24:359–70. Int J Soil Sci. 2012;7:39.
[28] Metternicht G, Zinck J. Remote sensing of soil salinity: poten- [46] Farahat A. Air pollution in the Arabian Peninsula (Saudi Arabia,
tials and constraints. Remote Sens Environ. 2003;85:1–20. the United Arab Emirates, Kuwait, Qatar, Bahrain, and Oman):Detection and modeling of soil salinity variations in arid lands using RS data 453
causes, effects, and aerosol categorization. Arab J Geosci. [55] Al-Shamsei MH. Drainage Basns and flash flood hazards in
2016;9:196. Al-Ain area. United Arab Emirates: United Arab Emirates
[47] Abuelgasim A, Ammad R. Mapping Sabkha Land surfaces in University; 1993.
the United Arab Emirates (UAE) using Landsat 8 data, principal [56] Youssef AM, Pradhan B, Sabtan AA, El-Harbi HM. Coupling
component analysis and soil salinity information. Int J Eng of remote sensing data aided with field investigations for
Manuf. 2017;7:1. geological hazards assessment in Jazan area, Kingdom of
[48] Lokier SW, Knaf A, Kimiagar S. A quantitative analysis of recent Saudi Arabia. Environ Earth Sci. 2012;65:119–30.
arid coastal sedimentary facies from the Arabian Gulf coastline [57] Kissel DE, Sonon LS. Soil test handbook for Georgia. Georgia:
of Abu Dhabi, United Arab Emirates. Mar Geol. The University of Georgia; 2008.
2013;346:141–52. [58] Rouse J, Haas R, Schell J, Deering D. Monitoring vegetation systems
[49] Alsharhan A, Kendall CSC. Holocene coastal carbonates and in the great plains with ERTS. NASA Spec Publ. 1974;351:309.
evaporites of the southern Arabian Gulf and their ancient [59] Carlson TN, Ripley DA. On the relation between NDVI, fractional
analogues. Earth-Sci Rev. 2003;61:191–243. vegetation cover, and leaf area index. Remote Sens Environ.
[50] Bathurst RG. Carbonate sediments and their diagenesis. 1997;62:241–52.
Amsterdam: Elsevier; 1972. [60] Ibrahim M, Ghanem F, Al-Salameen A, Al-Fawwaz A. The estima-
[51] Evans G, Schmidt V, Bush P, Nelson H. Stratigraphy and tion of soil organic matter variation in arid and semi-arid lands
geologic history of the sabkha, Abu Dhabi, Persian Gulf. using remote sensing data. Int J Geosci. 2019;10:576.
Sedimentology. 1969;12:145–59. [61] Rikimaru A, Roy PS, Miyatake S. Tropical forest cover density
[52] Paul P, Tenaiji A, Kulaib A, Braimah N. A review of the water mapping. Trop Ecol. 2002;43:39–47.
and energy sectors and the use of a nexus approach [62] Allbed A, Kumar L, Sinha P. Mapping and modelling spatial
in Abu Dhabi. Int J Environ Res Public Health. 2016;13:364. variation in soil salinity in the Al Hassa Oasis based on remote
[53] Nachtergaele F. Soil taxonomy-a basic system of soil classifi- sensing indicators and regression techniques. Remote Sens.
cation for making and interpreting soil surveys-by Soil Survey 2014;6:1137–57.
Staff, 1999, USDA-NRCS, Agriculture Handbook number 436, [63] Khan NM, Rastoskuev VV, Shalina EV, Sato Y. Mapping
Hardbound. Geoderma. 2001;3:336–7. salt-affected soils using remote sensing indicators-a simple
[54] Shahid S, Abdelfattah M, Arshad K, Muhairbi M, Al Othman Y, approach with the use of GIS IDRISI; 2001.
Al Haji A, et al. Soil survey for the coastline of Abu Dhabi [64] Al-Mhaidib AI. Sabkha soil in the Kingdom of Saudi Arabia:
Emirate. Reconnaiss Surv. 2004;1:2. characteristics and treatment. Arts Humanit. 2003;14:29–82.You can also read