Misokinesia is a sensitivity to seeing others fidget that is prevalent in the general population - Nature
←
→
Page content transcription
If your browser does not render page correctly, please read the page content below
www.nature.com/scientificreports
OPEN Misokinesia is a sensitivity
to seeing others fidget
that is prevalent in the general
population
Sumeet M. Jaswal1, Andreas K. F. De Bleser2 & Todd C. Handy1*
Misokinesia––or the ‘hatred of movements’––is a psychological phenomenon that is defined by a
strong negative affective or emotional response to the sight of someone else’s small and repetitive
movements, such as seeing someone fidget with a hand or foot. Among those who regularly
experience misokinesia sensitivity, there is a growing grass-roots recognition of the challenges that
it presents as evidenced by on-line support groups. Yet surprisingly, scientific research on the topic
is lacking. This article is novel in systematically examining whether misokinesia sensitivity actually
exists in the general population, and if so, whether there is individual variability in the intensity or
extent of what sensitivities are reported. Across three studies that included 4100 participants, we
confirmed the existence of misokinesia sensitivity in both student and non-student populations,
with approximately one-third of our participants self-reporting some degree of sensitivity to seeing
the repetitive, fidgeting behaviors of others as encountered in their daily lives. Moreover, individual
variability in the range and intensity of sensitivities reported suggest that the negative social-affective
impacts associated with misokinesia sensitivities may grow with age. Our findings thus confirm that
a large segment of the general population may have a visual-social sensitivity that has received little
formal recognition.
Misokinesia––or the ‘hatred of movements’––is a psychological phenomenon that is defined as a strong negative
affective or emotional response to the sight of someone else’s small and repetitive movements, such as seeing
someone mindlessly fidgeting with a hand or f oot1. Among those who regularly experience misokinesia, there
is a growing recognition of the challenges that it presents, as evidenced by blossoming on-line support groups.
Yet surprisingly, scientific research on the topic is lacking. In fact, as late as July 15, 2021, a search for the term
“misokinesia” on Web of Science (in all databases) returned no hits, either in the title of a paper or as a listed
topic. Given this literal absence of scientific insight, the goal of our work presented here was to begin building
an empirical foundation for understanding misokinesia and its potential social impacts.
If misokinesia has yet to be the topic of a scientific report, however, it does get an occasional mention in
research articles. In particular, it receives passing recognition as a visual analog to misophonia2. In particular,
misophonia (Greek misos = hatred, phone = sound) is defined as a disorder of decreased tolerance to specific
sound3 and/or aversive emotional responses to human-produced sounds like chewing and lip-smacking4. The
phenomenon, first identified by Johnson in the 1990s initially called “Selective Sound Sensitivity Syndrome”(4S)5,
and was later coined “misophonia” by Jastreboff and Jastreboff6. Within the limited but expanding misophonia
literature, one peer-reviewed study has in fact objectively reported on the prevalence of misokinesia, which was
found to be 11.9% (or 5 patients) out of a 42 patient sample recruited from a hospital website for misophonia
sufferers1. Nevertheless, the sample in this study was small, and it was restricted to a clinical population of
individuals who were actively seeking support for their misophonia. What thus remains unknown is whether
misokinesia sensitivity may be reliably reported in the general population (or populations not actively seeking
treatment for misophonia concerns), and if so, whether there may be individual variability in the intensity or
extent of what misokinesia sensitivities are reported.
As such, our aim in the set of studies reported here was to begin addressing these and related questions. Our
approach involved three empirical steps. We first conducted an initial pilot study to assess whether misokinesia
1
Department of Psychology, University of British Columbia, 3406‑2136 West Mall, Vancouver, BC V6T 1Z4,
Canada. 2Faculty of Psychology and Educational Sciences, Ghent University, Campus DunantDunantlaan 2,
9000 HenriGent, Belgium. *email: todd@psych.ubc.ca
Scientific Reports | (2021) 11:17204 | https://doi.org/10.1038/s41598-021-96430-4 1
Vol.:(0123456789)www.nature.com/scientificreports/
sensitivities would be reliably reported in a large sample of university undergraduates, based on a simple yes/no
answer to a question asking about seeing fidgeting movements in others. Confirming many individuals do report
such sensitivities, we then conducted an initial study again in a university undergraduate sample with three aims
in mind: (1) to establish a basic prevalence rate, (2) to assess potential individual variability in reported impacts
of misokinesia sensitivities, and (3) to determine whether misokinesia sensitivities may be associated with altered
patterns of visual attentional performance. Finally, we then conducted a second study to assess prevalence rates
and individual variability in misokinesia sensitivities in a more general, non-university population. In all three
studies we included assessments of misophonia sensitivities in order to inform on the question of co-morbidity
between misokinesia sensitivity and misophonia sensitivity. The end result is what we believe to be the first in-
depth scientific exploration of what is a surprisingly common human phenomenon––a sensitivity to the visual
presence of others who are fidgeting.
Pilot study
The goal of our initial pilot study was to make an initial assessment of misokinesia sensitivity in a non-clinical
undergraduate population in order to determine whether a more thorough investigation would be justified. A
total of 2751 individuals (ages 17–66; Median = 20, SD = 3.27; 2028 female, 701 male, 3 trans-gender, 19 declined
to identify) were recruited through the Human Subject Pool (HSP) on-line study recruitment portal for students
enrolled in undergraduate courses in the Department of Psychology at the University of British Columbia (UBC).
All participants provided informed consent prior to participation and were reimbursed 0.5 extra course credits.
All protocols were approved by the UBC Behavioural Research Ethics Board, and all methods were performed
in accordance with the relevant guidelines and regulations.
Our pilot study involved administering on an on-line questionnaire that asked two yes/no questions. The first
question was used to assess the prevalence of misokinesia sensitivity in our sample: Do you ever have strong nega-
tive feelings, thoughts, or physical reactions when seeing or viewing other peoples’ fidgeting or repetitive movements
(e.g., seeing someone’s foot shaking, fingers tapping, or gum chewing)? The second question was used to assess the
prevalence of misophonia sensitivity in our sample: Do you ever have strong negative feelings, thoughts, or physi-
cal reactions to specific or repetitive sounds, such as those from the mouth (e.g., hearing someone’s eating, slurping,
chewing, whispering, smacking, gum popping etc.) or other body parts (e.g., hearing someone’s finger snapping, joint
cracking, or foot tapping)?
For the misokinesia sensitivity question, a total of 1053 students (or 38.3%) responded yes, while for the
misophonia sensitivity question, a total of 1406 students (or 51.1%) responded yes. In terms of co-morbidity
rates, a total of 872 students (or 31.7%) reported yes for both questions. In terms of misokinesia sensitivity rates
within each sex, a total of 874 females (or 43.1%) and 173 males (or 24.7%) responded yes to the misokinesia
sensitivity question. In terms of misophonia sensitivity rates within each sex, a total of 1118 females (or 55.1%)
and 280 males (or 39.9%) responded yes to the misophonia sensitivity question.
Taken together, our findings suggest that misokinesia sensitivities do in fact extend to the general popula-
tion (or populations not specifically seeking treatment for misophonia concerns), as more than one-third of our
undergraduate sample reported experiencing some level of misokinesia sensitivity. Moreover, the numerically
higher rate reported for females vs. males, and the reported level of co-morbidity with misophonia sensitivities
parallel rates previously reported in a clinical p opulation1, results which provide a measure of normative validity
for our pair of assessment question. Given these initial confirmatory results, we then designed a study to not just
confirm these initial prevalence rates, but to extend them in two critical ways––by examining individual vari-
ability in the strength and/or extent of reported misokinesia sensitivities in an undergraduate population, and
by investigating whether these sensitivities may be associated with heightened visual-attentional sensitivities.
Study 1
First, in terms of assessing individual variability in misokinesia sensitivities, presently there are no validated
misokinesia assessment instruments. However, the Misophonia Assessment Question (MpAQ) was developed
by Johnson and revised by D ozier7 to appraise the degree to which an individual experiences negative thoughts,
feelings, and emotions regarding misophonic sounds. In Study 1, we thus adapted the MpAQ to ask about visual
rather than auditory issues, thereby creating the Misokinesia Assessment Questionnaire (or MkAQ) to assess the
degree to which an individual experiences negative thoughts, feelings, and emotions regarding misokinesic visual
stimuli. In so doing, this had the additional benefit of allowing for a more direct comparison of misokinesia and
misophonia sensitivities both within and between individuals.
Second, as a visual issue defined by a heightened salience for repetitive or fidgeting-based movements, we
wanted to examine the possible cognitive correlates of misokinesia, or cognitive mechanisms that may contrib-
ute to the condition. In particular, could misokinesia be associated with either an increased inability to ignore
distracting stimuli in the visual periphery, or an increased susceptibility of reflexively orienting visual attention
to peripheral visual events? Given anecdotal reports of misokinesia as a subjectively experienced phenomenon
(e.g., people commonly report a heightened attention to the fidgeting movements of others), either or both of
these possibilities may be plausible. If so, it would suggest that misokinesia may be understood, at least in part,
as an attention-related phenomenon.
Accordingly, Study 1 included two different behavioral assessments of visual attentional performance. One
was a modified distractor interference paradigm, where participants performed a simple target detection task at
fixation while ignoring brief kinetic-based distractors in the visual periphery; this was used to assess the ability
of participants to inhibit peripheral attentional orienting. The other was a traditional reflexive attentional cuing
paradigm, where participants performed a spatially cued target detection task in the visual periphery8; this
was used to assess the magnitude of participants’ peripheral attentional orienting. If misokinesia sensitivity is
Scientific Reports | (2021) 11:17204 | https://doi.org/10.1038/s41598-021-96430-4 2
Vol:.(1234567890)www.nature.com/scientificreports/
associated with altered visual attentional responsivity, it predicted that there should be a correlation between the
degree of misokinesia sensitivity (as indexed by the MkAQ) and performance in these two behavioral attentional
assessments. In other words, individuals that are more bothered by visual distractions in their daily lives were
predicted to show evidence of greater distractor interference and/or stronger orienting responses to peripheral
attentional cues, relative to those not reporting misokinesia sensitivities.
Methods
Participants. A total of 689 individuals were recruited through the UBC HSP on-line study recruitment
portal; this number was based on our recruitment goal of running as many participants as possible during
the fall, 2019 semester at UBC. Data from 39 of these participants were excluded for either leaving the MkAQ
or MpAQ incomplete, or not completing the behavioural task, leaving a final sample of 650 individuals (514
females, 124 males, 2 non-binary, 1 agender, 9 declined to answer; the age range was 18–44, with 594 between
the ages of 18–24, 28 between the ages of 25–34, 4 between the ages of 35–44, and 24 who declined to answer).
All participants provided informed consent prior to participation, self-reported as free of neurological problems,
including no reports of head injuries resulting in loss of consciousness for over 5 min, or stroke, meningitis, and/
or seizures, were fluent in English and had normal range vision (with or without corrective lenses), and received
0.5 extra course credits. Participants completed the tasks in a quiet room with only the researcher present in
order to control for unwanted or environmental conditions (i.e., potential auditory or visual distractors). All
protocols were approved by the UBC Behavioural Research Ethics Board, and all methods were performed in
accordance with the relevant guidelines and regulations.
Procedures. After arriving at the laboratory and giving informed consent, each participant performed two
behavioral tasks, as described below. Following completion of these tasks, they then filled out a set of question-
naires and were debriefed on our study. Total testing time took approximately 0.5 h.
Questionnaires. Participants filled out four online questionnaires in total through Qualtrics: A basic demo-
graphics form, the MkAQ (see Supplementary Fig. S1 online), the MpAQ4, and the State and Trait Anxiety
Inventory9; however, the latter was collected for use in a different study and thus an analysis of those findings
are not included below.
Behavioural tasks. Participants completed a visual detection task that required manual button-press responses.
The behavioural tasks were completed on a computer running Psychopy 3 V3.2.410 which displayed targets
created using the GratingStim function11. Two different attentional assessments were included in Study 1––a
distractor interference task, and a reflexive attentional cuing task. All 650 participants completed both, with
the distractor task always performed first. However, as described below, we employed two different versions of
the attentional cuing tasks, one that used a kinetic-based peripheral visual cue and the other that used a more
canonical “flash” as a visual c ue8. We included this manipulation of cue type to examine whether misokinesia
sensitivities may be associated with a particular sensitivity to kinetic-based visual events; cue-type was manipu-
lated between-subjects, with participants run in the first half of the semester performing the “kinetic” version
of the attentional cuing task, and participants run in the second half of the semester performing the more tra-
ditional "flash" version of the attentional cuing task. For all behavioral tasks, at the beginning of each session,
the participants performed practice trials and were given the opportunity to ask the experimenter any clarifying
questions. Accuracy and speed of response were emphasized equally to the subjects. The viewing distance for all
participants was kept at 57 cm from the centre of the computer screen; actual stimulus sizes and display locations
are reported below for each of the behavioural tasks.
Distractor interference task. This was a target detection task that required making speeded button presses
whenever a target stimulus was presented at fixation; trial sequences and timings are shown in Fig. 1.
Two boxes, one to the left and one to the right of the fixation cross, remained on-screen throughout the trial
block. These peripheral boxes were demarcated by the outlines of 4.28° square boxes and were located 7.68° to
the centre fixation cross (0.74°). The target stimulus consisted of three 0.7° horizontal sine wave grating lines
inside a square box of 2.81°, and was presented at the fixation cross; participants responded to the target onset
with a button-press (spacebar) using their right index finger when the target stimulus appeared. On distractor-
present trials (66.6% of trials), one of the peripheral boxes was briefly “wiggled” just prior to the onset of the
target (i.e., the orientation of the box was briefly rotated by 15° clockwise and then back to its original orienta-
tion, as a kinetic-based visual distraction). On distractor-absent trials (33.3% of trials), the target was presented
without a preceding box “wiggle.” To reduce anticipatory target responses, targets were only presented on half
of the trails, for each trial type. Participants completed four blocks of 36 trials per block (24 distractor-present,
12 distractor-absent), with the distractor-present trials equally split (but randomly varying) between a “wiggle”
of the left vs. right boxes.
Attentional cuing task. This was a target detection task that required making speeded button presses whenever
a target stimulus was presented at a peripheral location either to the left or right of fixation; trial sequences and
timings were adapted from Handy et al.12 and are shown in Figs. 2 and 3. Two boxes, one to the left and one
to the right of the fixation cross, remained on-screen throughout the trial block. Participants responded with
a button-press (spacebar) using their right index finger when the target stimulus appeared on the screen. In
the short-delay condition, the target was presented following a peripheral cue. In the long-delay condition, the
Scientific Reports | (2021) 11:17204 | https://doi.org/10.1038/s41598-021-96430-4 3
Vol.:(0123456789)www.nature.com/scientificreports/
Figure 1. Sequence and timing of stimulus events in the distractor interference task of Study 1. Trial-sequence
for the (A) distractor-present at the left location, and the (B) distractor-absent is shown. ISI = interstimulus
interval. Participants were able to input their response at the final fixation panel. Max response time
allowed = 1000 ms.
Figure 2. Sequence and timing of stimulus events in the attentional cuing task (kinetic cue) in Study. Trial-
sequence for the (A) validly-cued at the left location for the short cue-target delay, and the (B) validly-cued at
the left location for the long cue-target delay is shown. ISI = interstimulus interval. Participants were able to
input their response at the final fixation panel. Max response time allowed = 1000 ms.
Scientific Reports | (2021) 11:17204 | https://doi.org/10.1038/s41598-021-96430-4 4
Vol:.(1234567890)www.nature.com/scientificreports/
Figure 3. Sequence and timing of stimulus events in the attentional cuing task (flash cue) in Study 1. Trial-
sequence for the (A) validly-cued at the left location for the short cue-target delay, and the (B) validly-cued at
the left location for the long cue-target delay is shown. ISI = interstimulus interval. Participants were able to
input their response at the final fixation panel. Max response time allowed = 1000 ms.
peripheral cue was followed by a second (central) cue presented at fixation s ee12. In the version of the task that
used a kinetic-based attentional cue, we employed the same box “wiggle” as described above for the distractor
interference task (Fig. 2); in the version of the task that used a more canonical “flash” as an attentional cue, the
outline of one of the boxes was briefly thickened (Fig. 3).
The central cue was a 0.33° filled white square. On validly-cued trials, the target appeared inside the cued
peripheral box. On invalidly-cued trials, the target appeared inside the uncued peripheral box (or the box on
the opposite side of fixation from the cued box). To reduce anticipatory responses, we also included catch trials,
where a peripheral and central cue were presented, but without a subsequent target. Participants completed four
blocks of 36 trials per block (12 valid, 12 invalid trials, 12 catch trials), with the cued trials equally split (but
randomly varying) between short and long cue-target delays.
Results
Our analyses focused on three a priori issues of interest––confirming a basic prevalence rate for misokinesia
sensitivities in our undergraduate sample, establishing a distribution of individual variability in the strength
or magnitude of misokinesia sensitivity within our sample, and establishing whether misokinesia sensitivity is
associated with altered visual attentional performance, relative to those not reporting misokinesia sensitivities.
Prevalence and variability. Our assessment of prevalence was based on the MkAQ. Mirroring analysis
of the M pAQ4, the MkAQ asks 21 different questions concerning misokinesia-related issues, with each ques-
tion being answered using a rating scale of 0 to 3 to indicate severity/intensity, with a 0 indicating the issue is
experienced “none of the time” and a 3 indicating the issue is experienced “almost all the time.” Given this cod-
ing, summing an individual’s responses gives an index of misokinesia severity, in that a higher sum––or “sum
score”––indicates a greater number of issues experienced and/or a higher severity/intensity of issues. To facili-
tate comparison of the prevalence rates of misokinesia sensitivity and misophonia sensitivity between Study 1
and our pilot study (which based prevalence on a binary-choice question), we then divided participants into two
groups based on their MkAQ and MpAQ sum scores––those with a sum score of 0 or 1 (or reporting no/mini-
mal misokinesia/misophonia sensitivity), and those with a sum score of 2 or more (or reporting non-minimal
misokinesia/misophonia sensitivity).
In terms of misokinesia sensitivity rates, a total of 392 students (or 60.3%) reported a sum score of 2 or more
on the MkAQ, while in terms of misophonia sensitivity rates, a total of 460 students (or 70.8%) reported a sum
score of 2 or more on the MpAQ. In terms of co-morbidity rates, a total of 246 students (or 37.8%) reported a
sum score of 2 or more on both questionnaires. In terms of misokinesia sensitivity rates within each sex, a total
of 320 females (or 62.3%) and 62 males (or 50.0%) reported a sum score of 2 or more on the MkAQ. In terms of
Scientific Reports | (2021) 11:17204 | https://doi.org/10.1038/s41598-021-96430-4 5
Vol.:(0123456789)www.nature.com/scientificreports/
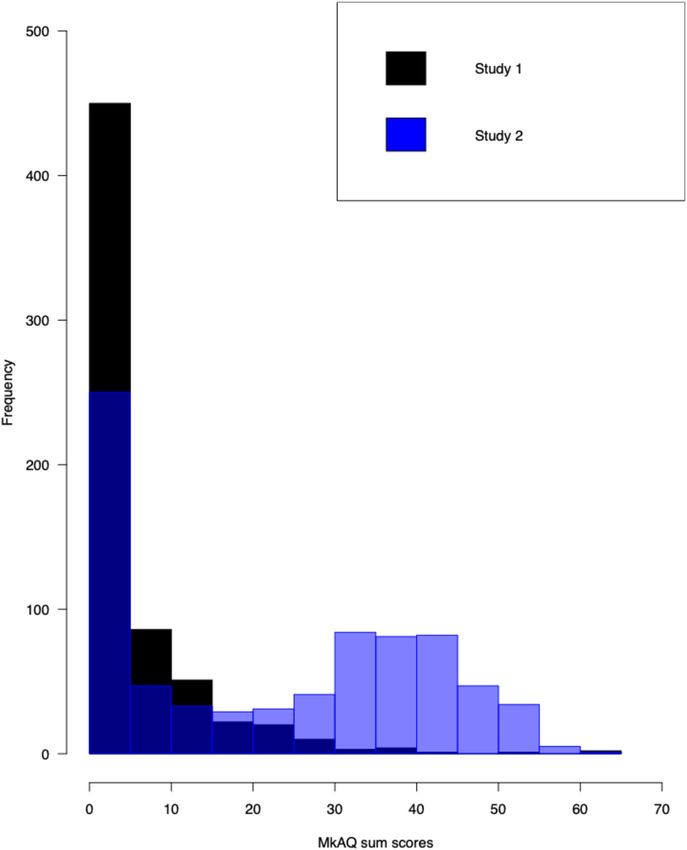
Figure 4. Frequencies of MkAQ sum scores plotted for Study 1 (black) and Study 2 (blue).
misophonia sensitivity rates within each sex, a total of 366 females (or 71.2%) and 83 males (or 66.9%) reported
a sum score of 2 or more on the MpAQ.
To assess individual variability in the strength or magnitude of misokinesia sensitivities, we first plotted
the MkAQ sum scores as a frequency histogram (Fig. 4). As can be seen, scores were positively skewed, with a
majority of participants reporting a sum score of 5 or less. More specifically, 258 participants (or 39.7%) had
a sum score of 0 or 1 (or what was defined above as no/minimal misokinesia sensitivity), 192 participants (or
29.5%) had a sum score of 2–5, and 200 participants (or 30.8%) had a sum score of 6 or higher; these groupings
we then labeled as “no misokinesia sensitivity” (or noM), “low misokinesia sensitivity” (or lowM), and “high
misokinesia sensitivity” (or hiM) for subsequent analyses. For females, 194 (or 37.7%) classified as noM, 156
(or 30.4%) classified as lowM, and 164 (or 31.9%) classified as hiM. For males, 62 (or 50.0%) classified as noM,
31 (or 25.0%) classified as lowM, and 31 (or 25.0%) classified as hiM.
Scientific Reports | (2021) 11:17204 | https://doi.org/10.1038/s41598-021-96430-4 6
Vol:.(1234567890)www.nature.com/scientificreports/
Measure
N Cue condition reaction time (ms) d′ Beta
Distractor-present 243 (41) 3.984 (0.401) 1.348 (0.906)
noM 258
Distractor-absent 282 (48) 3.736 (0.251) 2.053 (0.732)
Distractor-present 244 (45) 3.980 (0.427) 1.256 (0.729)
lowM 192
Distractor-absent 283 (53) 3.725 (0.260) 2.023 (0.791)
Distractor-present 244 (51) 3.926 (0.664) 1.457 (1.059)
hiM 200
Distractor-absent 279 (58) 3.691(0.415) 2.168 (1.001)
Table 1. Mean reaction time, d’ and beta across subjects for the distractor interference task in Study 1, as a
function of cue condition and MkAQ scores (noM = a sum score of 0 or 1 lowM = a sum score of 2–5, hiM = a
sum score of 6 or higher). Total participants (N) in each group. Mean values, with standard deviations in
parentheses.
Cue condition
N Validly-cued RT (ms) Invalidly-cued RT (ms)
Short cue-target delay
noM 66 327 (55) 322 (50)
lowM 52 313 (49) 309 (46)
hiM 50 315 (51) 309 (50)
Long cue-target delay
noM 66 322 (48) 276 (44)
lowM 52 311 (49) 267 (41)
hiM 50 311 (51) 266 (51)
Table 2. Mean reaction time across subjects for the attentional cuing task (kinetic cue) in Study 1, as a
function of cue condition, cue-target delay, and MkAQ scores (noM = a sum score of 0 or 1 lowM = a sum score
of 2–5, hiM = a sum score of 6 or higher). Total participants (N) in each group. Mean values, with standard
deviations in parentheses.
Attentional performance. Our goal in analyzing the performance data was to examine whether atten-
tional performance systematically varies with misokinesia sensitivity. Because the range of MkAQ sum scores
was so positively skewed (Fig. 4), rather than use a correlational approach to performance analyses, we treated
misokinesia sensitivity as a between-group factor based on the classification above––noM, lowM, and hiM––
and interrogated the data using repeated-measures analyses of variance (ANOVAs).
Distractor interference task. All 650 participants completed the distractor interference task. Mean reaction
times (RT) and accuracy data (d’ and beta) are presented in Table 1 as a function of trial type (distractor-present,
distractor-absent) and group (noM, lowM, and hiM). Participants appeared to be faster and more accurate in
responding on distractor-present vs. distractor absent trials, an effect that did not seem to vary as a function of
misokinesia group. We confirmed this pattern via a mixed model ANOVA with within-subject factor of trial
type and between-subject factor of group. Although we found a significant main effect of distractor for RT (F (1,
647) = 1195.42, p < 0.001, ηp2 = 0.65) and d’ (F (1, 647) = 203.11, p < 0.001, ηp2 = 0.24), we failed to show any main
effect of group or a group x trial type interaction for either RT or d’ analyses (both p ≥ 0.27). We had post-hoc
power of 5% for observing our null between groups effect (η2 = 0.001).
Attentional cuing task––kinetic cue. A subset of 191 participants were run in this task; data from 23 participants
were excluded for not completing the questionnaires, the behavioural task, or having a high number of false
alarms (3 or more in either the short- or long-delay condition), resulting in a final sample of 168 participants
(N = 139 females, 22 males, 1 gender, 6 declined to respond; ages 18–34.) Mean RTs are presented in Table 2 as a
function of trial type (validly-cued vs. invalidly-cued), cue-target delay (long or short), and group (noM, lowM,
and hiM). It appeared that responses were faster on invalidly-cued trials compared to validly-cued trials, and
also during long cue-target delay relative to short cue-target delay trials. Both of these effects, however, did not
seem to vary as a function of misokinesia sensitivity groups. We confirmed this data pattern via a mixed model
analyses of variance for RT with within-subject factors of trial type and cue-target delay, and between-subject
factor of group. We found a significant main effect of cue (F (1,165) = 319.08, p < 0.001, ηp2 = 0.66), cue-target
delay (F (1,165) = 91.79, p < 0.001, ηp2 = 0.36), and a significant interaction of cue and cue-target delay conditions
(F (1,165) = 188.92, p < 0.001, ηp2 = 0.53). However, we failed to show any group differences (F (2,165) = 1.36,
p = 0.26). We had post-hoc power of 5% for observing our null between groups effect (η2 = 0.016).
Scientific Reports | (2021) 11:17204 | https://doi.org/10.1038/s41598-021-96430-4 7
Vol.:(0123456789)www.nature.com/scientificreports/
Cue condition
N Validly-cued RT (ms) Invalidly-cued RT (ms)
Short cue-target delay
noM 188 318 (50) 316 (48)
lowM 131 317 (60) 321 (57)
hiM 141 320 (67) 322 (65)
Long cue-target delay
noM 188 317 (52) 267 (50)
lowM 131 321 (55) 275 (58)
hiM 141 322 (67) 275 (65)
Table 3. Mean reaction time across subjects for the attentional cuing task (flash cue) in Study 1, as a function
of cue condition, cue-target delay, and MkAQ scores (noM = a sum score of 0 or 1 lowM = a sum score of 2–5,
hiM = a sum score of 6 or higher). Total participants (N) in each group. Mean values, with standard deviations
in parentheses.
Attentional cuing task––flash cue. A subset of 498 participants were run in this task; data from 38 participants
were excluded for leaving the questionnaires incomplete, not finishing the behavioural task, or having a high
number of false alarms (3 + in either the short- or long-delay condition), resulting in a final sample of 460 par-
ticipants (N = 356 females, 100 males, 1 non-binary, 3 declined to respond; ages 18–44). Mean RTs are presented
in Table 3 as a function of trial type (validly-cued vs. invalidly-cued), cue-target delay (long or short), and group
(noM, lowM, and hiM). Responses appeared to be faster in on invalidly-cued trials compared to validly-cued
trials, and also during long cue-target delay relative to short cue-target delay trials. However, response patterns
did not appear to vary as a function of group. We confirmed this data pattern via a mixed model ANOVA with
within-subject factors of trial type and cue-target delay, and between-subject factor of group. We found signifi-
cant main effect of cue (F (1,457) = 757.59, p < 0.001, ηp2 = 0.62), cue-target delay (F (1,457) = 216.95, p < 0.001,
ηp2 = 0.32), and a significant interaction of cue and cue-target delay conditions (F 1,457) = 694.61, p < 0.001,
ηp2 = 0.60). However, we failed to show any group differences (F 2,457) = 0.25, p = 0.78). We had post-hoc power
of 5% for observing our null between groups effect (η2 = 0.001).
Discussion
Our goals in Study 1 were three-fold. First, we wanted to confirm the general prevalence rate for misokinesia
in a second student-aged sample. In that regard, we found that almost one-third of our participants had a sum
score of 6 or more on the MkAQ, a rate not inconsistent with the 38.3% of participants from our pilot study
who reported yes to the question of whether they had visual sensitivities to fidgeting and like behaviors. While
the MkAQ measure of prevalence does not readily translate into a binary choice measure as used in our pilot
study, together this pair of findings provide empirical support for the conclusion that misokinesia sensitivities
are indeed present––if not widespread––in non-clinically defined populations.
Second, we wanted to perform an initial assessment of individual variability in self-reported misokinesia
sensitivities within a non-clinical population. In examining the frequency distribution of MkAQ sum scores as
shown in Fig. 4, our data indicate that there is clear variability in the extent to which sensitivities are reported
and thus presumably experienced. While in the participants having a sum score of 2 or more there is a strong
positive skew in the frequency distribution (i.e., the majority had sum scores of 15 or less), there were in fact a
number of individuals reporting much more extensive issues and sensitivities. This suggests that misokinesia
sensitivity is not necessarily a binary phenomenon in terms of symptomology, but rather, the impacts experienced
by individuals can widely differ in breadth and/or intensity.
Finally, from a cognitive perspective, we wanted to determine whether misokinesia sensitivity could be
associated with either an increased inability to ignore distracting stimuli in the visual periphery, and/or an
increased susceptibility of reflexively orienting visual attention to peripheral visual events. However, in all three
behavioural tasks we found no evidence to support either possibility. In our distractor interference paradigm,
target responses were actually faster and more accurate on distractor-present trials across all three groups, rela-
tive to distractor absent trials. This suggests that far from distracting attention away from the target’s location at
fixation, the distractor served as a reliable temporal warning cue as to the target’s pending presentation. Likewise,
in both versions of the reflexive attentional orienting paradigm, there were again no between-group differences
observed. While overall attentional cuing effects were absent at the short cue-target delay (i.e., we did not show
behavioral evidence of increased attention at the cued location in the visual periphery), target responses at the
long cue-target delay were significantly faster at the uncued (vs. cued) peripheral location, an effect consistent
with inhibition of return (or IOR;8). IOR is normative at long cue-target delays in reflexive orienting paradigms
e.g.,12, suggesting that both our orienting tasks were in fact influencing reflexive visual attentional mechanisms
at least to some degree. More importantly though, there were again no significant between-group differences
observed. As such, while it may remain to further probe potential attentional correlates of misokinesia sensitivity,
our initial evidence is consistent with the conclusion that reflexive visual attentional mechanisms may not make
substantive contributions to misokinesia sensitivity.
Scientific Reports | (2021) 11:17204 | https://doi.org/10.1038/s41598-021-96430-4 8
Vol:.(1234567890)www.nature.com/scientificreports/
Study 2
While our findings from Study 1 suggest that misokinesia sensitivity is not associated with altered patterns
of attentional performance, we did confirm the original results from our pilot study demonstrating that it is
prevalent in the general population––approximately 1 in 3 participants in our two studies reported some level
of sensitivity. Further, we found that for those experiencing misokinesia sensitivities, there is a high degree of
individual variability in how those sensitivities are manifest or impact their daily lives. Given these conclusions
regarding prevalence, we wanted to conduct a second study with the explicit goal of expanding our assessment
of misokinesia prevalence in the general population, and in particular, expanding it beyond a relatively young,
student-aged sample. More specifically, our aims in this final study were two-fold. First, we wanted to determine
whether our estimate of an approximately 33% prevalence rate for misokinesia would hold in an older, more
demographically diverse sample, and second, we wanted to examine whether individual variability in this sample
would show a similar frequency distribution in reported misokinesia sensitivities as to what we found in Study
1 in our student-age sample.
Methods. We recruited 1007 adults from Amazon Mechanical Turk (MTurk) for the current study; 242 of
these participants failed a set of three separate attention checks included in our study protocol and were not
included in analyses (see Supplementary Table S1 online). This resulted in a final sample of 765 participants
(N = 244 females, 516 males, 3 non-binary, 2 trans gender; age range = 18–93, median = 32 years). Participants
were reimbursed $1.50 USD for their participation. The study was approved by the Behavioural Research Ethics
Board at the University of British Columbia, and all methods were performed in accordance with the relevant
guidelines and regulations. All participants provided informed consent prior to participation. In terms of pro-
cedures, we replicated two aspects of our earlier studies: (1) we asked participants the two questions described
above in our pilot study, to assess whether they had problems related to their misokinesia sensitivity and/or
misophonia sensitivity, and (2) participants completed the four questionnaires (demographics, MkAQ, MpAQ,
State and Trait Anxiety Inventory) described above in Study 2; again, the anxiety measures were used for a sepa-
rate study.
Results. For our misokinesia question, a total of 275 participants (or 35.9%) responded yes, while for our
misophonia question, a total of 325 participants (or 42.5%) responded yes. In terms of co-morbidity rates, a
total of 195 participants (or 25.5%) reported yes for both questions. In terms of misokinesia rates within each
sex, a total of 93 females (or 38.1%) and 182 males (or 35.3%) responded yes to the misokinesia question, while
a total of 169 females (or 69.3%) and 395 males (or 76.6%) reported a sum score of 2 or more on the MkAQ. In
terms of misophonia sensitivity rates within each sex, a total of 120 females (or 49.2%) and 204 males (or 39.5%)
responded yes to the misophonia question, while a total of 188 females (or 77.1%) and 397 males (or 76.9%)
reported a sum score of 2 or more on the MpAQ.
To assess individual variability in the strength or magnitude of misokinesia sensitivities, as per Study 1 we
first plotted the MkAQ sum scores as a frequency histogram (Fig. 4) and subdivided participants into three
groups––noM, lowM, and hiM. As can be seen in Fig. 4, the frequency distribution of MkAQ sum scores showed
a somewhat bimodal distribution. More specifically, 197 participants (or 25.8%) had a sum score of 0 or 1 (noM),
53 participants (or 6.9%) had a sum score of 2–5 (lowM), and 515 participants (or 67.3%) had a sum score of 6 or
higher (hiM). This frequency distribution appeared to differ from the distribution obtained in Study 1 (Fig. 4),
an observation that was confirmed via a two-sample Kolmogorov–Smirnov test (D(650,765) = 0.476, p < 0.001)
using critical values generated via the Real Statistics Resource P ack13.
Discussion
We had two goals in Study 2. First, we wanted to assess the prevalence rate for misokinesia sensitivities in a non-
student, non-clinically-defined population, and we found that approximately one-third (35.9%) of the respond-
ents reported experiencing some level of misokinesia sensitivity in their lives. This percentage is consistent with
the prevalence rate found in our pilot study that also used a binary-choice question for assessing misokinesia
prevalence. If we apply the same measure of prevalence rate as in Study 1––the percentage of participants hav-
ing a sum score of 6 or more––the prevalence rate nearly doubles (67.3%). While we discuss these differences
between measures in our general discussion below, the more central point remains that misokinesia sensitivities
were indeed found to be prevalent in a non-student-based sample from the general population.
Second, we wanted to examine the distribution of misokinesia sensitivities in a non-student, non-clinically
defined sample. In that regard, we found that there was a significant difference between the frequency distribu-
tions from Studies 1 and 2, with the latter showing a more bimodal pattern and higher percentage of participants
falling in the hiM category, relative to the former. Why might this be? Demographically, the MTurk-based
sample in Study 2 was older than our student-aged sample from Study 1, and contained a higher percentage of
male participants. There were also clear differences in the distribution of ethnicities between the two participant
samples, as can be seen in Table 4. Below we discuss how these demographic factors may help to explain the
observed differences in frequency distributions of misokinesia sensitivities.
General discussion
Our findings reported here represent what to the best of our knowledge is the first systematic examination of
misokinesia sensitivity and its prevalence in the general population. Across three studies that collectively sam-
pled over 4100 individuals, we found that approximately one-third self-reported some degree of misokinesia
sensitivity to the repetitive, fidgeting behaviors of others as encountered in their daily lives. These results support
the conclusion that misokinesia sensitivity is not a phenomenon restricted to clinical populations, but rather,
Scientific Reports | (2021) 11:17204 | https://doi.org/10.1038/s41598-021-96430-4 9
Vol.:(0123456789)www.nature.com/scientificreports/
Study 1 Study 2
N % N %
Aboriginal or First Nations 1 0.15 25 3.27
African 8 1.23 82 10.72
East Asian 279 42.92 16 2.09
European (Caucasian) 143 22.00 378 49.41
Hispanic 11 1.69 103 13.46
Middle Eastern 28 4.31 – –
Multi-ethnic 30 4.62 31 4.05
Pacific Islander 1 0.15 – –
Prefer not to answer 22 3.38 – –
South Asian 74 11.38 110 14.38
Southeast Asian 53 8.15 20 2.61
Total 650 765
Table 4. Ethnicity breakdown for Study 1 and Study 2 participants. Total number (N) and percentage (%) of
each ethnicity that participated in Study 1 and Study 2.
is a basic and here-to-fore under-recognized social challenge shared by many in the wider, general population.
But beyond this immediate conclusion, our set of studies inform on several further questions that help to begin
building a deeper scientific understanding of this visual-social sensitivity.
First, is misokinesia sensitivity always co-morbid with misophonia sensitivity? Our findings suggest not.
While co-morbidity rates exceeded 25% in each of our three population samples, we also consistently found
a percentage of individuals reporting misokinesia sensitivities in the absence of any misophonia sensitivities.
And consistent with the original prevalence report of Schröder et al.1 in a small clinical population, we also
consistently found a percentage of individuals reporting misophonia sensitivity but not misokinesia sensitivities.
Taken together, this pattern of co-occurrence between the two phenomena suggests that while they are often
experienced together in an individual, misokinesia itself is not simply a co-morbidity or visual analog of their
misophonia sensitivity; for some individuals the challenge of seeing others fidget is experienced in the absence
of any corresponding auditory-social correlates.
Second, to what extent might misokinesia sensitivities vary across individuals? In this regard, we found that
there was indeed clear variability in the strength and/or extent of misokinesia sensitivities in the populations we
sampled in Studies 1 and 2. When participants were subdivided into groups based on MkAQ scores, we noted
that in Study 1 approximately one-third of the participants were categorized as having no misokinesia sensitivity,
one-third had low sensitivity, and one-third had high sensitivity. In contrast, when we subdivided the participants
from Study 2 using the same trichotomous groupings, there was an apparent shift in the pattern of variability:
one-fourth of the participants in this population were categorized as having no sensitivities, 7% were categorized
as having low sensitivity, and the largest subgroup—approximately two-thirds of the participants—were catego-
rized as having a high level of misokinesia sensitivity. In other words, a larger proportion of participants in Study
2 demonstrated high misokinesia sensitivities, relative to the participants in Study 1. One possibility is that this
difference in variability between our two studies could simply reflect an issue of sampling noise. However, given
that the sample in Study 2 had an older mean age, and significantly higher percentages of males and Caucasians
relative to Study 1, another possibility for future study is that the intensity of how misokinesia is experienced
may in fact vary with core demographic factors such as age, sex, and/or ethnicity. Regardless though, our data
indicate that misokinesia sensitivity is not experienced as a binary phenomenon, but rather, there is in fact wide
variability in the range of sensitivities individuals experience.
Finally, towards understanding the underlying basis for misokinesia sensitivity, might it be associated with
heightened visual-attentional sensitivities? Despite the well-powered behavioral experiments we ran in Study 1,
our findings showed no systematic support for this possibility. In particular, we found that misokinesia sensitivi-
ties were not associated with either an increased inability to ignore distracting events in the visual periphery,
nor an increased susceptibility of reflexively orienting visual attention to sudden events in the visual periphery.
While it is always critical to interpret such null results with care, they do begin to help frame basic cognitive
questions about the phenomenon. For instance, misokinesia sensitivity could in fact be associated with altered
visual-attentional function, but either (1) the paradigms used in our study were not valid assessments of these
attentional correlates, or (2) individuals with misokinesia sensitivities may be well-practiced at controlling visual
attention in a top-down manner as a compensatory strategy for mitigating their discomfort, strategies that could
mask attentional correlates of the condition. On the other hand, given that misophonia has been strongly associ-
ated with altered affective reactivity to trigger s ounds14, it could also be the case that misokinesia sensitivity does
not involve altered attentional functioning, and instead, it too may be more tied to heightened affective reactivity
to visual triggers. These now become important questions to begin pursuing if we are to build a neurocognitive
understanding of the phenomenon.
Limitations. In closing, there are also a number of important limitations to consider regarding our studies
and their findings. The first concerns the actual questions we used to assess misokinesia sensitivity. In our initial
Scientific Reports | (2021) 11:17204 | https://doi.org/10.1038/s41598-021-96430-4 10
Vol:.(1234567890)www.nature.com/scientificreports/
Pilot Study we used a simple yes/no question to divide our sample into two groups––those with versus without
some level of misokinesia sensitivity. Our intention in so doing was not to definitively inform on misokinesia
or misophonia prevalence. Rather, it was to make an initial, coarse assessment of misokinesia sensitivity using
a deliberately liberal criteria in order to determine if a more in-depth investigation might be warranted. That
we found a larger proportion of our undergraduate participants reported a misophonia sensitivity in our Pilot
Study (51.1%) relative to what has been reported in previous clinically-oriented studies of misophonia using
more stringent criteria, such as Wu et al.14 (20%), Zhou et al.15 (6%), and Naylor et al.16 (37%) is thus not surpris-
ing. As such, while we believe our Pilot Study findings are informative and important to report for thorough
documenting of our investigation, we stress that this initial assessment was never designed to provide a definitive
prevalence rate for either misokinesia or misophonia in non-clinically defined populations.
Likewise, for Studies 1 and 2 we had no validated misokinesia measure or questionnaire we could rely on
in order to make a more fine-grained assessment of misokinesia sensitivities. As such, we chose to adapt the
unvalidated MpAQ to develop MkAQ because it was both a straight-forward process to translate the auditory-
focused MpAQ to the visual-focused MkAQ, and using a visual analog to the MpAQ would facilitate a direct
comparison of misokinesia and misophonia sensitivities within the same individual. Nevertheless, the MkAQ
emphasized social/clinical impacts rather than providing a clear accounting of the more immediate, subjec-
tive effects of misokinesia sensitivity. More specifically, the questions in the MpAQ––on which the MkAQ was
based––focus on the emotional impacts of misophonia and address possible social problems that can arise for
those who experience the phenomenon. As the MpAQ was designed based on clinical interviews conducted by
an audiologist17, it is possible that merely adapting the questionnaire for studying misokinesia sensitivity did
not capture actual misokinesia symptoms as they occur when in the presence of a visual trigger. The MkAQ,
thus, does not measure subjective experiences of triggers, responses, or coping mechanisms, and this could
again help to explain our null attentional performance results. Namely, if misokinesia sensitivity is predicated
on visual-emotional symptoms when dealing with an actual trigger stimulus rather than the social-emotional
impacts of having to manage possible exposures to trigger stimuli (as captured by the MkAQ), it could reveal
possible between-group differences in attentional performance that are obscured when grouping is based on
social-emotional impacts as per Study 1. Taken all together, this highlights the need to consider refining and
validating measures of both misokinesia and misophonia sensitivities as a logical next research step.
Second, it is also important to note that the key stimulus used in our attentional paradigm—the kinetic move-
ment of the peripheral boxes—may not have been an effective distractor/cue, for individuals with misokinesia
sensitivity. That is, the kinetic movement of the peripheral boxes may not have been a valid proxy for human
fidgeting, or the kinds of stimuli that are visual triggers in misokinesia sensitivity. This possibility is certainly
consistent with what is known about the nature of processing within visual cortex. The so-called ventral visual
stream that underpins visual object processing bifurcates into areas that respond to animate vs. inanimate objects
e.g.,18, and numerous neuroimaging studies have confirmed that while ventrolateral visual brain regions are
activated by animate objects, it is more ventromedial regions that are activated by inanimate objects. This func-
tional dissociation raises the question of whether misokinesia sensitivity could be specifically associated with
altered attentional sensitivity to either animate objects in general, or perhaps even more selectively, to human
movements exclusively. For example, if our mirror neuron systems are activated when seeing the behaviors of
others23, this would explain not just why misokinesia sensitivities could be exclusive to human movement, but
given that fidgeting is associated with psychomotor agitation and a nxiety24–26, it could also explain the aversive
responses to seeing such movements in others, as it may induce these negative states in the observer. These now
become important open questions to explore.
Third, we note that the prevalence rate for misophonia sensitivity that we report in Study 1 is potentially high
in comparison to prior studies of misophonia sensitivity in undergraduate populations. We suggest that one
critical factor may be the demographic profile of the undergraduate samples between studies. For example, in
Wu et al.14 only ~ 4% of their undergraduate sample was classified as Asian, whereas in our sample we had > 50%
east Asian and south Asian participants. However, a second critical factor would be the actual criteria used for
assessing misophonia sensitivity, as our use (and cutoffs) of the MAQ may not have good convergence with
approaches used for assessment in other studies, which is another critical limitation. Nevertheless, we again note
that the primary goal of our study was not to study misophonia sensitivity, but rather, to establish that misokinesia
sensitivity is a common experience that appears to be prevalent in the general population. That our findings raise
vital questions for future research, such as whether social-perceptual sensitivities may vary with individual factors
such as race, ethnicity, cultural background, gender, and sex, speaks to the importance of continuing such work.
Conclusion. Despite the open questions and limitations outlined above, our data firmly establish that
misokinesia sensitivity is indeed prevalent in the more general (non-clinically-defined) population, and that
many people may be experiencing negative social-emotional impacts from something that has received little
formal recognition. Moreover, as our findings suggest, the scope and intensity of these negative social-affec-
tive impacts may in fact increase with age. Yet while our findings highlight a number of pressing questions to
address going forward, the end result here is that we have confirmed something long under-appreciated about
the human condition––we don’t just frequently fidget as a species, but as well, many of us are challenged by being
in the visual presence of others who are doing so.
Received: 14 February 2021; Accepted: 10 August 2021
Scientific Reports | (2021) 11:17204 | https://doi.org/10.1038/s41598-021-96430-4 11
Vol.:(0123456789)www.nature.com/scientificreports/
References
1. Schröder, A., Vulink, N. & Denys, D. Misophonia: Diagnostic criteria for a new psychiatric disorder. PLoS ONE 8, e54706 (2013).
2. Brout, J. J. et al. Investigating misophonia: A review of the empirical literature, clinical implications, and a research agenda. Front.
Neurosci. 12, 36 (2018).
3. NewsRX, L. A Consensus definition of misophonia: Using a Delphi process to reach expert agreement. Health Med. Week 311
(2021).
4. Dozier, T. H. Etiology, composition, development and maintenance of misophonia: A conditioned aversive reflex disorder. Psychol.
Thought 8, 114–129 (2015).
5. Bernstein, R. E., Angell, K. L. & Dehle, C. M. A brief course of cognitive behavioural therapy for the treatment of misophonia: a
case example. Cogn. Behav. Therap. 6, e10 (2013).
6. Jastreboff & Jastreboff. Decreased sound tolerance and tinnitus retraining therapy (TRT). Aust. N. Z. J. Audiol. 24, 74–84 (2002).
7. Dozier, T. H. Counterconditioning treatment for misophonia. Clin. Case Stud. 14, 374–387 (2015).
8. Posner, M. I. & Cohen, Y. Components of visual orienting. in Attention and performance X: Control of Language Processes 531–556
(Hillside, NJ: Erlbaum, 1984).
9. Spielberger, C., Gorsuch, R., Lushene, R., Vagg, P. & Jacobs, G. Manual for the State-Trait Anxiety Inventory (Form Y1–Y2). vol. IV
(1983).
10. Peirce, J. et al. PsychoPy2: Experiments in behavior made easy. Behav. Res. 51, 195–203 (2019).
11. Beyeler, M. Visual stimulus toolbox. Zenodo https://doi.org/10.5281/zenodo.154061 (2016).
12. Handy, T. C., Jha, A. P. & Mangun, G. R. Promoting novelty in vision: Inhibition of return modulates perceptual-level processing.
Psychol. Sci. 10, 157–161 (1999).
13. Zaiontz, C. Real Statistics Using Excel. https://www.real-statistics.com (2020).
14. Wu, M. S., Lewin, A. B., Murphy, T. K. & Storch, E. A. Misophonia: Incidence, phenomenology, and clinical correlates in an
undergraduate student sample: Misophonia. J. Clin. Psychol. 70, 994–1007 (2014).
15. Zhou, X., Wu, M. S. & Storch, E. A. Misophonia symptoms among Chinese university students: Incidence, associated impairment,
and clinical correlates. J. Obses. Compuls. Relat. Disorders 14, 7–12 (2017).
16. Naylor, J., Caimino, C., Scutt, P., Hoare, D. J. & Baguley, D. M. The prevalence and severity of misophonia in a UK undergraduate
medical student population and validation of the Amsterdam misophonia scale. Psychiatr. Q. 92, 609–619 (2020).
17. Johnson, M. 50 cases of misophonia using the MMP. Atlanta, GA: Paper presented at the misophonia conference of the Tinnitus
Practitioners Association (2014).
18. Kriegeskorte, N. et al. Matching categorical object representations in inferior temporal cortex of man and monkey. Neuron 60,
1126–1141 (2008).
19. Chao, L. L. Experience-dependent modulation of category-related cortical activity. Cereb. Cortex 12, 545–551 (2002).
20. Chao, L. L., Haxby, J. V. & Martin, A. Attribute-based neural substrates in temporal cortex for perceiving and knowing about
objects. Nat. Neurosci. 2, 913–919 (1999).
21. Downing, P. E., Chan, A.W.-Y., Peelen, M. V., Dodds, C. M. & Kanwisher, N. Domain specificity in visual cortex. Cereb. Cortex 16,
1453–1461 (2006).
22. Mahon, B. Z. et al. Action-related properties shape object representations in the ventral stream. Neuron 55, 507–520 (2007).
23. Rizzolatti, G. & Craighero, L. The mirror-neuron system. Annu. Rev. Neurosci. 27, 169–192 (2004).
24. Budnick, C. J., Kowal, M. & Santuzzi, A. M. Social anxiety and the ironic effects of positive interviewer feedback. Anxiety Stress
Coping 28, 71–87 (2015).
25. Okazaki, S., Liu, J. F., Longworth, S. L. & Minn, J. Y. Asian American-White American differences in expressions of social anxiety:
A replication and extension. Cultur. Divers. Ethnic Minor. Psychol. 8, 234–247 (2002).
26. Schlenker, B. R. & Leary, M. R. Social anxiety and self-presentation: A conceptualization and model. Psychol. Bull. 92, 641–669
(1982).
Author contributions
S.M.J. and T.C.H. conceived and designed the study, and interpreted the data; S.M.J. and A.D.B. acquired and
analyzed the data.
Competing interests
The authors declare no competing interests.
Additional information
Supplementary Information The online version contains supplementary material available at https://doi.org/
10.1038/s41598-021-96430-4.
Correspondence and requests for materials should be addressed to T.C.H.
Reprints and permissions information is available at www.nature.com/reprints.
Publisher’s note Springer Nature remains neutral with regard to jurisdictional claims in published maps and
institutional affiliations.
Open Access This article is licensed under a Creative Commons Attribution 4.0 International
License, which permits use, sharing, adaptation, distribution and reproduction in any medium or
format, as long as you give appropriate credit to the original author(s) and the source, provide a link to the
Creative Commons licence, and indicate if changes were made. The images or other third party material in this
article are included in the article’s Creative Commons licence, unless indicated otherwise in a credit line to the
material. If material is not included in the article’s Creative Commons licence and your intended use is not
permitted by statutory regulation or exceeds the permitted use, you will need to obtain permission directly from
the copyright holder. To view a copy of this licence, visit http://creativecommons.org/licenses/by/4.0/.
© The Author(s) 2021
Scientific Reports | (2021) 11:17204 | https://doi.org/10.1038/s41598-021-96430-4 12
Vol:.(1234567890)You can also read