The Effects of Digital Concept Cartoons and Digital Concept Maps on Eliminating Middle School Students' Misconceptions in the Mathematics Course: ...
←
→
Page content transcription
If your browser does not render page correctly, please read the page content below
Informatics in Education, 2021, Vol. 20, No. 2, 205–229 205
© 2021 Vilnius University, ETH Zürich
DOI: 10.15388/infedu.2021.10

The Effects of Digital Concept Cartoons and
Digital Concept Maps on Eliminating Middle
School Students’ Misconceptions in the
Mathematics Course: An Experimental Research

Burcin GOKKURT-OZDEMIR, Hatice YILDIZ-DURAK,
Fatma Gizem KARAOGLAN-YILMAZ, Ramazan YILMAZ
Faculty of Education, Department of Mathematics and Science Education, Bartin University, Turkey
Faculty of Science, Department of Computer Technology and Information Systems
 Bartin University, Turkey
e-mail: gokkurtburcin@gmail.com, hatyil05@gmail.com, gkaraoglanyilmaz@gmail.com,
yilmaz04@gmail.com

Received: April 2020

Abstract. The purpose of this study was to investigate the effect of digital concept cartoons
and maps in eliminating misconceptions of secondary school students. The research was con-
ducted with 67 students who were studying at three different branches of 7th grade of secondary
school. The research was conducted according to semi-experimental design with pre-test, post-
test control group, and quantitative and qualitative research methods (mixed pattern) were used
together. Accordingly, the mathematics classes in the Study Group I were conducted by the DCC
method and the mathematics courses in the Study Group II were conducted by the DCM, and
the mathematics courses in the control group were processed by traditional teaching method. In
order to determine the students’ misconceptions before and after the experiment, Misconception
Test was used which was applied as Pre-test and Post-test. In addition, students’ opinions and
observation processes related to the use of DCC and DCM in mathematics class were included
in the experimental process. As a result of the data analysis, there was no statistically signifi-
cant difference between Study Group I, Study Group II and control group when the results of
the Misconception test of the control and study groups were compared. In addition, students
stated that the use of DCC and DCM in mathematics course have advantages such as making
the courses enjoyable, drawing attention, increasing interest in the course, and visualizing the
course topics. In the direction of the findings obtained from the research, various suggestions
were made to the teachers and researchers about the use of DCC and DCM in secondary school
mathematics courses.
Keywords: digital concept cartoon, digital concept maps, mathematics teaching, misconceptions,
secondary school students.
206 B. Gokkurt-Ozdemir et al.

1. Introduction

Concepts in mathematics are very basic components of the teaching and learning pro-
cesses (Zaslavsky & Shir, 2005). Concepts play an important role in the process of
teaching mathematics. Because concepts provide systematic classification of informa-
tion (Arnaodin & Mintzes, 1985). In mathematics class, it may be difficult to define a
concept. To define a concept, it is sometimes necessary to explain the concepts associ-
ated with it. For example, in order to define the concept of function, it is necessary to
explain the relation concept first. Therefore, in mathematics education, it is expected
that the student should be able to build new knowledge on the previous ones. Therefore,
it is expected that concepts in mathematics education will facilitate the student’s ability
to build new information on the previous ones (Ersoy, 2006). For this reason, students
may make mistakes and these mistakes may eventually turn into misconceptions.
 It can be said that one of the important factors preventing students’ conceptual learn-
ing is misconceptions (Yenilmez & Yaşa, 2008). The misconception is defined differ-
ently by researchers in the literature. Hashweh (1988) defined misconception as imma-
ture concepts. Smith, Disessa, and Roschelle (1993) have described the misconception
as a “student perception that produces systematic mistakes”. The misconceptions are
based on the experiences of each student in the past. Therefore, each student’s different
experiences in his or her own past can lead to different misconceptions (Yenilmez &
Yaşa, 2008). Gokkurt Ozdemir, Bayraktar and Yılmaz (2017) stated that the majority of
teachers are confused about the misconceptions and the reasons for it. However, it can
be said that it is important for the teacher to be aware of these misconceptions and to be
able to analyze them well (Zembat, 2008).
 When the literature is examined, it is generally seen that studies have been done to
determine the misconception (Akkaya & Durmuş, 2006; Bilgin & Akbayır, 2002; Küçük
& Demir, 2009; Pesen, 2007, 2008; Şandır, Ubuz, & Argün, 2007). Akkaya and Durmuş
(2006) revealed that students did not conceptualize the role of the letters in algebra.
Pesen (2008) stated that students’ learning difficulties in pointing the fractions on num-
ber line and to find out the misconceptions lying behind common mistakes. Similarly,
Şandır et. al (2007) revealed that students made many errors in arithmetic operations, in
using distributive laws, and in solving equation and inequalities. Adıgüzel et. al. (2018)
examined thematically the theses from 2007 to 2017 conducted in Turkey about miscon-
ceptions in mathematics education. In this study, it was observed that students had the
misconception in each learning area at the secondary school level.
 When the study by Adıgüzel et al. (2018) is examined, it is seen that the misconception
is mostly in the area of learning numbers and operations. When the content of these stud-
ies is examined, almost all of the studies are focused on determining the misconception.
Türkdoğan, Güler, Bülbül and Danışman (2015), emphasized that the majority of the stud-
ies related to misconceptions were focused on the detection of misconceptions and there
are limited number of studies focused on removing misconceptions. On the other hand,
when studies abroad are examined, it is possible to come up with several studies about
the reduction of misconceptions in mathematics education (Karaoglan Yilmaz, Gokkurt
Ozdemir & Yasar, 2018; Prescott & Mitchelmore, 2005; Swedosh & Clark, 1997).
The Effects of Digital Concept Cartoons and Digital Concept Maps on ... 207

 Reduction of misconceptions is important for effective mathematics teaching. Be-
cause Hewson and Hewson (1984) found that misconceptions affect students’ learning
negatively. For this reason, it can be said that the teaching strategies that the teachers
will use in the learning environments and present to the students and the materials they
developed to reduce the misconceptions are important. These materials should enable
the students to actively participate in the learning process and to express their ideas eas-
ily. There are many teaching materials that serve this purpose, including concept maps
and concept cartoons (Gokkurt Ozdemir, 2019). Some techniques are used to reveal
those misconceptions. One of the alternative techniques used by teachers is concept
cartoons (Naylor & Keogh, 2013). Another tool that is used to reveal what the students
know and how their understanding changed in time is, the concept map (Novak, Gowin,
& Johansen, 1983). Concept maps need to be rationally integrated to teaching as an
effective method for formative assessment and need to be suitable for teachers to use
(Hartmeyer, Stevenson, & Bentsen, 2018).

1.1. The Role of Concept Maps in Reducing Misconceptions
in the Mathematics Course

Concept maps were first introduced by Joseph Novak in the light of Ausubel’s cogni-
tive learning theory. Concept maps are based on expressing the relationships between
concepts in a graphical way, allowing students to learn concepts in a meaningful way.
Concept maps help students to correct their misunderstandings by enabling them to re-
late to concepts they already learned. For this reason, it is one of the preferred materials
in reducing misconceptions (Ayvacı & Devecioğlu, 2002). Anderson-Inman and Ditson
(1999) stated that concept maps have many advantages for students. These advantages
are: i) provide students with permanent learning, ii) help students with learning difficul-
ties, iii) allow students to perceive complex structures as a whole, iv) enable teacher to
observe students’ information about a subject and to identify which student has more
difficulty, v) provide the comprehension of the concepts by giving them the opportunity
to construct meanings, and vi) have effect on tracking of the student’s development from
the student file.
 Concept maps have been a frequently used teaching material in researches of science
education (Kwon & Cifuentes, 2009). Whereas Baki and Mandacı-Şahin (2004) stated
that digital concept mapping method can be used as an effective assessment tool in math-
ematics lessons. Similarly, Kaya (2019) determined that the use of the concept map in
the teaching of rational numbers of 7th grade students has a positive effect on students’
academic success. Mathematics has a cumulative and spiral structure (Ersoy, 2006),
it requires students to understand the relationships between concepts. For example, if
the student does not understand the relationship between the concepts of square and
rectangle, he or she may misunderstand the definitions of other mathematical concepts
such as parallelograms, trapezoids, and misrepresent the hierarchy between them. For
this reason, concept maps can be used as an effective teaching material in mathematics
courses by showing the relationship between concepts graphically.
208 B. Gokkurt-Ozdemir et al.

1.2. The Role of Concept Cartoons in Reducing Misconceptions
in the Mathematics Course

The other material that is thought to be effective in reducing the misconceptions is con-
cept cartoon. Concept cartoons can be defined as “the image of the debate that three or
more characters make” (Naylor & McMurdo, 1990 as cited in Şengül, 2011). In this
discussion, only one of the ideas presented is of scientific acceptance, while the others
represent scientifically incorrect ideas (Keogh, Naylor, & Wilson, 1998). The purpose of
concept cartoons is to create a discussion environment among students about a concept,
situation or event (Uğurel & Moralı, 2006).
 According to Dabell (2004), concept cartoons have many characteristics. These are:
It i) reveals the readiness levels and ideas of the students. ii) Provides a critical ap-
proach to thoughts iii) Develops alternative viewpoints and increases motivation. iv)
Encourages students as they can defend their ideas over characters. v) Creates a discus-
sion environment. vi) Allows students to self-criticize. vii) helps students to generate
new ideas. Viii) enables students to overcome the misconceptions. Concept cartoons in
science course are frequently used to allow students to question their own and friends’
knowledge and to encourage them to discuss their thoughts in the process and solve
problems by using scientific process skills (Duban, 2013; Erdoğan & Özsevgeç, 2012;
Kaptan & İzgi, 2014; Tokcan & Alkan, 2013; Uzoğlu et al., 2013). In mathematics
course, conceptual cartoons can be used to determine misconceptions, to develop math-
ematical thinking and to create brainstorming and discussion environments (Sexton,
Gervasoni, & Brandenburg, 2009; Uğurel & Moralı, 2006; Uğurel, Kesgin, & Karahan,
2013). Yılmaz (2018) was found that the students’ mathematics success in the experi-
mental group, in which 5E model with concept cartoons was used, was higher at .05
significance level than the students’ mathematics success in control group, in which
current curriculum was used.

1.3. Importance of the Study

Taking these features into consideration, it is thought that the use of both concept car-
toons and concept maps in mathematics courses as well as in science courses will allow
students to learn mathematical concepts and reduce existing misconceptions. In par-
ticular, Digital Concept Maps (DCM) and Digital Concept Cartoons (DCC), which can
be prepared with the support of Computer Assisted Instruction (CAI) method which is
a more interesting teaching method that attracts the attention of the students, can be
effectively used in mathematics courses. For this purpose, concept maps and concept
cartoons, which are prepared in an electronic environment, were used in the research
to reduce the misconceptions in the learning areas (“Numbers and Operations”, “Al-
gebra”) in which students have misconceptions in mathematics courses. As reasons of
the selection of these two areas of learning, it can be shown that the existence of the
most misconceptions of the students in these two learning areas. Adıgüzel et.al.. (2018)
The Effects of Digital Concept Cartoons and Digital Concept Maps on ... 209

found that secondary school students had the most misconceptions in learning areas
of the number and operations. In addition, the fact that “Numbers and Operations”
learning area includes the large part of the “Mathematics Teaching Curriculum of the
Secondary School” can be shown as one of the reasons for studying this learning area.
The “algebra” learning area is also at the center of mathematics learning, since it is
associated with many topics of mathematics (Lacampagne, 1995). The language of pat-
terns, symbols, and rules, algebra is among important learning fields of mathematics.
That algebra makes itself felt in any area of life makes it obligatory to learn algebra
(Williams & Molina, 1997). However; algebra is a course that students have difficulty
understanding (Carraher, Schliemann, Brizuela, & Earnest, 2006).
 The positive effect of technology on teaching and learning processes related to
mathematics a reduction of misconception of students related to mathematics with ma-
terials prepared in electronic environment are reasons for using DCM and DCC in
research (Karaoglan Yilmaz et al., 2018). Evrekli and Balım (2015) found that the post-
test scores of the students in the experiment group using animation-supported concept
cartoons were significantly higher than those of the pre-test scores in their studies using
animation-supported concept cartoons and only concept cartoons. It can be considered
that concept maps or concept cartoons become more complex with computer support
during the interpretation and comprehension of the subject or concepts to be taught for
the students (Baki & Mandacı-Şahin, 2004). Similarly, it is difficult to design concept
cartoons on paper. The purpose of DCMs is to help to teach relationships between
concepts by effective videos, pictures, slides, adding notes, bridges between concept
map to concept map, voice recordings, web link bridge (Chang, Sung, & Chen, 2001).
DCMs offer many advantages such as adaptive and easy content structure, dynamic
links, digital communication and digital recording. Rautama (2000) stated that DCMs
have many benefits, such as being able to be recorded, printed and changed, make very
large concept maps, combine, zoom in and out, and encourage research (as cited in Baki
& Mandacı-Sahin, 2004). Akkuş (2013) proved that DCMs are more effective than
classical concept maps and have more permanent results for reducing misconceptions.
In this context, the facts that DCC and DCM are selected as teaching tools in mathemat-
ics courses and used in solving the misconceptions of students reveals the importance
of this study.

1.4. Aim of the Study

The aim of this research is to determine the effect of the use of DCC and DCM in the
reduction of misconceptions in the learning area of Numbers and Operations and Alge-
bra in the mathematics course of seventh grade students of secondary school. For this
purpose, answers for the following questions were sought:
 a) Is there a statistically significant difference between the scores of misconceptions
 tests of the control and study groups using traditional teaching methods and DCC,
 DCM?
 b) What are the opinions of students on the use of DCC and DCM in the course?
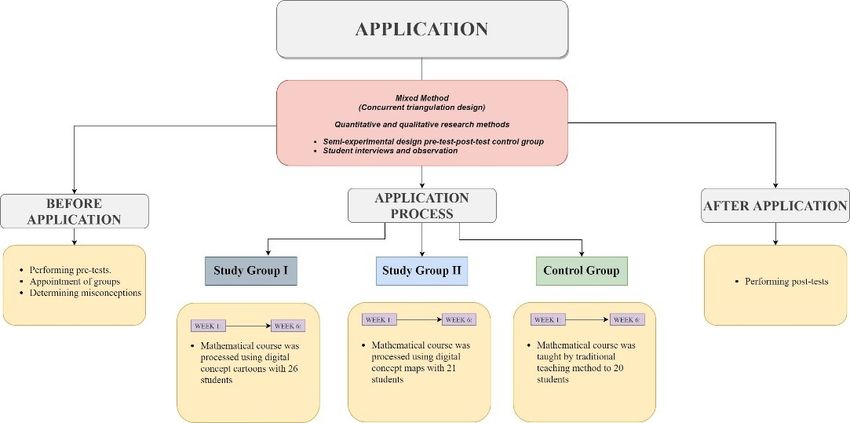
210 B. Gokkurt-Ozdemir et al.

2. Method

2.1. Research Model and Study Group

In this research, quantitative and qualitative research methods (mixed pattern) were
used together. Concurrent triangulation design was preferred from mixed methods.
In this research, this pattern was used to determine the views of 7th grade students
about DCM and DCC. According to Creswell and Clark (2008), this pattern is a mixed
method pattern in which quantitative and qualitative data related to the same phenom-
enon are collected and analyzed simultaneously, and the results are integrated and in-
terpreted (See Fig. 1).
 Semi-experimental design was used with pre-test-post-test control group in the quan-
titative dimension, whereas in the qualitative dimension student interviews and obser-
vation processes were used. The study group consists of 67 students who took a math-
ematics course in the seventh grade of a secondary school in the spring semester of the
2016–2017 academic year. Schools where the research was conducted were accepted as
socio-economic intermediate level. The distribution of students according to gender and
success level in the branches is done by the school administration independently from the
research. There are three branches in the seventh grade of the secondary school, where
there are 26, 21 and 20 students, respectively. Match-up between branches and study
group was determined by random assignment. In the Study group I, mathematical course
were processed using digital concept cartoons with 26 students, digital concept maps
were used in the Study group II with 21 students, and in the Control group the course
was taught by traditional teaching method to 20 students. In the study, the actual names
of the participants were kept confidential and the codes were assigned to Study Group I
as S1, ... S26, to Study Group II as S27 ... S47 and to Control Group as S48, ... S67.

 Fig. 1. Research Model.
The Effects of Digital Concept Cartoons and Digital Concept Maps on ... 211

2.2. Data Collection Tools

Misconception Test: In this study, the “Misconception Test” was applied to the students
in the study group at the stage of determining misconceptions they had. In the develop-
ment of this test, a pool of questions was created by the researchers in order to determine
the students’ misconceptions about the two learning areas (numbers and operations, al-
gebra). In the preparation of the questions, only the success related to these two learning
areas are considered in the secondary school mathematics curriculum. Because, before
the application was done, it was determined that the students had the most misconcep-
tions in these two learning areas by taking into consideration the examination documents
of the students and the observation results of the course teacher. For the validity of the
study, the opinions of a specialist faculty member in the field of mathematics education
and the current mathematics teacher of students were taken. In the direction of expert
opinions, the “Misconception Test (MT)” consisting of 60 items has been developed by
combining the misconceptions of these two learning areas in the literature and the obser-
vations of the mathematics teacher. Due to the high amount of items in the test, MT was
applied in 3 class hours to be asked 20 items in one class hour. Prior to the application
of MT, the students were informed and explained about this test and sufficient time was
given to the students. Examples of questions related to these two learning areas in the
MT are presented in Appendix-1.
 During the application process, 10 to 15 minutes of informal interviews were con-
ducted by researchers about the answers students gave to the questions in order to clarify
students misconceptions or faults. After detecting the misconceptions, digital concept
cartoons and concept maps for these misconceptions were prepared. The process of pre-
paring these materials is detailed below.
 While success tests were prepared to detect misconceptions, in the first stage, the
studies determining the misconceptions in the field of Numbers and Operations and Al-
gebra learning were examined in detail. In addition, unstructured interviews were held
with six secondary school mathematics teachers and information about the mistakes
their students made in these learning areas in their classrooms was obtained. In the
second stage, the Ministry of National Education [MoNE] (2019) in the Middle School
Mathematics Curriculum has gained outcomes for both validity areas. The misconcep-
tions in the literature related to these achievements in the third stage (Adıgüzel et al,
2018; Akkaya & Durmuş, 2006; Kaya, 2015; Pesen, 2007, 2008; Soylu & Soylu, 2005;
Şandır et al., 2007; Yenilmez & Avcu, 2008; Zembat, 2008) question pools were created
for success tests. Achievement tests for the reliability of the research were prepared
by the researcher who gave undergraduate courses on misconceptions in mathematics
education and had publications on the detection and elimination of misconceptions. The
success tests prepared were presented to the opinions of the teachers who conduct the
mathematics classes of the classes to be applied and a faculty member who is expert
in the misconceptions. In accordance with the opinions of the teachers, the number of
questions in the achievement tests has been reduced to 20 on the grounds that the imple-
mentation period will not be sufficient. In line with the opinions of the experts, in order
to reveal the misconceptions clearly, under each item of the success tests prepared as
212 B. Gokkurt-Ozdemir et al.

multiple choice, “Why did you mark this option? Explain your answer on the grounds.
Open-ended questions have been added. In addition, interviews were made with the
students’ answers. In this direction, it was tried to identify the students’ errors and errors
regarding the question. In cases where the researchers hesitated while analyzing the an-
swers of the students, opinions were received from the mathematics teacher who entered
the course of the students.
Semi-structured interviews form: In this study, semi-structured interviews form was
used to collect qualitative data. This form was developed by researchers. During the
preparation of the form, the opinions of the field experts who had studies on the subject
were asked. Questions of the interview form are presented in Appendix-2.

2.3. Designing Digital Concept Cartoons

Mathematics course in Study Group I were processed using DCC. In this context,
the preparation of the DCCs has benefited from the website www.tondoo.com. DCC’s
have been prepared for each subject in which the misconceptions can be removed
by using digital characters, digital scenes and items on the website. DCC-supported
mathematics course design was prepared in line with Gagne’s teaching model prin-
ciples. The Gagne model (Gagné, 1985, 243) was used in the DCC and DCM design
process. This model was preferred because it has efficient and easily applicable steps
for teachers and students. According to this, Gagne’s teaching model: 1) providing
attention and guidance, 2) informing the student about the course objectives, 3) as-
sociating the next subject with previous learning 4) presenting the learning content,
5) guiding, 6) revealing performance, 7) providing feedback, 8) assessing perfor-
mance, 9) the process of ensuring the permanence of the information and strengthen-
ing the transfer. DCC’s were prepared for each step in every course and course are
processed using these. Among the concept cartoons prepared for this purpose, the ones
used at the beginning of the course were mostly prepared to draw attention to subject
and to inform the student about the subject and aims, and to remind the previous learn-
ing related to the subject. The DCC’s used in later stages of the course were mostly
used to initiate discussions about the concept or event, to encourage student to make
research, to create a discussion environment, to reveal and reduce misconceptions and
ambiguities. The DCC’s used at the end of the course were used to repeat and sum-
marize the learning, to ensure that the learning is valued.
 These DCC’s were prepared by three specialists in the field of educational technol-
ogy using the www.tondoo.com environment. In the preparation of the subject, scope
and content of the DCC, a researcher specialized in the field of mathematics education
participated. The researcher designed the scenarios, characters, elements and contents of
related digital concept cartoons in the paper environment in accordance with Gagne’s
teaching stages. These designs were then animated by researchers of educational tech-
nology in the environment of www.tondoo.com and DCC’s were prepared. The final
decision whether DCC’s are suitable for use in mathematics courses was made by exam-
ining the last time by a specialist in the field of mathematics education. When the DCC
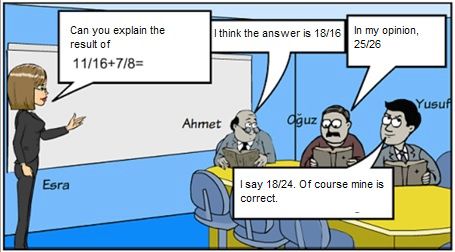
The Effects of Digital Concept Cartoons and Digital Concept Maps on ... 213

was found to be inadequate or inaccurate, the mathematics educator researcher and the
education technology researcher came together to give the DCC the final form. A sample
of the DCC used in the mathematics class is given in Fig. 2.
 The cartoon in Fig. 2 is designed to correct the misconception of students who pro-
cess algebraic expressions by simply ignoring parentheses and constantly making the
same mistake or ignoring unknowns and just dealing with numbers. Similarly, Fig. 3 is
designed to correct misconceptions of students who make mistakes by performing op-
erations like natural numbers when summing up fractions with unequal denominators.
 In the application of digital concept cartoons, the environment was provided for
students to discuss the situation given in the cartoon with their friends and discus-
sions were made in the classroom environment. For example, for the cartoon in Fig. 3,

 Fig. 2. Digital Concept Cartoon Designed to Reduce the Misconception
 of Neglecting Parentheses and Variable in Algebraic Expressions.

 Fig. 3. Digital Concept Cartoon Designed to Reduce Misconceptions Regarding Perform-
 ing Operations as Natural Numbers in Fractions with Unequal Denominators.
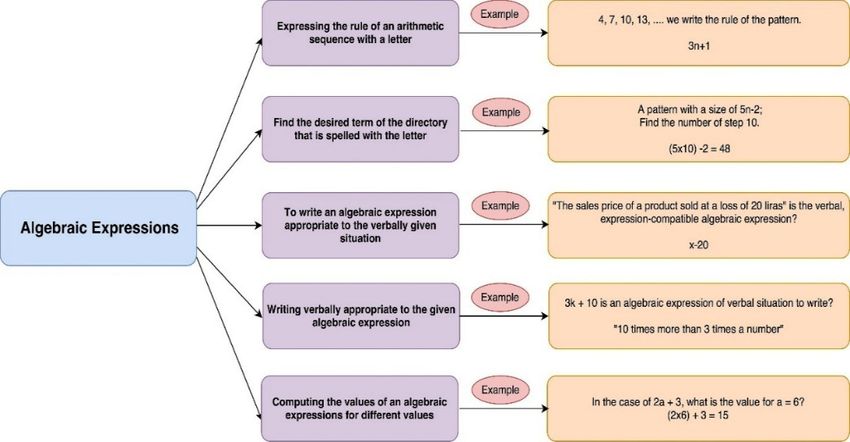
214 B. Gokkurt-Ozdemir et al.

students were asked to share their selection among the answers in the cartoon with the
whole class. Later on, the exploration activity was started in which the accuracy of
the answers in the cartoons can be tested. Students who selected wrong answer were
given transparent fraction cards and were asked to sum up fractions that have unequal
denominators. In addition, in order to be able to sum fractions with unequal denomina-
tors, they were asked to use area model and the number of it was expected that students
should understand that number of parts in the models must be equal to perform opera-
tions. In this way, learning environment for the reduction of the misconceptions that
students have was presented.

2.4. Designing Digital Concept Maps

Mathematics course in the Study Group II were done using digital concept maps (DCM).
In this context, the edraw max program was used for the preparation of DCM. DCM’s
were prepared for each topic in which misconceptions can be reduced by using digital
tools in related website. The design of the mathematics course supported by DCM has
been carried out in accordance with Gagne’s teaching model principles as well as in
the process of preparing the DCCs. In this process, researchers working in the field of
education technology and researcher working in the field of mathematics education
come together to prepare DCM’s to be used in lectures. An example of DCM’s used in
mathematics class is given in Fig. 4.
 Fig. 4, it was designed to correct the misconceptions that students have in under-
standing meanings of letters that represent variable in the algebraic expressions.

 Fig. 4. A Digital Concept Map Designed to Reduce the Misconceptions of Meanings of
 Variables in Algebraic Expressions.
The Effects of Digital Concept Cartoons and Digital Concept Maps on ... 215

 2.5. Application Process

 The application period of this study, which is carried out according to semi-experi-
 mental design, lasted a total of six weeks. Before the application process was started,
 the students in the study group and the control group were subjected to the Miscon-
 ception Test as a pre-test. The application process was started a week after the test. In
 the application process, the students in Study Group I received mathematics education
 supported by DCC, the students in Study Group II received mathematics education sup-
 ported by DCM, and the students in Control Group received mathematics course with
 traditional method. DCC and DCMs used in the Study Group I and the Study Group II
 were reflected with projectors to smart boards in the classrooms to make students think
 about the concepts, discuss, assess their learning. The misconceptions test was applied
 as a final test to the students in the study groups and the control groups in the week
 after the six week application period. Semi-structured interviews were also held with
 students in order to be able to take the opinions of the students in Study Group I about
 the use of DCC in mathematics course and the students in Study Group II about the
 use of DCM in mathematics course. The semi-structured interview form was applied to
 students face to face. As the questions addressed in a qualitative dimension were ques-
 tions related to the effectiveness of DCC and DCM, the interview was conducted only
 with the experimental group.

 2.6. Data Analysis

 2.6.1. Analysis of Quantitative Data
 The reduction of misconceptions of experiment and control groups and its reflection on
 academic success have been examined quantitatively.
 The groups’ academic success pre-test post-test scores were compared. ANCOVA
 analysis was used in the analysis. Prior to the analysis, the assumptions of this test were
 checked. The normality, kurtosis, skewness coefficients and homogeneity of the data
 were examined. Assumptions were provided.
 ���������
 ��������� + ���������

alitative data 2.6.2. Analysis of Qualitative Data
re collected inQualitative
 the study data wereascollected
 as well in thedata.
 quantitative studyInasthe
 well as quantitative data. In the process,
 students
 provided to fill were provided
 out interview forms. toData
 fill out interview
 collected forms. Data collected through interview
 through
eviewed under forms
 the themes and codes.under
 were reviewed The the
 views of the
 themes students
 and codes. The views of the students were coded
earchers independently from each independently
 by two researchers other for the reliability
 from each ofother
 the for the reliability of the study using
 ���������
 la ( ��������� +the
 ���������
 formula
 ���������
 ) (( )) ofofMiles
 Milesand
 andHuberman (1994), and the consistency
 ���������+���������
 the consistency between
 between encoders
 encoders waswas calculated
 calculated as .94.
 as .94. TwoTwo
 researchers came together and agreed on
her and agreedtheonremaining
 the remaining 6% difference. In addition,
 6% difference. In addition, member control was done for the reliability
ne for the reliability
 of theofresearch
 the research
 in theincoding
 the coding process.
 process.

 11 7
 +
216 B. Gokkurt-Ozdemir et al.

 3. Findings

 Obtained findings were presented in two sub-headings: “Findings about Academic Suc-
 cess” and “Findings Related to Student Opinions”.

 3.1. Findings about Academic Success
 Pre-post test Scores Related to Academic Success of Students

 At the beginning of the application period, a pre-test was applied to students’ academic
 success and to analyze the scores obtained from this test an independent sample t-test
 was applied. Findings on the pre-test scores of the experimental and control groups are
 presented in Table 2.
 When Table 2 was examined, it was found that the average of pre-experimental
 academic success scores of the students was 67.86 in the group in which the regular
 expression was applied and 70.24 after the application. In the experiment groups, the
 average of pre-application academic success scores in the group using the concept
 cartoon-designed activities was 66.15, was 68.85 after the application, and in the
 group using concept maps was 60.25 before the application and 63.75 after the ap-
 plication.

 3.2. Post-Test Scores Related to Academic Success According to
 Different Methods Applied to Students (DCC, DCM, and Regular Lecture)

 One-way covariance analysis (ANCOVA) was used to compare the statistical signifi-
 cant difference between groups’ academic success scores. The results of the ANCOVA
 on whether there is a significant difference between the post-test scores when pre-test
 scores of the groups’ academic success were controlled are presented in Table 3.
 As seen in Table 3, there is no statistically significant difference between the post-
 test academic success scores corrected according to pre-test scores of the groups
 ( F (2 ‒ 61) = .102, p > .05). In this context, it can be said that the academic success
 related to reducing the misconceptions of the students did not change significantly de-
 pending on the experimental process.

 Table 2
 Descriptive Findings Pre-test scores of the students
 ��������� of Academic Success
 ���������
 ��������� + ���������
 ��������� + ���������
 Group N Pre-test Post-test
 �
 X SD �
 X SD
 2.6.2. Analysis ofExperiment
 qualitative
 2.6.2. Analysis
 1 data 26 of qualitative
 66.15 data
 22.28 68.85 21.37
 Qualitative dataExperiment
 were
 Qualitative
 collected
 2 data
 20 in the
 were study
 collected
 60.25 as 17.51
 well
 in the
 as quantitative
 study as 17.31
 63.75 well
 data.
 as In
 quantitative
 the data. In the
process, students wereprocess,
 Controlprovided
 students
 to fill
 21 wereoutprovided
 interview
 67.86 to forms.
 22.55fill out Data
 interview
 70.24 collected
 forms.
 20.34 through
 Data collected through
interview forms were interview
 reviewed forms
 underwere
 the reviewed
 themes andunder
 codes.
 the The
 themes
 views
 andofcodes.
 the students
 The views of the student
were coded by two were researchers
 coded by independently
 two researchers
 fromindependently
 each other forfrom the reliability
 each otherofforthethe reliability of the
 ��������� ���������
study using the formula
 study using
 ( ���������
 the formula
 ���������
 ( ) ( ���������
 + ��������� ��������� + ���������
 ) ( ) of Miles and ) of Miles and
 ���������+��������� ���������+���������
Huberman (1994), Huberman
 and the consistency
 (1994), andbetween
 the consistency
 encoders was
 between
 calculated
 encoders
 as .94.
 was Two
 calculated as .94. Two
researchers came together
 researchers
 and came
 agreedtogether
 on the and
 remaining
 agreed 6%
 on the
 difference.
 remaining
 In 6%
 addition,
 difference. In addition
The Effects of Digital Concept Cartoons and Digital Concept Maps on ... 217

 Table 3
 ANCOVA
 ��������� Results of Post-Test Scores of Academic Success According
 ���������
 ��������� + to Methods
 ���������
 ��������� Corrected According to Students’ Pre-test Scores
 + ���������

 Group �
 X Adj. �
 X Variance Source Sum of Squares SD Squares Avg. F p
 is
 6.2.
 of Analysis
 qualitative
 of data
 qualitative data
 Experiment1 68.85 67.91 Pre-test 15096.32 1 15096.32 104.42 .00
data
 ualitative
 were data
 collected
 wereincollected
 the studyin as
 thewell
 studyas asquantitative
 Method well as quantitative
 data.
 29.59In thedata.
 2 In the
 14.79 .102 .90
 Experiment2 63.75 67.32
 ts
 ess,were
 students
 provided
 were toprovided
 fill out to
 interview
 fill out forms.
 interview
 Error Dataforms.
 collected
 Data through
 8818.80collected61 through
 144.57
 Control 70.24 68.00 Total 333500.00 67 students
 view
 wereforms
 reviewed
 wereunder
 reviewed
 the themes
 under the
 andthemes
 codes. and
 The codes.
 views of
 The theviews
 students
 of the
etwo
 coded
 researchers
 by two researchers
 independently independently
 from each other
 from for
 eachtheother
 reliability
 for theofreliability
 the of the
 ��������� ���������
ey formula
 using the( ���������
 formula ( ���������
 ���������
 3.3. Findings )+ (���������
 ���������
 Related
 + ���������
 ) ( Opinions
 to Student ) of Miles ) and
 of Miles and
 ���������+���������
 ���������+���������
 erman
 4), and(1994),
 the consistency
 and the consistency
 between encoders
 betweenwas encoders
 calculated
 was ascalculated
 .94. Twoas .94. Two
me
 archers
 together
 cameandtogether
 agreed and
 on the
 agreed
 remaining
 on the 6%
 remaining
 difference.
 6% difference.
 In
 Opinions of students about activities that was prepared addition,Inbyaddition,
 digital concept maps and
mber
 wascontrol
 done for
 was
 thedone
 reliability
 for theof
 reliability
 the research
 of the
 in research
 the coding
 in process.
 the
 conceptual cartoons in mathematics course and usage coding process.
 of these tools in other subjects,
 its effects on reducing misconceptions, positive aspects of process have been exam-
 Findings ined in their interviews. As the interviews with the students report opinions on the
 subject in more than one subject, number of frequencies does not overlap with the
 number of students.
 11 7 11 7
 + +
 16 8
 Students’ Opinions on 16Activities
 8 Made with DCM and DCC in Mathematics Course
 Coding frequencies
 18 of the
 18codes, the codes under the themes in which students’ views on
 activities designed
 16 with digital concept maps and digital concept cartoons in mathemat-
 16
 ics course were examined are given in Table 4.
 When Table25 4 is examined,
 25 in mathematics course, the most positive opinions of
 16 16
 students about the activities designed with digital concept cartoons was related to code
 enjoyable/funny and for activities designed with digital concept maps positive opinions
 18 18
 were related to code attention grabbing (f = 16). Most of the students during the inter-
 views found24 24
 that the activities designed with digital concept maps and digital concept
 cartoons were 18 interesting
 18 because of the fact that they included visuals, and therefore
 those materials8 were instructive
 8 for them.
 In mathematics course, it was seen that the most negative opinions of students about
 designed with digital concept cartoons were related to code student-level
 the activities+3 +3
 7 7 No opinion on the negative aspects of the activities designed
 eligibility (difficult/easy).
 with the digital concept map has been reported. Things that were not loved in the pro-
 1′ 1′
 cess and were thought to negatively affect views were criticisms such as being boring
 4 students4in the process, usage of common characters in cartoons, inter-
 (slow) for some
 ruption of the1′ course flow1′ when characters are used, and problems related to material
 design (small letters, lack of readability etc.). In this context, some student opinions
 7 7
 are as follows:

 “I think that the cartoons given to us allow to better understand what we
 are doing. Because this different kind attracts our attention and makes
 it more fun and makes our work easier. That’s why I think these digital
 concept cartoons are useful. I also want it to be used more.” (S5)
218 B. Gokkurt-Ozdemir et al.

 Table 4
 Students’ Opinions on Activities Designed with DCM and DCC in Mathematics Course

 Theme Code f

 Digital Concept Cartoons
 Positive Enjoyable / funny 24
 Attention grabbing 15
 Having visual quality 9
 Affect attitude towards the course 8
 Facilitate learning 8
 Detailed / understandable expression 7
 Using digital environment 6
 Use of cartoon 5
 Providing permanent learning 5
 Togetherness of exercise and activity 4
 Reminder of pre-information 3
 Strengthening 3
 Encouraging effort 3
 Relief of students with visuals 2
 Negative Student-level eligibility (difficult / easy) 9
 Boring (slow) 4
 Usage of common characters 3
 Slow pace of the course 1
 Problems related to material design (small letters, lack of readability, etc.) 1
 Digital Concept Maps
 Positive Attention grabbing 16
 Providing permanent learning 8
 Having visual quality 6
 Facilitate learning 5
 Affect attitude towards the course 3
 Enjoyable 2
 Use of digital environment 1
 Negative - 1

 “A fun and easy way to understand concepts (digital concept maps). I
 think it’s pretty good. It aims to improve myself and reduce our short-
 comings.” (S31)

 “It provides a better understanding of mathematics and is more mem-
 orable (digital concept cartoons).” (S17)

Topic titles that Misconceptions were reduced by Students in Mathematics Course
with Activities designed with DCM and DCC
Coding frequencies of the codes, the codes under the themes, themes in which students’
opinions of students on topic titles that misconceptions were reduced with activities
The Effects of Digital Concept Cartoons and Digital Concept Maps on ... 219

 Table 5
 Opinions of Students on Reduction of Misconceptions with Activities Designed with DCM and
 DCC in Mathematics Course of Students and Topic Titles in which Misconceptions were Reduced

 Theme f Topic titles f

 Digital Concept Cartoons
 Yes 36 Four operations 12
 Fractions (four operations, simplification, expansion, etc.) 7
 Integers 7
 Absolute value 5
 Decimal numbers 3
 Inequalities/equations/Algebraic Expressions 2
 No 21 *
 Digital Concept Maps
 Yes 14 Algebraic expressions 14
 No 10 None

 * The students declared that they have knowledge about the subject being taught
 and that they do not report any topics as there is no misconception.

designed with digital concept maps and digital concept cartoons in Mathematics course
were examined are given in Table 5.
 According to Table 5, most students expressed that activities designed with digital
concept maps and digital concept cartoons reduced most of misconceptions. In addition,
when the findings in Table 5 were examined, it was seen that some students stated that
they had corrected the mistakes they made in the four operations besides the misconcep-
tions they had. During interviews, they stated that they corrected mistakes in operations
such as priority, addition, multiplication, +/‒ sign change.
 In general, it has been seen that most learners had misconceptions in different sub-
jects and that these were corrected by activities designed with DCM and DCC. The opin-
ions of the course teacher involved in the researcher support this situation (See Table 5).
Some of the participant’s opinions are as follows:

 “Yes. About fractions. I learned this subject by reading from the books
 and watching the activities done. So I knew things in advance. But this
 year I realized that I had learned wrong information after learning it
 with digital concepts cartoons.” (S10)

 “Yes. I could not understand some math topics, like fractions before.
 But digital concept maps are visually and entirely catchy.” (S34)

Liked Aspects by Students in Activities Designed with Digital Concept Cartoons and
Digital Concept Maps in Mathematics Course
Table 6 shows the codes and themes under the themes and themes in which students’
opinions about the concepts they liked in activities designed with digital concept maps
and digital concept cartoons in mathematics course are shown.
220 B. Gokkurt-Ozdemir et al.

 Table 6
 Liked Aspects by Students in Activities Designed with DCM and DCC in Mathematics Course

 Theme Code f

 DCC
 Aspects related to Digital visual quality 15
 Concept Cartoons and En- difficulty of digital concept cartoon content 6
 vironment ease of digital concept cartoon content 4
 facilitate learning 2
 presentation of tips 1
 the sincerity of the learning environment 1
 DCM
 Aspects related to Digital Visuals 19
 Concept Map Enjoyable 7
 Being Holistic 1

 According to Table 6, the digital concept cartoon’s design features such as color,
line, and painting influence student liking. Visual quality is the code that was frequently
coded in terms of the most favorable aspects of digital concept cartoon and environ-
ment. Difficulty and ease of digital concept cartoon and its facilitation of learning were
the favorable aspects. The digital concept map was most liked in terms of visual quality.
Students also liked the digital concept map because it shows enjoyable.
 There are citations from two students below.

 “I mostly like the characters and the visual quality from the activities
 designed with digital cartoons. Because these cartoons attract my at-
 tention more. They make it easier to understand lectures.” (S12)

Students’ opinions on the use of Digital Concept Maps and
Digital Concept Cartoons for other Topics in Mathematics Course
Coding frequencies of the codes, the codes under the themes, themes in which students’
opinions of students on use of digital concept maps and digital concept cartoons for
other topics in Mathematics course are given in Table 7.
 According to Table 7, most students stated that the desire to use digital concept car-
toons in other topics is related to the fun of digital concept cartoons and the enjoyment
of learning. The digital concept cartoons used in the prepared event made students
want to use them in other topics by providing better understanding and permanent
learning. However, some students did not want to use the digital concept cartoons in
other topics because of the fact that it slows down the course and is boring.
 The most frequently coded code among the opinions on the use of the digital concept
map in other topics was facilitates learning. On the other hand, since it is appropriate
for concept learning, use of it in other topics is also important. Digitality has attracted
the interest of students and the fact that the concept map is digital is also important.
The Effects of Digital Concept Cartoons and Digital Concept Maps on ... 221

 Table 7
 Students’ opinions on the use of DCM and DCC for other Topics in Mathematics Course

 Theme f Code f

 DCC
 Yes 44 Enjoyable / Learn with fun 16
 Easier understanding with digital concept cartoon 10
 Providing permanent learning 5
 Attention grabbing 5
 Offering a wide range of information opportunities 4
 Desire to see more cartoons 4
 No 8 Slow pace of the course 3
 Boring 3
 Disliking selected cartoon 2
 DCM
 Yes 26 Facilitate learning 20
 Suitable for concept learning 4
 Being digital 2
 No 2 Boring 2

4. Discussion and Conclusion

Findings of this research conducted to reveal the effects of DCC and DCM in reduc-
ing the misconceptions in the mathematics courses of middle school students reveal
that there is no statistically significant difference between the control and study groups
among the results of the concept misconceptions test. However, when student opinions
on the use of DCC and DCM in mathematics courses are examined, it is seen that
the use of such tools has various benefits. When the literature is examined, it is seen
that there is no similar study in which the quantitative findings of this study can be
compared. However, it is seen that there are various research results that are in line
with the qualitative findings of the research. In the study of Young (2017), it was seen
that concept cartoons were effective in diagnosing and eliminating misconceptions in
mathematics education. In his qualitative research, Ozdemir, Yildiz-Durak, Karaoglan
Yilmaz and Yilmaz (2018) revealed that digital concept cartoon and digital concept
map is effective in eliminating misconceptions in mathematics.
 The students’ positive opinions on the activities using DCC were respectively: mak-
ing the course enjoyable/funny, grabbing attention, visualizing the course, positively
affecting attitudes towards the course, and facilitating learning. Göksu (2014) stated in
the study about the use of concept cartoon in topics such as lines, angles, and polygons
that learners developed positive opinions about group activities, their curiosity and
interest in the courses increased and their learning efforts and desires developed. Erdağ
(2011) and Güler (2010) stated that students expressed positive opinions about the use
of concept cartoons in teaching mathematics courses. Even if the frequency is low,
222 B. Gokkurt-Ozdemir et al.

students stated that DCC’s are not suitable for the student level and the course becomes
boring as negative opinions. Considering the success of the students in the misconcep-
tion test, it is clear that the most efficient subjects that DCC’s reduce misconceptions
are fractions (four operations, simplification, expansion etc.) and integers. The reason
DCC is particularly effective in fractions is related to the fact that the issue is an ab-
stract issue. Thanks to DCC, abstract issues are embodied. This made the teaching of
the subject effective.
 The students’ positive opinions on the activities using DCC were respectively: at-
tention grabbing, providing permanent learning, visualizing the course and facilitating
learning. It is noteworthy that these opinions are similar to the opinions of students in
the group using DCC. However, it is remarkable that although the opinions like mak-
ing the course enjoyable/funny, affecting attitude toward the course positively were
frequent for the use of DCC’s, the students did not comment likewise for the use of
DCM’s. It is thought that the main reason for this situation is related to the more inter-
est of students in DCM depending on their age levels. When student opinions on the
reduction of misconceptions with DCM’s were examined, it has been determined that
the most effective subject area was algebraic expressions. Students did not report any
negative opinion about the use of DCM’s When the literature is examined, it has been
seen that the use of DCM and DCC in numerical and intangible courses such as math-
ematics and science makes the lessons fun, effective and interesting (Young, 2017; Oz-
demir et al., 2018). In this respect, it is seen that the results of our research are similar
to the literature.
 The most favorite aspects of the students about the activities designed with the DCC
in the mathematics courses were respectively: the selection of characters that fit the
students’ interests, visualization of courses, selection of special characters (anime / real,
concentration on special characters-Santa Claus etc.), and the use of fun characters.
The most favorite aspects of the students about the activities designed with the DCM in
the mathematics courses were respectively: visualization of courses, and making courses
enjoyable.
 The vast majority of students using DCC expressed that DCCs need to be used in
other subjects in mathematics courses because of the main reasons such as enjoyable/
learning with fun, easier understanding, permanent learning, and grabbing attention. The
majority of students using DCM expressed that DCMs need to be used in other subjects
in mathematics courses since it facilitates learning.
 While the number of researches on the use of DCC and DCM in mathematics
education is limited, there are various studies related to other fields such as science
in the literature. Kabapinar (2009) found that benefiting from concept cartoons in the
reduction of misconceptions in science courses for elementary school students is use-
ful in initiating and sustaining discussions especially on concepts. Similarly, the result
of this research which reveals that DCCs are enjoyable, grab attention and increase
participation in the course supports this finding, Ekici, Ekici and Aydin (2007) found
that concept cartoons are effective tools to reveal and reduction misconceptions in
science courses. However, the results of this study show that the use of DCC, DCM
The Effects of Digital Concept Cartoons and Digital Concept Maps on ... 223

and traditional methods in mathematics does not have a significant difference in mis-
conceptions. It is thought that difference between the result of this research and study
of Ekici et al. (2007) resulted from the type of course (science/mathematics). Akamca,
Ellez and Hamurcu (2009) found that the use of computer-aided concept cartoons in
the fourth-grade science course of elementary school led to academic success. It is
seen that the results of these studies in the literature differ from the results of this study
in terms of reducing misconceptions. Possible reasons for this difference may be that
the study was carried out on teacher candidates in science courses. Bolte (1999) found
that the use of concept maps have improved the information organization and devel-
oped students’ mathematical knowledge in the study in which conducted to determine
the effectiveness of concept maps in mathematics education. Baki and Mandacı-Sahin
(2004) have also shown that DCM can be used as an effective evaluation method in
mathematics classes. Hasemann and Mansfield (1995) examined the effectiveness of
using concept map in mathematics education and found that concept maps have an
important role in learning behaviors and success of students on previous knowledge
about some mathematical subjects and determining how they construct relationships
between concepts. On the other hand, the study by Wehry and Goudy (2006) empha-
sizes that concept maps are important tools for teachers in terms of teaching concepts
and relationships among concepts in the abstract structure of mathematics. The results
related to DCM in the literature are similar to the qualitative findings of this study.
However, considering the quantitative findings of our study, it was seen that it does not
support the quantitative findings.
 It should be agreed that this study have some limitations. First of all, research on
mathematics education using DCC and DCM appears to be limited. For this reason, it
can be said that similar studies can be useful for the generalization of research results.
Secondly, the study was conducted for six weeks with the seventh grade students. Fu-
ture research may examine the effectiveness of DCCs and DCMs by applying for lon-
ger periods and working with students at different grades. Materials developed using
DCCs and DCMs were used only with teacher guidance. In future research, the impact
of DCCs and DCMs on the learning process and results can be examined by increasing
the interaction of students with the mentioned materials outside the school, by apply-
ing to schools where each student has a computer or a mobile device. In addition, the
effect of using DCCs and DCMs as an evaluation tool can be examined in solving the
misconceptions in mathematics. Finally, in addition to the effects of DCCs and DCHs
on reducing misconceptions in mathematics, permanence of learning, reduction of cog-
nitive burden, attitude toward lecture and motivation can be examined.

Acknowledgments

This study was funded by Bartin University Scientific Research Project Unit [Grant
number 2017-SOS-A-009].
224 B. Gokkurt-Ozdemir et al.

References

Adıgüzel, T., Şimşir, F., Çubukluöz, Ö., & Gökkurt Özdemir, B. (2018). Türkiye’de matematik ve fen eğitiminde
 kavram yanılgılarıyla ilgili yapılan yüksek lisans ve doktora tezleri: Tematik bir inceleme [Master’s theses
 and doctoral dissertations on misconceptions in mathematics and science education in turkey: a thematic
 analysis]. Bayburt Eğitim Fakültesi Dergisi [Bayburt University Journal of Education], 13(25), 57–92.
Akamca, G. Ö., Ellez, A. M., & Hamurcu, H. (2009). Effects of computer aided concept cartoons on learning
 outcomes. Procedia-Social and Behavioral Sciences, 1(1), 296–301.
Akkaya, R., & Durmuş, S. (2006). İlköğretim 6–8. sınıf öğrencilerinin cebir öğrenme alanındaki kavram
 yanılgıları [Misconceptions of elementary school students in grades 6–8 on learning algebra]. Hacettepe
 Üniversitesi Eğitim Fakültesi Dergisi [Hacettepe University Journal of Education], 31,1–12.
Akkuş, G. (2013). 6. sınıf öğrencilerinde dolaşım sistemi konusunda görülen kavram yanılgılarının gider-
 ilmesinde bilgisayar destekli kavram haritalarının etkisi [The effects of computer assisted concept map
 on overcoming 6th grade students’ misconceptions of circulatory system]. (Unpublished master thesis).
 Pamukkale University, Denizli, Turkey.
Anderson-Inman, L. & Ditson, L. (1999). Computer-based concept mapping: A tool for negotiating meaning.
 Learning & Leading with Technology, 26(8), 6–13.
Arnaodin, M., & Mintzes J. (1985) Students’ alternative conceptions of the human circulatory system: A cros-
 sage study. Science Education, 69(5), 721–733.
Ayvacı, H. Ş., & Devecioğlu, Y. (2002). Kavram haritalarının fen bilgisi başarısına etkisi [Effect of concept
 maps on science achievement]. Full text paper presented at V. National Science and Mathematics Educa-
 tion Congress (p.62–66). Ankara: ODTÜ, Turkey.
Baki, A., & Mandacı-Şahin, S. (2004). Bilgisayar destekli kavram haritası yöntemiyle öğretmen adaylarının
 matematiksel öğrenmelerinin değerlendirilmesi [Assessment of preservice teachers’ mathematical learning
 trough computer aided concept mapping method]. The Turkish Online Journal of Educational Technology
 (TOJET), 3(2). 91–104.
Bilgin, T. & Akbayır, K. (2002). Lise 1. sınıf öğrencilerinin ondalık sayıları yorumlama ve uygulamada sahip
 oldukları kavram yanılgıları [The misconceptions that first-year high school students have in interpreting and
 applying decimal numbers]. Kastamonu Eğitim Dergisi [Kastamonu Education Journal], 10(1), 109–118.
Bolte, L. A. (1999). Using concept maps and interpretive essays for assessment in mathematics. School Sci-
 ence and Mathematics, 99(1), 19–30.
Chang, K., Sung, Y., & Chen, S. (2001). Learning thorough computer-based concept mapping with scaffolding
 aid. Journal of Computer Assisted Learning, 17, 21–33.
Creswell, J. W. and Clark, P. L. (2008). Mixed Methods Reader. California: Sage Publication.
Dabell, J. (2004). The Maths Coordinator’s File-Using Concept Cartoons. Londan: PFP publishing.
Dabell, J. (2008). Using concept cartoons. Mathematics Teaching Incorporating Micromath, 209, 34–36
Duban, N. Y. (2013). Sınıf öğretmenlerinin kavram karikatürlerini hazırlamaya ve kullanmaya yönelik
 görüşleri [The opinions of primary school teachers about preparing and using concept cartoons]. Akademik
 Araştırmalar Dergisi [Journal of Academic Studies], 56, 35–54.
Ekici, F., Ekici, E., & Aydin, F. (2007). Utility of concept cartoons in diagnosing and overcoming miscon-
 ceptions related to photosynthesis. International Journal of Environmental and Science Education, 2(4),
 111–124.
Erdağ, S. (2011). İlköğretim matematik 5. sınıf dersinde kavram karikatürleri ile destekli matematik öğretiminin,
 ondalık kesirler konusundaki akademik başarıya ve kalıcılığa etkisi. [The effect of mathematics teaching
 supported by concepts cartoons decimal fractions on academic achievement and retention in 5th grade
 classes of primary schools] (Unpublished master thesis). Dokuz Eylül University, Institute of Education
 Sciences, Turkey: İzmir.
Erdoğan, A., & Özsevgeç, L. C. (2012). Kavram karikatürlerinin öğrencilerin kavram yanılgılarının giderilmesi
 üzerindeki etkisi: Sera etkisi ve küresel ısınma örneği [The effects of concept cartoons on eliminating stu-
 dents’ misconceptions: greenhouse effect and global warming]. Turkish Journal of Education, 1(2), 1–13.
Ersoy, Y. (2006). İlköğretim matematik öğretim programındaki yenilikler-I: Amaç, içerik ve kazanımlar [In-
 novations in mathematics curricula of elementary schools-I: Objective, content and acquisition]. İlköğretim
 Online [Elementary Education Online], 5(1), 30–44.
Evrekli, E. & Balım, A. G. (2015). Fen derslerinde animasyon destekli kavram karikatürleri kullanımının
 altıncı sınıf öğrencilerinin sorgulayıcı öğrenme becerileri algılarına etkisi [The effects of concept cartoons
 assisted animations on 6th grade students’ inquiry learning skills perceptions]. Western Anatolia journal of
 Educational Science, 6(11), 109–136.
You can also read