Computer-Based Concept Mapping as a Method for Enhancing the Effectiveness of Concept Learning in Technology-Enhanced Learning - MDPI
←
→
Page content transcription
If your browser does not render page correctly, please read the page content below

sustainability

Article
Computer-Based Concept Mapping as a Method for
Enhancing the Effectiveness of Concept Learning in
Technology-Enhanced Learning
Gülsüm Aşıksoy
 Department of Education and Instructional Technology, Near East University, 99138 Nicosia (Via Mersin
 10 Turkey), North Cyprus, Cyprus; gulsum.asiksoy@neu.edu.tr

 Received: 20 December 2018; Accepted: 12 February 2019; Published: 15 February 2019

 Abstract: Technology enhanced learning is a wide area that covers all uses of digital technology to
 support learning and teaching activities. The computer-based concept mapping has shown potential
 in enhancing meaningful learning in education. Concept mapping is an important tool that is used
 in the field of education to help students in understanding the basic concepts and the relationships
 between them. This research proposes a computer-based concept mapping (CBCM) environment
 combined with Google classroom to help students reduce their misconceptions and to improve their
 problem solving skills. Furthermore, it examines the effect of CBCM on the sustainability of concept
 learning according to student views. The participants were first-year engineering students. The study
 was conducted in a physics class, and a true-experimental design was used. The experimental
 group students learned with the Google classroom combined with computer-based concept mapping
 (CBCM), while the concept group students learned with Google classroom and the traditional method.
 Data were collected from a physics concept test, problem solving inventory, and semi-structured
 interviews. The research results indicated that teaching in the CBCM environment combined with
 Google Classroom provides meaningful learning by correcting the misconceptions of the students.
 Moreover, there was a significant increase in the problem solving skills of the experimental group
 as compared to the control group. According to the students’ views, it was determined that CBCM
 enhances the sustainability of concept learning. The results of this study can help educators and
 researchers to integrate computer-based concept mapping (CBCM) techniques into Google Classroom.

 Keywords: concept mapping; misconceptions; sustainability; technology enhanced learning

1. Introduction
     The deficiencies and inaccuracies that exist in the student’s prior knowledge cause them to
misconfigure the knowledge in their minds. Concept maps are useful tools in assessing students’ prior
knowledge, misconceptions, and sustainability of their meaningful learning [1].
     The source of the difficulties that the students experience in concept learning can be classified as
being related to the individual and the individual’s environment. Some reasons that are related to the
individual are that they have negative attitude, interest, and motivation towards learning, problems in
the students’ identification and perception systems, lack of prior knowledge, non-scientific prejudice,
and the inability to link new knowledge with prior knowledge [2]. The reasons that are related to the
individual environment include weakness of teacher-student interaction, inadequate technology tools,
the simplicity of course materials and books, inadequate teaching methods, and lack of knowledge
of the teacher regarding students’ prior knowledge of the subjects [3]. The misconceptions not only
negatively affect students’ complete learning, but they also prevent the reasoning skill, which is an
important factor in problem solving [4]. Because concepts enable the information to be grouped and

Sustainability 2019, 11, 1005; doi:10.3390/su11041005                    www.mdpi.com/journal/sustainability
Sustainability 2019, 11,
Sustainability 2019, 11, 1005
                         x FOR PEER REVIEW                                                                               22 of
                                                                                                                            of 19
                                                                                                                               19

information to be grouped and organized systematically, the relations between the concepts
organized systematically, the relations between the concepts constitute principles and help to solve
constitute principles and help to solve problems [5]. Students with misconceptions tend to only
problems [5]. Students with misconceptions tend to only identify the correct and unknown variables
identify the correct and unknown variables in the science lessons and find answers by placing
in the science lessons and find answers by placing variables into formulae [4,6].
variables into formulae [4,6].
     Concept mapping is the most commonly used technique in teaching concepts and identifying
     Concept mapping is the most commonly used technique in teaching concepts and identifying
and eliminating the misconceptions in the field of education [7]. Concept mapping is a graphical
and eliminating the misconceptions in the field of education [7]. Concept mapping is a graphical
presentation of the relations between the concepts using link words and in a hierarchical manner [8].
presentation of the relations between the concepts using link words and in a hierarchical manner [8].
The concept mapping technique that was developed by Novak and Gowin (Figure 1) [9] is supported
The concept mapping technique that was developed by Novak and Gowin (Figure 1) [9] is supported
by Ausubel’s meaningful learning theory [10]. Meaningful learning theory claims that, in order
by Ausubel’s meaningful learning theory [10]. Meaningful learning theory claims that, in order for
for meaningful learning to take place, the learners need to assimilate the new concepts with prior
meaningful learning to take place, the learners need to assimilate the new concepts with prior
knowledge by associating them into a systematic structure. Concept maps are powerful tools that
knowledge by associating them into a systematic structure. Concept maps are powerful tools that
help in identifying the misconceptions of the students as well as in realizing conceptual change and
help in identifying the misconceptions of the students as well as in realizing conceptual change and
restructuring the students’ knowledge [11].
restructuring the students’ knowledge [11].

                                          Figure 1. Model of a Concept Map [9].
                                          Figure 1. Model of a Concept Map [9].
      Quality education is considered to be one of the key elements of sustainable development
in the world. As the use of technologies in classroom matures it is necessary in examining how
       Quality education is considered to be one of the key elements of sustainable development in the
technology-enhanced learning can effectively add to teaching and learning and, consequently, to the
world. As the use of technologies in classroom matures it is necessary in examining how technology-
imperative of quality education and sustainable growth and development [3]. Technology can be
enhanced learning can effectively add to teaching and learning and, consequently, to the imperative
employed to enhance the skills acquisition process, improve critical thinking, engagement, and overall
of quality education and sustainable growth and development [3]. Technology can be employed to
with empowering individuals to seize opportunities and exploit their potential [12]. For efficiently using
enhance the skills acquisition process, improve critical thinking, engagement, and overall with
concept maps in education, technology-based concept mapping systems have been developed [13].
empowering individuals to seize opportunities and exploit their potential [12]. For efficiently using
      Concept maps can be created on paper or they can be technology based. Some advantages of
concept maps in education, technology-based concept mapping systems have been developed [13].
technology-based concept mapping are: easy restructuring, highlighting, comments, presentability,
       Concept maps can be created on paper or they can be technology based. Some advantages of
manipulation, dynamic linking, conversion, and storage [14].
technology-based concept mapping are: easy restructuring, highlighting, comments, presentability,
      Nevertheless, the use of concept maps is suggested, because they make the students’ thinking
manipulation,      dynamic linking, conversion, and storage [14].
visible, especially in problem solving processes [15]. Although there are studies that emphasize the
       Nevertheless, the use of concept maps is suggested, because they make the students' thinking
benefits   of using concept
visible, especially      in problemmapping     as processes
                                         solving  an assistant     tool
                                                                [15].    in the process
                                                                       Although             of concept
                                                                                     there are   studies teaching,   there is
                                                                                                          that emphasize    thea
limited
benefitsnumber
           of usingofconcept
                          studiesmapping
                                   that use the    computer-based
                                               as an   assistant tool in  concept     mapping
                                                                             the process          as a teaching
                                                                                            of concept           strategy
                                                                                                          teaching,  thereand
                                                                                                                            is a
that
limited number of studies that use the computer-based concept mapping as a teaching strategyhave
      report  their   impact     on  the  students’   problem     solving    skills   [16–18].  However,    researchers    and
identified
that reporta their
               critical   problem
                       impact         in using
                                 on the         concept
                                           students'       maps solving
                                                      problem     to support      learning.
                                                                              skills         This
                                                                                      [16–18].      problemresearchers
                                                                                                However,      creates an extra
                                                                                                                          have
burden
identifiedforathe  teachers
               critical         when
                          problem     inevaluating    the concept
                                          using concept    maps to mapssupport that  were developed
                                                                                  learning.              by the
                                                                                              This problem      students
                                                                                                              creates      and
                                                                                                                       an extra
it can  take  a long    time   for the   teachers  to  give  feedback     on   the  concept   maps
burden for the teachers when evaluating the concept maps that were developed by the students and      that the students   have
created.
it can takeThea flow
                 long oftimethefor
                                education     process
                                    the teachers        is prevented
                                                    to give   feedbackby   onthis
                                                                                thesituation   [19,20].
                                                                                    concept maps      that the students have
created. The flow of the education process is prevented by this situation [19,20].mapping on learning
      Studies   in  the   literature   focused   on  the  impact    of  computer-based       concept
performance
       Studies [17,20].     However,focused
                 in the literature      there areon
                                                  limited   studies
                                                     the impact     ofon  the effect of computer-based
                                                                        computer-based       concept mappingconceptonmapping
                                                                                                                      learning
on  students’ problem
performance                   solving skills
                  [17,20]. However,            [7,17].
                                            there  are Therefore,
                                                        limited studiesthis study
                                                                              on the is to address
                                                                                        effect       the insufficiency
                                                                                                of computer-based        in the
                                                                                                                       concept
mapping on students' problem solving skills [7,17]. Therefore, this study is to address the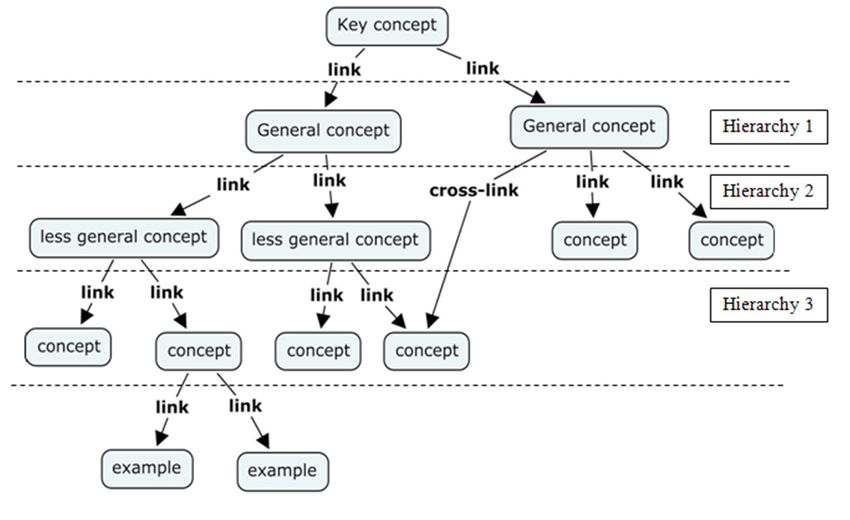
Sustainability 2019, 11, 1005                                                                        3 of 19

literature by providing an empirical study that investigates the possible benefits of computer-based
concept maps on students’ problem solving skills.
      According to Lin et al., computer-based concept mapping provides visualization and interactive
features [21]. In this context, Google classroom, which is used as the interface in this study, seems to
be a suitable platform for computer-based concept mapping. However, there is no study in which
computer-based concept mapping tools have been used in the Google Classroom. Moreover, no studies
have used the computer-based concept mapping technique within the Google Classroom platform in
relation to physics teaching.
      To fill this gap in the literature, the computer-based concept mapping technique was integrated
into the Google Classroom, and then the effect on physics teaching was examined. In this context,
the impact of combining Google Classroom and computer-based concept mapping (CBCM) on
correcting the misconceptions of the students’, teaching new concepts correctly and developing
their problem solving skills by visualizing their thoughts in the problem solving process have been
investigated in this study.
      The following research questions were addressed:

•     Can a computer-based mapping (CBCM) environment combined with Google Classroom reduce
      the students’ misconceptions?
•     Can a computer-based mapping (CBCM) environment combined with Google Classroom improve
      the students’ problem solving skills?
•     What are the students’ perceptions of the computer-based mapping (CBCM) environment
      combined with Google Classroom?

2. Theoretical Background

2.1. Concept Mapping
     Novak and Gowin developed concept maps [9], which were in accordance with the theory of
meaningful learning. Depending on Ausubel’s theory, concept maps are schematics that link the
individuals’ prior knowledge and new knowledge, and that show how individuals relate concepts in
their minds [9]. A concept map is a visual thinking tool that can be applied to all cognitive functions,
especially to memory, learning, creativity, and analysis [22]. According to another definition, the concept
mapping is a valid approach that helps students to structure and present conceptual information by
using their visualization skills to improve their study skills [23].
     Concept maps have many intended purposes, such as visualizing information as well as
generating, evaluating, and organizing ideas. The concepts, the relationships between the concepts,
and propositions are the basic components of the concept map. Two concepts are connected with a
connection line and words called “linking words” are written on it, which indicate the relationship
between the concepts [9]. The two concepts and the unit that is formed by the linking word that
expresses the relations between these concepts is called a “proposition”, and it is considered to
be the essential component of the concept map [24]. A good concept map should have certain
properties, which are that the basic concepts should be arranged hierarchically, the fundamental
concepts should be determined, the concepts should be in circles or boxes, propositions that describe
the relationships between the concepts should be written, the direction of the arrows in the relations
should be determined, and the concept maps and components should be visible and readable [25].
     Previous studies have focused on determining student achievement and the effects of the concept
maps on the attitudes towards a given course. For example, Dosanjh analysed the effect of the
technique of forming three different concept maps (concept determination, proposition determination,
and mapping from scratch) on the understanding of the circulatory system of 7th grade students. As a
result of the study, it was concluded that the technique of creating three concept maps was a tool that
could increase the students’ science achievements [26]. Lin et al. stated in their study that concept maps
have a positive effect on students’ achievements and their attitudes towards a course [21]. Nakipoglu
Sustainability 2019, 11, 1005                                                                         4 of 19

and Ertem compared concept map scores that were obtained from different scoring techniques
(structural scoring, relational scoring, and proposition accuracy scoring methods) [27]. Akinoglu
and Yasar reached the conclusion in their study that concept maps had a positive effect on students’
attitude towards their science course and their academic success [28]. In other previous studies,
the effectiveness of concept maps, as an assessment tool, has been analysed [26,29,30]. These studies
have revealed that the concept mapping has a significant effect on learning, student achievement,
and attitudes, and that the concept mappings can be used as an evaluation instrument.

2.2. Computer-Based Concept Mapping
     Concept mapping that is made with paper and pencil is a complex task. Many students find
making concept maps with paper and pencil time consuming and exhausting [31]. Since paper-based
concept maps are two dimensional and have limited space, it is difficult to place all the possible
relationships between concepts on them [9]. Computer-based concept mappings provide potential
benefits for both students and educators by eliminating the limitations of the traditional paper-based
concept maps [32,33]. The benefits of computer-based concept mappings are presented below:

•     they are user-friendly and corrections can be made more efficiently; the nodes can be quickly
      added, corrected, or deleted;
•     the convenience of communication with peers: Students can obtain precise information by
      showing the concept maps on the screen to each other and then discussing them;
•     they support the active learning strategies of feedback and evaluation and they can present
      common online tools for map history functions [34].

     According to Plotnick, the technique of concept mapping can be easily prepared and the potential
benefits are enhanced with the use of computers. There are many advantages of computer-based
concept mapping as compared to the paper-based maps, such as the ability to automatically add
concept boxes, correct erroneous placements without redrawing, record sound, add video, and link
concept maps [35].
     There are many platforms for computer-based concept mappings, such as Bubbl.us (https://bubbl.
us/), MindMup (http://www.mindmup.com/), FreeMind (http://freemind.sourceforge.net/wiki/
index.php/Main_Page), and Mindomo (https://www.mindomo.com/). These consist of multipurpose
programs that enable the integration of digital data (web links, images, videos, articles) into the map [33].
     Studies in the literature have generally focused on the comparison between paper-based
concept mapping and computer-based concept mapping. For instance, in their study, Liu, Chen,
and Chang concluded that computer-based concept mapping improves the ability of the EFL students’
understanding of the things that they read in English [36]. Wu et al. analysed the effect of giving
feedback through computer-based mapping on the learning performance of nursing students [20].
Hwang, Wu, and Ke used the computer-based concept mapping approach in a natural sciences
course in a primary school and they have found that it is beneficial for improving students’ learning
performance [37]. Chu, Hwang, and Liang proposed a collaborative computer-based concept
mapping approach to help with interpreting and organizing the data that were collected in web-based
information searching activities. The students’ attitude, self-efficacy, and success were demonstratively
improved through this approach [38]. Shamsuddin et al. analysed the impact of the computer-assisted
concept mapping teaching strategy on student performance in a chemistry course. As a result of the
study, it was found that this strategy was gender-friendly because the performance of both male and
female students increased at the same rate [39].

2.3. Problem Solving Skills
     Problem solving skills are the skills of limiting and understanding a problem that is encountered,
selecting the appropriate method for the solution, using this method, and then analyzing the results [40].
Problem solving is considered to be an essential cognitive activity in everyday and business life, and it
Sustainability 2019, 11, 1005 5 of 19
is an important survival skill in developed societies. When this skill is acquired, it becomes a routine
for an individual to apply a problem solving approach in order to explain the events around them [41].
Thinking is one of the most important activities for problem solving skills. Identifying a problem
initiates the thinking activity; the solution of the problem turns into an aim for the individual and then
leads him or her to think. Thus, thinking that emerges in relation to a problem creates a process. In this
process, it is important to use techniques that enable the individual to think at a higher level [42]. In the
field of education, problem solving emerges as a skill that provides personal development and effective
learning [43]. Recent studies have revealed the importance of encouraging meaningful learning
and the importance of making thinking visible in enhancing problem solving performance [17,44].
Hwang et al. argued that the integration of concept mapping in learning would subsequently improve
the problem solving skills of the students and their knowledge of the subject [17]. As mentioned,
concept mapping in the literature is mainly used in conceptual learning contexts. There are very few
studies that have reported the impacts on research or problem solving contexts. For instance, in the
study of González et al., it was shown that concept mapping is a tool that has a positive impact on the
medical physiology of students’ problem solving performance [45]. Sarker has revealed that the use of
concept mapping as a tool for solving engineering problems increased the participation of the students
and helped in problem solving [46]. Wang et al. identified that the cognitive mapping approach
had a promising effect in improving the students’ problem solving performance, subject knowledge,
and internal motivation for solving complex problems [7]. Hwang et al. found that integrating concept
mapping with problem solving based learning can improve students’ problem solving performance
and subject knowledge [17].
2.4. Google Classroom
Google Classroom is a platform that can work with G-mail, Google Docs, and Google Drive to
facilitate and accelerate the work of both the teachers and students [47]. Google Classroom has many
advantages for both the students and teachers. For instance, with Google Classroom, teachers can
automate and organize the distribution and collection of assignments. Teachers can make corrections
on homework and provide necessary feedback. Teachers can make quick announcements with Google
Classroom and students can help each other because of the ability to share through the class stream [48].
It is not necessary to be a registered user at an educational institution in order to use Google
Classroom. Anyone with a Google account can sign up and access all the applications, such as Drive,
spreadsheets, docs, slides, etc. The application is easily accessible and applicable in face-to-face
learning environments or online environments for educators or learners. It is also easy to use on mobile
devices. Mobile access to learning materials that are attractive and easy to interact within today’s
web-connected learning environments is very important [49].
3. Methodology
3.1. Research Design
In this study, a pre-test and post-test design with a control group was used. In the first week,
each student was randomly assigned to the experimental group or the control group. Additionally,
the experimental students’ group was given training on how to create a concept map with the MindMup
application and then sample applications were performed.
In the second week, the Physics Concept Test (PCT) and the Problem Solving Inventory (PSI) were
applied as a pre-test for the students in both groups. At the end of the experimental processes, PCT and
PSI were applied as a post-test for both groups. Furthermore, 17 volunteers from the experimental
group were individually interviewed for the CBCM environment that was integrated into Google
Classroom. The research design is shown in Figure 2.Sustainability
Sustainability 2019, 11,11,
2019, 1005 PEER REVIEW
x FOR 6 of
6 of 1919
Figure 2. The research design.
Figure 2. The research design.
3.2. Participants
3.2. Participants
A total of 65 first-year engineering students that enrolled in the physics course at Near East
University
A total of during the fall engineering
65 first-year semester ofstudents
the 2017–2018 academic
that enrolled yearphysics
in the were included
course atinNear
the East
study.
The students
University were
during therandomly
fall semesterassigned to the experimental
of the 2017–2018 academic year(n = were
33) and control
included in groups (n =
the study. 32).
The
The experimental
students were randomly groupassigned
studentstoconsisted of 20 males
the experimental (n =and33)13and
females,
controlwhile
groupsthe(n
control
= 32). group
The
consisted of group
experimental 17 males and 15consisted
students females. In of the experimental
20 males group, the
and 13 females, physics
while courses
the control wereconsisted
group conducted
ofin17a computer-based
males and 15 females. conceptInmapping environment
the experimental thatthe
group, wasphysics
integrated into were
courses the Google Classroom,
conducted in a
while in the control group, the traditional teaching method was applied
computer-based concept mapping environment that was integrated into the Google Classroom, while together with Google
inClassroom.
the control Both of the
group, the traditional
groups attended
teaching themethod
generalwas physics classtogether
applied twice a with
weekGoogle
(90 mins per week).
Classroom.
The of
Both twothegroups
groupsattended
attended thethe
class on different
general physics days.
class twice a week (90 mins per week). The two
groupsThe students
attended theinclass
the experimental group had not used the MindMup application before. Since the
on different days.
researcher was aninexpert
The students in the field ofgroup
the experimental physics,hadthe lessons
not used thewereMindMup
carried out by the researcher.
application Due to
before. Since
theresearcher
the ethical requirements
was an expertof the
inresearch,
the fieldthe names ofthe
of physics, thelessons
studentswerewerecarried
kept confidential.
out by the The students
researcher.
in the
Due experimental
to the group brought
ethical requirements their
of the laptopsthe
research, to the
namesclassofand
thethe MindMup
students wereapplication was installed
kept confidential. The
on eachin
students laptop.
the experimental group brought their laptops to the class and the MindMup application
was installed on each laptop.
3.3. Concept Mapping Application
3.3. Concept
In thisMapping Application(www.mindmup.com), which is a free online concept mapping tool that
study, MindMup
canIn
bethis
integrated with Google
study, MindMup Drive, was used. Withwhich
(www.mindmup.com), the MindMup application,
is a free online conceptanmapping
unlimited number
tool that
of concept maps can be created and stored, and they can be accessed from a browser or
can be integrated with Google Drive, was used. With the MindMup application, an unlimited number a mobile device
ofindependent
concept maps of time andcreated
can be space. and
The concept mapsthey
stored, and can can
be collaboratively
be accessed fromedited, shared, or
a browser anda exported
mobile
in different formats (e.g., PNG, HTML, FreeMind) with the MindMup application. The
device independent of time and space. The concept maps can be collaboratively edited, shared, andapplication can
work onin
exported a desktop,
differenttablet,
formatsand(e.g.,
mobile browsers
PNG, HTML,without any problems.
FreeMind) with the MindMup application. The
application can work on a desktop, tablet, and mobile browsers without any problems.Sustainability 2019, 11, x FOR PEER REVIEW 7 of 19
Sustainability 2019, 11, 1005 7 of 19
3.4. Experimental procedure
3.4. Experimental Procedure
The researcher created virtual classes for both the experimental group and the control group for
the General Physics-I course
The researcher created in Google
virtual Classroom.
classes for The virtual class
both the experimental groupcodes thatcontrol
and the were group
createdforwere
the
then sent
General to the students
Physics-I via
course in e-mail.Classroom.
Google The students
Theused theclass
virtual respective codewere
codes that and then registered
created to their
were then sent
classes.
to In the experimental
the students via e-mail. Thestudy, the General
students used thePhysics-I
respectivetopics
codethat
andwere
thentaught in both
registered groups
to their were
classes.
thethe
In same.
experimental study, the General Physics-I topics that were taught in both groups were the same.
Experimentalgroup:
Experimental group:The
Thestudy
studydesign
designused
usedininthe
theexperiment
experimentgroup
groupisispresented
presentedin inFigure
Figure3.3.
Figure 3. The experiment group study design.
Figure
Stage 1. The instructor using the3.MindMup
The experiment group study
application design.
prepared a concept map that consisted of
concepts within the subject (Concept Map-A). The concepts were placed on this map, but the relationships
Stage 1. The instructor using the MindMup application prepared a concept map that consisted
between the concepts were left blank. A list of relations that included the relations between the concepts
of concepts within the subject (Concept Map-A). The concepts were placed on this map, but the
was also prepared. The list of relations and Concept Map-A were shared in a Google Classroom that was
relationships between the concepts were left blank. A list of relations that included the relations
created for the experimental group (Figure 4). The students individually placed the relations between
between the concepts was also prepared. The list of relations and Concept Map-A were shared in a
the concepts on the map and then shared it with the instructor through Google Drive before the class by
Google Classroom that was created for the experimental group (Figure 4). The students individually
the submission date that had been determined by the instructor. Thus, the instructor learned about the
placed the relations between the concepts on the map and then shared it with the instructor through
students’ misconceptions and prior knowledge on the subject before the class.
Google Drive before the class by the submission date that had been determined by the instructor.
Thus, the instructor learned about the students’ misconceptions and prior knowledge on the subject
before the class.Sustainability 2019,
Sustainability 2019, 11,
11, 1005
x FOR PEER REVIEW 88 of
of 19
19
Sustainability 2019, 11, x FOR PEER REVIEW 8 of 19
Figure 4. Sample Concept Map-A sent to students and relation list.
Figure 4. Sample Concept Map-A sent to students and relation list.
Figure 4. Sample Concept Map-A sent to students and relation list.
Stage 2.
Stage 2. During
During the
the class
class hour,
hour, aa discussion environment was
discussion environment was provided
provided inin relation
relation toto the
the concept
concept
Stage
maps (Concept 2. During
(Concept Map-A) the class
Map-A) that hour,
that were a discussion
were completed
completed by environment
by the
the students, was
students, and provided
and the in relation
the misconceptions to
misconceptions thatthe concept
that were
were
maps
maps (Concept
determined were Map-A) thatSubsequently,
corrected. were completed the by the students,
instructor taught andsubject.
the the misconceptions that were
determined were corrected. Subsequently, the instructor taught the subject.
determined
Stage 3.3.were corrected.
In this
this stage, the
theSubsequently, the instructor
instructor shared
shared the second
secondtaught
mapthe subject.
(concept Map-B) in in Google
Google Class
Class in
in
Stage In stage, instructor the map (concept Map-B)
Stage
which the 3. In
theconceptsthis
conceptswerestage,
wereleftthe instructor
leftblank
blankandandtheshared the
therelations second
relationsbetween
between mapthe(concept
subject Map-B)
were in
placed Google Class in
which the subject were placed on onthethe
map map to
to be
which
be filledthe
inconcepts
by the were left
students blankthe
during andclass.
the relations
The between
instructor alsothe subject
shared thewere placed
concept list on
withthestudents
map to
filled in by the students during the class. The instructor also shared the concept list with students in
be
in filled
Google in by the students
Classroom during
(Figure the
Theclass.
5). students The instructorthe
students alsoconcepts
shared the concept sent
list with students
Google Classroom (Figure 5). The placedplaced
the concepts and thenandsentthen
them to the them to the
instructor.
in Google
instructor. Classroom
Theanalysed (Figure
instructor 5). The students placed the concepts and then sent them to the
The instructor the analysed
concept mapsthe concept
through maps through
drive and driveappropriate
then gave and then gave appropriate
feedback.
instructor.
feedback. The instructor analysed the concept maps through drive and then gave appropriate
feedback.
Figure 5. Concept
Figure 5. Concept Map-B
Map-B sample
sample sent
sent to
to students
students and
and concept
concept list.
list.
Figure 5. Concept Map-B sample sent to students and concept list.
Stage 4. (The last 30–40 min of the lesson): In the last hour of the lesson, problem solving
Stage 4. (The last 30–40 minutes of the lesson): In the last hour of the lesson, problem solving
activities
Stage that were last
4. (The related to the
30–40 subjectofwere carried out. Thelast
problem of
solutions wereproblem
performed with
activities that were related tominutes
the subject the lesson):
were carriedIn out.
the Thehour
problemthe lesson,
solutions solving
were performed
the MindMup
activities application (Figure 6). Each student shared their solutions to the instructor through
with the that were related
MindMup to the(Figure
application subject 6).
were carried
Each out. shared
student The problem solutions to
their solutions were
theperformed
instructor
Google
with Classroom.
the Google
MindMup application (Figure 6). Each student shared their solutions to the instructor
through Classroom.
Stage
through 5. Within
Google two days, the instructor provided feedback to students individually on their
Classroom.
Stage 5. Within two days, the instructor provided feedback to students individually on their
problem
Stage solving and analysis
5. Within of the
the problem with MindMup.
problem solving and two days,
analysis of the instructor
problem withprovided
MindMup.feedback to students individually on their
problem solving and analysis of the problem with MindMup.
Problem: A 1000-kg car traveling north collides with a 2000-kg truck traveling east. The
Problem:
occupants, A 1000-kg
wearing car are
seat belts, traveling north
uninjured, butcollides
the two with a 2000-kg
vehicles truckfrom
move away traveling east.point
the impact The
occupants, wearing seat belts, are uninjured, but the two vehicles move away from the impact pointSustainability 2019, 11, 1005 9 of 19
Problem:
Sustainability A 11,
2019, 1000-kg car traveling
x FOR PEER REVIEW north collides with a 2000-kg truck traveling east. The occupants,
9 of 19
wearing seat belts, are uninjured, but the two vehicles move away from the impact point as one. The
as one. The
insurance insurance
adjuster asksadjuster asks
to find the to findof
velocity the velocity
the of the
wreckage justwreckage just after
after impact. Whatimpact. What is [50].
is the answer? the
answer? [50].
Figure6.6.A
Figure A student
student problem
problem solving
solving with the MindMup application.
application.
Control
Controlgroup: Theinstructor
group: The instructorsent
sent
thethe
listlist of concepts
of concepts that were
that were foundfound in Concept
in Concept Map-A,Map-A,
which
which was shared with the experimental group of students through the Google
was shared with the experimental group of students through the Google Classroom that was createdClassroom that
was created
for the for group
control the control group
in order in order
to ensure thattotheensure thatwere
students the students
aware of were aware of
the concepts the concepts
before coming
before coming to class. Therefore, it was attempted to make the same pre-class preparation
to class. Therefore, it was attempted to make the same pre-class preparation with the experimental with the
experimental and with the control
and with the control group of students.group of students.
The
Thecourses
coursesin inthe
thecontrol
controlgroup
groupwere
were carried
carried out with the traditional
traditional teaching
teaching method.
method.Problem
Problem
solving activities comprised the last 30-min of the course.
solving activities comprised the last 30-minutes of the course.
Concept
Conceptmapsmapswere
werenot
notused
used before
before class, during lectures,
lectures, or
or during
duringthe
theproblem
problemsolving
solvingstages.
stages.
3.5.
3.5.Data-Collecting
Data-CollectingTools
Tools
3.5.1.
3.5.1.Physics
PhysicsConcept
ConceptTest
Test(PCT)
(PCT)
The
ThePhysics
PhysicsConcept
Concept Test Test(PCT)
(PCT) was was developed
developed by by the researcher who
the researcher who is is an
an expert
expertin inthe
thefield
field
ininorder to determine the misconceptions of the students. The resource
order to determine the misconceptions of the students. The resource books that were used in thebooks that were used in
the General
General Physics-I
Physics-I course
course were
were examined.
examined. AA PCTconsisting
PCT consistingofof3030multiple
multiplechoicechoicequestions
questionswas was
prepared on the topics that were going to be taught in the experimental process.
prepared on the topics that were going to be taught in the experimental process. There were five There were five options
for each question
options in the PCT,
for each question which
in the PCT, was consisted
which of two stages.
was consisted of twoInstages.
the second
In thestage,
second thestage,
students
the
were asked to give a brief explanation of their answers. Therefore, the test
students were asked to give a brief explanation of their answers. Therefore, the test can provide can provide reliable and
valid results
reliable andby reducing
valid results student guessing.
by reducing Threeguessing
student faculty members from the
. Three faculty field of Physics
members from theeducation
field of
examined the PCT in
Physics education order tothe
examined ensure
PCT content
in ordervalidity.
to ensureAfter the validity.
content examination,After making necessary
the examination,
corrections that are corrections
making necessary in line withthat the are
views of the
in line experts
with validated
the views of thethe test. validated the test.
experts
AApilot implementation was carried out in order to perform
pilot implementation was carried out in order to perform validity validity and reliability analyses
and reliability before
analyses
the actual
before theimplementation
actual implementationof the PCT that
of the PCThadthat
been
hadcorrected. The pilot
been corrected. Theimplementation
pilot implementationwas carried
was
out with the students who had taken the General Physics-I course before and
carried out with the students who had taken the General Physics-I course before and with 60 students with 60 students in
their second
in their secondyear of education.
year of education. TheTheitem
itemdifficulty
difficulty(p)
(p)and
anddiscrimination
discrimination (r) (r) of the questions
questionswere were
calculated
calculatedininorder
orderto to
increase
increasethethe
content
contentvalidity of the
validity of PCT. The item
the PCT. difficulty
The item indexindex
difficulty (p) is the
(p) correct
is the
answer
correctrate of the
answer item
rate of and it canand
the item be any
it canvalue between
be any value0 between
and 1, and it can
0 and 1, be
andanyit value
can bebetween
any value −1
and +1 of −1
between theanditem+1discrimination index [51]. index
of the item discrimination As a result of athe
[51]. As analyses,
result of the the items the
analyses, with a difficulty
items with a
difficulty index (p) of 0.82 and 0.85 were removed from the test. Therefore, two questions were
removed and the PCT that was formed of 34 multiple choice questions was finalized. The Kuder–
Richardson coefficient 20 was calculated as 0.82 for the reliability of the measurements that wereSustainability 2019, 11, 1005 10 of 19
index (p) of 0.82 and 0.85 were removed from the test. Therefore, two questions were removed and the
PCT that was formed of 34 multiple choice questions was finalized. The Kuder–Richardson coefficient
20 was calculated as 0.82 for the reliability of the measurements that were obtained from the PCT
test, in which the item analysis was carried out. A reality coefficient of above 0.70 indicates that the
measurement carried out by the test is reliable [52]. Thus, it has been determined that the PCT that
was formed of 30 items was a reliable and valid assessment tool. The PCT that was developed was
used as a pre-test before the implementation in order to determine whether the experiment and control
group students’ conceptual knowledge was equal and it was subsequently used as a post-test in order
to measure the misconceptions after the experimental process. The PCT includes subjects, such as
force-movement, repulsion, power, and linear momentum.
3.5.2. Problem Solving Inventory (PSI)
A Problem Solving Inventory (PSI) has been used in this study to determine the effects of physics
teaching with CBCM that was integrated with Google Classroom on students’ problem solving
skills. A Problem Solving Inventory is a self-assessment scale that measures the self-perception of an
individual’s problem solving skills. Heppner and Petersen developed the PSI that has been used in the
study [53], and it was adapted to Turkish by Sahin, Sahin, and Heppner [54]. PSI is an assessment tool
that is formed of 32 items and a six-point Likert scale (1 = never, 2 = rarely, 3 = sometimes, 4 = often,
5 = usually, 6 = always) and the Cronbach’s alpha reliability coefficient of the PSI was calculated as
0.88, while the reliability coefficient was 0.85. There are six sub-dimensions that are found in the PSI,
which are: Impulsive (13, 14, 15, 17, 21, 25, 26, 30, 32), Reflective (18, 20, 31, 33, 35), Problem solving
Confidence (5, 23, 24, 27, 28, 34), Avoidant style (1, 2, 3, 4, 11), Monitoring (6, 7, 8), and Planfulness (10,
12, 16, 19). The Cronbach’s alpha coefficients of the sub-dimensions are calculated as 0.74, 0.73, 0.72,
0.66, 0.76, and 0.69, respectively. The items that are numbered 9, 22, and 29 have not been included in
the calculation. The score range is 32–192. The high level of the total scores on the scale indicates that
the individuals perceive themselves as insufficient in problem solving. In short, the problem solving
score is inversely proportional to the problem solving skill. PSI was used as a pre-test before the
experimental study and as a post-test after the study for the experimental and control group students.
3.5.3. Semi-Structured Interview
The researcher developed a semi-structured interview form in order to determine the students’
views towards the physics teaching with CBCM that was integrated with Google Classroom.
While preparing the interview questions, the existing studies on computer-based concept maps
in the literature were used [55,56] in order to provide content validity. After the interview questions
were prepared, they were presented to two educational technology experts and two training program
specialists in order to determine the comprehensibility and suitability. The necessary arrangements
were made according to the feedback from the four experts to whom the interview questions were
presented and then the questions were finalized. The interviews were conducted face to face with 17
volunteer students from the experimental group after the experimental implementation. In order to
prevent data loss, the interviews were recorded and then transcribed.
3.6. Data Analysis
During the data analysis, as a first step, a test of normality was applied to the experimental and
control group of students, namely the Kolmogorov–Smirnov test. Parametric techniques were used
because test scores had a normal distribution.
Individual sample t-test and ANCOVA were conducted in order to determine whether there was a
statistically significant difference between the experimental group and control group regarding physics
misconceptions and problem solving skills. An alpha level of 0.05 was used for all statistical tests.
The content analysis method was applied to the qualitative data obtained from the semi-structural
interviews that were conducted with the experimental group. The interviews with each student hadSustainability 2019, 11, 1005 11 of 19
duration of between four and six minutes and all were recorded. The students’ names were marked
as S1, S2, S3, . . . in order to follow the ethical guidelines of the research. The appropriateness of the
coding in the study was presented to two experts for peer review. Experts agreed on all codes. In order
to increase the reliability of the study, some of the data that were obtained were presented using the
direct citation method to present student opinions.
4. Results
A pre-test on Physics concepts and Problem Solving Inventory was conducted before the
four-week teaching experiment began, and when the experiment had been completed, a post-test was
done on Physics Conceptions and Problem Solving Inventory. Semi-structured interviews were also
conducted with the experimental group.
4.1. Physics Conceptions
Before the start of the learning activities, the PCT was applied as a pre-test to determine whether
the experimental and control groups were equal regarding their physics misconceptions. Based on
the PCT pre-test results of the experimental and control groups, an independent sample t-test was
conducted (Table 1).
Table 1. The pre-test of Physics Concept Test (PCT).
Group N Mean SD t p
Experiment 33 9.97 5.07 1.201 0.234
Control 32 8.56 4.33
Significant at the 0.05 level.
The statistical results revealed that the results of the physics conceptions pre-test did not
significantly differ between the control and the experiment groups (t = 1.201, p > 0.05).
This finding indicates that the experimental and control groups were equal regarding physics
conceptions information before the experimental implementation. In the study, PCY was applied as a
post-test in order to determine whether there were any changes in the level of physics misconceptions
of the experimental and control groups after the experimental process had been completed (after four
weeks). An independent sample t-test was conducted on the PCT post-test results of the experimental
and control groups (Table 2).
Table 2. The post-test of PCT.
Group N Mean SD t P
Experiment 33 14.06 6.00 2.245 0.028
Control 32 11.00 4.92
Significant at the 0.05 level.
The statistical results revealed that the results of the physics conceptions post-test significantly
differed between the control and the experiment groups (t = 2.245, p < 0.05). According to this result,
it can be concluded that the teaching in the CBCM environment integrated to Google Classroom can
reduce the students’ misconceptions and provide meaningful learning.
4.2. Problem Solving Skills
ANCOVA was used in this study to examine the effect of the CBCM learning environment that
was integrated into Google Classroom on the students’ problem solving skills. The pre-test scores
were taken as covariate, while the post-test scores were taken as dependent variables. The normality
test, namely the Kolmogorov–Smirnov test, was applied to the data that were obtained from PSI,
and it has been found that they exhibited a normal distribution. After the hypothesis of normality,Sustainability 2019, 11, 1005 12 of 19
the homogeneity of group variances was checked by the Levene test and no statistically significant
difference was observed (p > 0.05). Descriptive statistics of the PSI pre-test and PSI post-test scores that
were applied to the experimental and control groups are presented in Table 3.
Table 3. The descriptive statistics for scores of the Problem Solving Inventory (PSI).
Pre-Test Post-Test
Dimension Group N
Mean SD Mean SD
Experiment 33 17.58 3.49 10.70 3.68
Impulsive style
Control 32 17.94 3.27 17.84 4.75
Experiment 33 11.64 2.07 14.18 3.58
Reflective style
Control 32 11.59 2.03 11.63 2.30
Problem solving Experiment 33 12.70 2.78 12.73 2.57
confidence Control 32 12.59 2.54 12.72 3.09
Experiment 33 8.91 2.36 5.36 1.90
Avoidant style
Control 32 10.00 2.94 10.06 3.37
Experiment 33 6.79 2.10 7.00 2.51
Monitoring
Control 32 6.19 2.12 6.28 2.48
Experiment 33 8.64 2.43 8.70 2.44
Planfulness
Control 32 8.78 2.21 8.72 2.44
Experiment 33 66.24 9.31 58.67 10.92
Total
Control 32 67.09 7.40 67.25 8.34
The adjusted means of the pre-test were determined so that the PSI post-test scores of the students
of the experimental and control groups could be compared. The average post-test means and the
adjusted means of the groups are presented in Table 4 for comparison.
Table 4. PSI post-test means and the adjusted means.
Dimension Group N Mean Adjusted Mean
Experiment 33 10.70 10.87
Impulsive style
Control 32 17.84 17.67
Experiment 33 14.18 14.16
Reflective style
Control 32 11.63 11.65
Problem solving Experiment 33 12.73 12.69
confidence Control 32 12.72 12.76
Experiment 33 5.36 5.83
Avoidant style
Control 32 10.06 9.58
Experiment 33 7.00 6.68
Monitoring
Control 32 6.28 6.62
Experiment 33 8.70 8.76
Planfulness
Control 32 8.72 8.65
The results of the ANCOVA test, indicating whether the difference between the adjusted means
of the post-test of the groups was significant, have been presented in Table 5.Sustainability 2019, 11, 1005 13 of 19
Table 5. Results of Covariance Analysis of PSI post-test averages of the Experimental and Control Groups.
Sum of Mean of
Source of Variance Dimension SD F p
Squares Squares
Controlled variable (PSI pre-test) 681.536 1 681.536 93.973 0.000
Group Impulsive 747.983 1 747.983 103.135 0.000
Error style 449.652 62 7.252
Total 15,096.000 65
Controlled variable (PSI pre-test) 374.662 1 374.662 116.292 0.000
Group Reflective 102.030 1 102.030 31.669 0.000
Error style 199.747 62 3.222
Total 11,536.000 65
Controlled variable (PSI pre-test) 305.843 1 305.843 93.331 0.000
Problem
Group 0.096 1 0.096 0.029 0.865
solving
Error 203.172 62 3.277
confidence
Total 11,031.000 65
Controlled variable (PSI pre-test) 333.685 1 333.685 154.592 0.000
Group Avoidant 219.689 1 219.689 101.779 0.000
Error Style 133.826 62 2.158
Total 4657.000 65
Controlled variable (PSI pre-test) 339.015 1 339.015 393.221 0.000
Group 0.055 1 0.055 0.63 0.802
Monitoring
Error 53.453 62 0.862
Total 3272.000 65
Controlled variable (PSI pre-test) 264.543 1 264.543 147.903 0.000
Group 0.182 1 0.182 0.102 0.751
Planfulness
Error 110.895 62 1.789
Total 5304.000 65
According to Table 5, the results for the experimental and the control groups showed that there
was a significant difference between the adjusted post-test means of the groups when the PSI’s pre-test
scores of the “Impulsive style” (F(1,62) = 103.135, p < 0.05) and “Avoidant style“ (F(1,62) = 101.779,
p < 0.05) dimensions were taken under control. The calculated eta-squared values for the determination
of the effect size of this difference were found to be (η2 ) 0.602 and (η2 ) 0.714, respectively. As these
values are greater than 0.14, this shows that the power of the effect is high.
According to these results, there was a significant decrease in the scores for the impulsive style
and avoidant style dimensions in the experimental group as compared to the control group. In other
words, it can be said that teaching in the CBCM environment integrated into Google Classroom is an
effective way of reducing students’ impulsive and avoidant approaches when solving problems.
It has been determined that there was no significant difference between the groups’ adjusted
post-test means when the PSI’s “Problem solving confidence” (F(1,62) = 0.029, p < 0.05), “Monitoring”
(F(1,62) = 0.63, p < 0.05), and “Planfulness” (F (1,62) = 0.102, p < 0.05) dimensions’ pre-test scores were
taken under control. In other words, it can be said that the students who are being taught with CBCM
do not have any influence on their problem solving confidence. A significant difference was found
between the adjusted post-test means of the groups (F (1,62) = 31.669, p < 0.05) when the pre-test scores
of the PSI’s “Reflective style” dimension were controlled. The calculated value of eta squared (η2 ) was
0.652, which indicates the effect size of this difference. If this value is greater than 0.14, it indicates that
the power of influence is high. According to this result, the scores of the experimental group in the
“Reflective style” dimension significantly increased when compared to the control group. Based on this
finding, it can be said that teaching with CBCM that is integrated into Google Classroom has a positive
effect in improving the reflective style of students while solving problems.Sustainability 2019, 11, 1005 14 of 19
4.3. Students’ Perceptions
Semi-structured interviews were conducted with 17 volunteer students in the experimental group
to determine their perceptions towards teaching in the CBCM environment integrated with the Google
Classroom. The first question asked what the benefits of teaching in this environment were. The second
question was about the problems in this environment and the third question was about the suggestions
of the students for tackling these problems. The codings that were obtained after examining the
qualitative data gathered from the students’ answers and the frequencies of these codings have been
presented in Table 6.
Table 6. Students’ perceptions of the computer-based concept mapping (CBCM) environment
integrated with Google Classroom.
Context Code Frequency
Enhanced sustainability of problem solving activities. 16
Enhanced sustainability in learning 14
Enabling the correction of the old concepts that have
13
Benefits been learned incorrectly
Providing a link between prior and new information 10
Making problem solving entertaining 7
Increasing self-confidence towards the course. 7
I did not experience any difficulty. 13
Difficulties Difficulty in learning the MindMup application 4
Not having previous experience in concept mapping 3
Being trained for the use of MindMup application for
Solution Recommendations 4
a longer time
According to the codes under the context of the benefits of the environment, the majority of
the students (f = 16) indicated that teaching with CBCM enhanced the sustainability of problem
solving activities. Some of the students (f = 14) stated that it enhanced sustainability in meaningful
learning, while some of them (f = 13) stated that it enables the correction of old concepts that have
been incorrectly learned.
Similarly, a majority of the participants (f = 10) emphasized that CBCM provides a link between
prior and new information. The students (f = 7) stated that it provides meaningful learning by embodying
abstract concepts and they also stated (f = 7) that it increases their self-confidence towards the course.
Some examples from the students’ statements are, as follows:
“It has enabled me to link my prior knowledge and new knowledge. Thus, more meaningful
learning has occurred.” (S11)
“I always memorized information in physics classes. I did not know what the concepts
actually meant. I used to solve problems by placing the variables into the formulas. I can
understand the concepts with this approach.” (S4)
“I found out that some of the physics information that I learned in high school was wrong.
Therefore, I corrected my wrong knowledge.” (S9)
It has been revealed from the codings that are related to the context of difficulties experienced
in the environment that the majority of the students (f = 13) did not experience any difficulties in the
environment. Some of the students (f = 4) indicated that they experienced difficulties in learning the
MindMup application, while some of them (f = 3) indicated that they experienced difficulties, because
they had never used a concept map before. When the students were asked about recommendations forSustainability 2019, 11, 1005 15 of 19
solutions on the difficulties that are experienced in the CBCM environment integrated with Google
Classroom, some students (f = 4) stated that they needed to be trained in the use of MindMup
application for a longer time.
5. Discussion and Conclusions
In this study, the impact of the CBCM environment integrated with Google Classroom on students’
existing misconceptions, ability to learn new concepts correctly, and problem solving skills have been
investigated. Furthermore, the study examined the effect of CBCM on the sustainability of concept
teaching according to student views.
The research results have shown that the CBCM integrated with Google Classroom has enabled
the students to learn correctly by adjusting their misconceptions. We believe that result is because
every week the instructor prepared and shared Concept Map-A in advance with the students through
Google Classroom Concept Map-A. Resultantly, the students had the opportunity to review the old
concepts and test their knowledge.
Furthermore, instant feedback to the Concept Map-B in the classroom environment may have
prevented the misconceptions. In a similar study [20], it was stated that providing instant feedback in
concept learning had a significant effect on the meaningful learning of difficult concepts. Furthermore,
the opportunity for direct access to the information sources contributes to the visualization and
analysis of the abstract concepts and events on the concept maps that were created in the computer
environment. For instance, if the users do not understand a concept on the computer-based concept
mapping, they can access the information explaining the concept by clicking on the map with the
mouse. This result of the study is in line with studies that have determined that concept maps are
effective in eliminating misconceptions [57,58].
According to another result of this study, teaching in the CBCM environment has revealed that
the impulse and avoidance tendencies of the students in problem solving have decreased, while their
reflective style has increased. It is believed that having discussions regarding concept maps during the
concept learning affects the realization of the thinking activities. In support of this finding of the study,
Kinchin stated that discussing the concept maps enables students to think about the points that they
did not understand before [59]. Furthermore, it has been stated that the concept maps are effective
techniques in initiating the thinking process in problem solving, facilitating the correct definition
of problem solving, and directing students to alternative problem solving methods [22]. Elias and
Weissberg emphasized the importance of an effective thinking activity in every stage of problem
solving in order for the individual to be able to realize successful problem solving activities [60].
On the other hand, it is believed that giving individual feedback to the students regarding their
concept maps and problem solving on the Google Classroom has a positive effect on their problem
solving skills. In support of this finding, Demirel and Karakus Yilmaz emphasized in their studies that
feedback and activities were important factors in improving the students’ problem solving skills [61].
It has been revealed that teaching with CBCM did not have any effect on the students’ problem
solving confidence and their tendencies to be evaluative and organized. It is believed that the reason
for this result was due to the fact that CBCM teaching was carried out only for a period of four weeks.
According to another result of the research, the students indicated that teaching with CBCM enhanced
the sustainability of problem solving activities.
On the other hand, when the students’ views towards CBCM integrated with Google Classroom
have been analysed, it has been revealed that the students stated that their problem solving
performance increased and that they enjoyed the problem solving processes. It is believed that
visualizing their thoughts during the problem solving process on the MindMup application had an
effect on this result. In addition, the students stated that there was a decrease in their misconceptions.
Furthermore, the students also stated that using this application did not cause any difficulties for them.
This result is thought to be because the MindMup application is easy to use. Additionally, the students
stated that CBCM enhanced sustainability in meaningful learning.You can also read


