School District Funding in Virginia - Computing the Effects of Changes to the Standards of Quality Funding Formula - Urban Institute
←
→
Page content transcription
If your browser does not render page correctly, please read the page content below
EDUCATION POLICY PROGRAM

School District Funding in Virginia
Computing the Effects of Changes to the Standards of Quality Funding Formula

Cary Lou and Kristin Blagg
with Victoria Rosenboom, Victoria Lee, and Stipica Mudrazija
December 2018

Virginia’s distinctive school funding formula is made up of multiple funding streams.
Each program’s funding is determined based on the minimum cost of meeting program
and staffing requirements, or as specified in state guidelines. Responsibility for meeting
these funding obligations is split between the state and individual localities based on
each district’s ability to pay. In the 2017 school year, the state formula resulted in
slightly progressive cost-adjusted funding across districts in terms of students’ poverty
status, meaning students living in poverty are, on average, enrolled in school districts
with slightly higher per student spending. Students of color were also enrolled in
districts with slightly higher cost-adjusted funding per student than white students, on
average. In contrast, rural students were enrolled in districts with lower average per
student funding, in cost-adjusted dollars. Changes to the existing formula generally
produce modest effects on equity measures and often involve committing additional
state resources. Distributing state sales tax revenue earmarked for education more
progressively or computing the composite index using total population per capita
prosperity measures could result in large changes in equity without increasing state
funding.
Introduction
Although the structure of state school funding formulas can vary, these formulas largely determine the
amount of public funding that finances public primary and secondary education in different local school
districts (or “divisions” in Virginia) and how much comes from state, local, and, potentially, federal
sources. The specifics of state formulas can result in a more equitable or less equitable distribution of
public resources across districts in terms of students’ family income, race or ethnicity, and whether they
attend an urban or rural school. These disparities matter, as prior research has shown that it takes more
resources to educate disadvantaged students (Duncombe and Yinger 2005), and rural schools can be
more expensive to operate because of lower economies of scale.

    This brief explores the development, structure, and equity produced by Virginia’s school funding
formula and how changes within the framework would affect equity measures. Understanding how the
state’s school funding formula works and how it would behave under different scenarios is important
before considering or advocating for changes.

Background
Most state funding for public early childhood, primary, and secondary education in Virginia is provided
as part of the state’s Standards of Quality (SOQ). The SOQ and additional education provisions were
adopted in the state constitution in 1971 to counter school segregation (Delja 2004). These provisions
required local districts to operate free public schools and meet minimum standards for the first time.
They also charged the state with determining the cost of meeting these standards and assigning the
division of funding costs between the state and local districts (Delja 2004).1

    Initially, these costs were calculated by taking the average teacher salary statewide, multiplying this
by 57 full-time equivalent teachers per 1,000 enrolled students, and adding an average support cost per
student statewide (JLARC 2002). The current funding scheme, which has changed little since the 1988–
89 school year, accounts for more nuanced staffing standards, the cost of competing in higher-income
localities, and prevailing teacher salaries and support costs. Under this system, the state department of
education calculates the minimum amount of funding per student needed to feasibly meet the SOQ (e.g.,
required student-teacher ratios) in each district (Delja 2004). This amount is then multiplied by each
district’s enrollment and, after subtracting the local share of state sales tax revenue earmarked for
education, the resulting cost for each district is divided between local and state funds based on the
district’s ability to pay (Delja 2004).

    Shortly after implementing the new funding formula in the late 1980s, state policymakers and the
Coalition for Equity in Educational Funding, a group of district superintendents and school boards
largely from rural southern Virginia, wrestled over resource equity and discrepancies in district
spending. At the time, the state faced large budget deficits, which made it more difficult to argue for
additional funding.2 In 1992, the coalition filed suit against the state in Reid Scott v. Commonwealth of
Virginia, claiming that the state’s school funding formula violated the Virginia Constitution, as students

     2                                                       SCHOOL DISTRICT FUNDING IN VIRGINIA
in poorer, more rural districts received lower-quality public education compared with students living in
wealthier, more urban districts (Delja 2004). But both the circuit court in 1992 and the state supreme
court in 1994 on appeal ruled against the plaintiffs on the grounds that the state constitution did not
require equitable or near-equitable funding per student across districts (Delja 2004), while leaving the
door open for an adequacy lawsuit.3 Despite rulings against the coalition, the Scott case spurred
increased state education investments and bolstered the further adoption of state curriculum and
learning standards (Delja 2004). No other major litigation on Virginia’s school funding formula has taken
place since the 1994 Scott decision.4
Since 2000, funding disparities between richer and poorer districts and those in more suburban and
urban regions versus those in rural regions have persisted (Delja 2004; Jones, Donohue, and Shotwell
2009). The state’s Joint Legislative Audit and Review Commission (JLARC) argued in a 2002 report that
overall state funding should be increased and that the requirements and funding system set in the SOQ
were inadequate to fund an adequate, high-quality education (JLARC 2002). Budget deficits, combined
with Virginia’s negative fiscal outlook during periods of economic distress, have put downward pressure
on school funding, leading to formula changes that reduce the amount the state is responsible for
funding. For example, changes to the formula for the 2004–06 budget introduced the deduction of
certain federal revenues from the Basic Aid formula before the state and required local share of funding
are determined. Following the 2008 recession, the legislature implemented further cuts in response to
lower tax revenues and budget deficits, capping the number of support positions funded by the state,
only partially accounting for inflation increases, increasing the assumed life span of buses, and
eliminating selected district expenditures from calculations of the costs of providing public education
(Duncombe and Cassidy 2016a). These reductions disproportionately affected poorer districts (Cole
and Cassidy 2014). As the economic and fiscal outlook has brightened, some funding has been restored,
but the funding increases are not as targeted at poorer districts as were earlier cuts (Duncombe and
Cassidy 2016b).
Although Virginia has maintained the basic funding structure established in the late 1980s,
additional requirements—such as support costs and specialized programs, including special education;
remedial education; career and technical (vocational) education; gifted education; and textbook costs—
have been added to the SOQ program. But the way these costs are determined, apportioned, and
funded remain similar. The SOQ program continues to provide more than 80 percent of public
school funds, while smaller categorical, incentive, and lottery funding streams supplement district’s core
SOQ funding. These funding streams make up most public primary and secondary school funding from
the state and local levels. School construction costs historically received little state funding, with even
this small amount eliminated after the 2010 school year (Jones, Donohue, and Shotwell 2009). Only a
few public charter schools operate in the commonwealth,5 and the state’s private school tax credit
scholarship for low-income households has low enrollment relative to programs in other states despite
Virginia’s relatively large population.6
Virginia education groups and advocates have maintained that the way the state funds its schools
does not adequately account for the cost of providing a high-quality education for all students. In recent
SCHOOL DISTRICT FUNDING IN VIRGINIA 3years, almost all districts have spent more than is required by the state, with most far exceeding the
minimum funding standards established in the SOQ and other state programs.7 For example, nearly all
districts employed more support staff positions than the state cap imposed in 2009–10 allowed to be
funded in its first year of effect (Duncombe and Cassidy 2016a). Additionally, beyond specific cuts in
response to economic downturns, educational groups argue that the way the commonwealth calculates
prevailing costs as part of its biennial rebenchmarking process underestimates the actual amount of
funding districts need.8 Statewide, total local funding was $4 billion higher than local effort
requirements for SOQ programs in 2016–17, more than twice what the state required.9
Funding gaps between high- and low-income Virginia districts persist. The state ranks among
progressive states according to the Urban Institute’s measure of school funding progressivity, which
adjusts for variation in local costs using a comparable wage index, but the difference in per student
funding between poorer and richer districts is small in absolute terms. The average poor student lives in
a district that receives just $32 more in funding per student, in cost-adjusted dollars, than those where
the average nonpoor student lives—a small percentage of the $10,579 in per student funding for the
state as a whole.
When not adjusting for local cost differences, Virginia does less well. The state ranks poorly on
funding progressivity using a different measure of equity when not adjusting for local prices, though it
does better when accounting for these cost differences (Baker and Corcoran 2012). A more recent
analysis ranked Virginia in the bottom half of states in terms of funding fairness across various
measures (Baker, Farrie, and Sciarra 2018). Additionally, a report from the National Center for
Education Statistics (NCES) found that the highest-poverty quarter of districts in Virginia received 8.3
percent less combined federal, state, and local funding per student in 2014–15 than the lowest-poverty
quarter of districts in the state, one of the largest gaps nationally.10 The Commonwealth Institute also
calculated that Virginia ranks below average when adding together its various funding streams
targeting low-income students and comparing this amount with poverty weights in other states
(Duncombe and Cassidy 2016c). Finally, the state ranks low on measures of funding equity by race or
ethnicity.11
Virginia faces several challenges. The state has a growing and diversifying school-age population, as
Hispanic and immigrant students make up an increasing share (Driscoll and Salmon 2013). Consistent
with prior research in other states and nationally, there is a positive association between student
achievement and higher funding and fiscal capacity in Virginia.12 But poorer students receive little
targeted funding based on income, relative to other states, and tend to live in districts that receive
slightly more or around the same amount of state funding per student as their higher-income peers,
depending on the progressivity measure used. Additionally, at least one prior attempt to increase equity
and funding for poorer districts by raising state funding has met challenges, with districts pulling back
their local funding commitments (Driscoll and Salmon 2008).
4 SCHOOL DISTRICT FUNDING IN VIRGINIAThe Structure of Virginia’s Current
School Funding Formula
The framework for Virginia’s school funding formula has remained relatively constant since the late
1980s. The state department of education calculates the minimum funding needed for each district to
feasibly meet the standards established by the SOQ and other programs. This minimum calculation is
based on average costs in the state, along with staffing and other district requirements. The department
also determines the split between state and required local funding for each district (Delja 2004).
More than 85 percent of the $6.6 billion in state funding distributed in fiscal year 2017 is disbursed
through programs and funding streams that are part of the SOQ. Additional state funding comes from
programs funded by the state lottery (9 percent in 2017)13 or other funding streams, including incentive
and categorical programs (about 3 percent each).14 Incentive, categorical, and SOQ programs are
typically funded by the state’s general fund. Some incentive and lottery programs require local funding
matches (similar to the local share of funding calculated as part of the SOQ), but categorical programs
do not require matches.
For most funding streams, the state calculates a specific per student cost in each district, based on
the average prevailing cost of salary or services in the state (including a “cost of competing adjustment”
to staff salaries and fringe costs in districts with higher living costs or prevailing salaries), local
characteristics such as total enrollment, enrollment composition (i.e., distribution across schools and
grades, eligibility for free lunch, English language learners, and special education service need), and
performance on state testing standards. This per student amount is then multiplied by the district’s
enrollment to determine the program or funding stream’s funding. Finally, each funding stream or
program’s overall amount is divided between state funding and required local funding from the district
using a composite index of local ability to pay. Districts are allowed to provide funding beyond what is
required, and most districts do so.15
Benchmarking Costs
Every other year, Virginia benchmarks educational costs to adjust for changes in cost. This update
determines statewide prevailing salaries for instructional and support staff, prevailing nonpersonnel
support costs, and other factors. These benchmark changes subsequently affect SOQ, lottery, incentive,
and categorical funding by determining the statewide prevailing salaries for instructional and support
staff, prevailing nonpersonnel support costs, and other factors that determine funding amounts in
different programs and streams. Benchmarking builds off the preceding years’ education budget and
adjusts for changes in overall and specialized categories of student enrollment, free lunch eligibility
rates, district performance on state standards, staffing standards, salary adjustments, fringe benefit
costs and rates, support costs, inflation, sales tax revenues for education, and the composite index of
local ability to pay (Dickey 2017).
SCHOOL DISTRICT FUNDING IN VIRGINIA 5Determining the Share of Funding Required from Local Districts
For education funding that requires a local match or contribution, the state and local shares are
determined using a biennially calculated local composite index of local ability to pay. This index
accounts for each district’s aggregate property wealth, adjusted gross income, and taxable retail sales
per capita relative to the per capita figures for these metrics statewide.16 The statewide split between
state funding and required local funding is pegged at 45 percent, and the local share is capped at 80
percent for the SOQ and most other funding streams. But each locality is allowed to, and generally does,
go beyond funding its minimal required share, and there is no upper limit on the local funds each district
can provide (Delja 2004).
SOQ Funding
Most SOQ funding is distributed as Basic Aid, which accounts for the costs of general instruction,
support services, transportation, facilities, and some fringe costs, including health care. Additional non–
Basic Aid SOQ accounts are targeted for specific programs or students. Each district is required to fund
the share of the costs of each program specified by its composite index of local ability to pay,17 except in
Basic Aid, where sales tax revenues are subtracted from the overall cost estimate before the
determination of the state-local split.
To calculate Basic Aid funding, the state determines the minimum number of teachers and other
instructional positions that are required to meet the minimum student-teacher ratios set forth in the
SOQ.18 To determine funding, these minimum staff numbers are multiplied by the average statewide
prevailing wage for each position type. Some districts are assigned higher salary rates to account for
greater competition.19 The cost of support personnel is calculated separately and is based primarily on
districts’ overall enrollment: the number of funded positions per 1,000 students is multiplied by district
enrollment and prevailing salary for each position type (including a cost of competing adjustment as
needed) with the total number of support positions capped based on a ratio to instructional positions
(Dickey 2013).20 Similarly, nonpersonnel support costs are calculated by multiplying district enrollment
by the state prevailing per student cost of providing these services.21
The total district personnel and support costs are added together and divided by unadjusted
enrollment to determine the unadjusted per student amount of Basic Aid. After a few additional
adjustments to the per student amount and removing applicable federal revenues for support costs,22
the resulting adjusted per student amount of Basic Aid is multiplied by adjusted enrollment to
determine each district’s total cost of Basic Aid.23 Finally, after subtracting the local share of revenue
earmarked for education from state sales tax, which is apportioned to each district based on its share of
the school-age population, the resulting cost for each district is divided between local and state funds
based on the district’s ability to pay (composite index) (Delja 2004).
Additional SOQ programs include prevention, improvement, and remediation funding streams for
low-income students and those at risk of falling behind ($114 million, or 2 percent of state SOQ funds in
2017); special education for students with special needs or disabilities ($382 million, or 7 percent of
6 SCHOOL DISTRICT FUNDING IN VIRGINIAstate SOQ funds in 2017); career and technical education (CTE, also known as vocational education) and
gifted programs (each around 1 percent of 2017 state SOQ funding); line items for English as a second
language (ESL) and textbooks, both of which have been partially or wholly funded via the lottery in some
years; and additional fringe costs for instructional positions ($609 million, or 11 percent of state SOQ
funds in 2017).
Prevention, improvement, and remediation; special education; CTE; and ESL funding are provided
based on the number of students in categories eligible for these services (or participating in the
programs), along with program staffing standards and instructor costs.24 But gifted education is funded
at the cost of providing one full-time instructional position per 1,000 students in the district’s overall
enrollment, meaning that it is not adjusted based on eligibility or participation. Similarly, textbooks are
funded at a flat per student rate based on the statewide average or prevailing cost of textbooks in
previous years. Fringe benefit costs, such as retirement, Social Security, and group life insurance
contributions for instructional positions, are funded as the state share of the cost of the district’s
employer contributions in these programs.25
Lottery revenues provide funding for programs and accounts previously financed out of the general
fund and provide split or total funding for selected SOQ accounts in some years (Dickey 2013). Several
lottery-funded programs target low-income, at-risk, or other special needs students, and most have a
required local match. At-risk funding targets low-income students and is calculated as a percentage add-
on to the district Basic Aid amount, ranging from 1 to 13 percent for each student estimated to be
eligible for federal free lunch. The per student percentage add-on is based on the share of students
eligible for free lunch in the past three years, with a higher percentage for districts with higher shares of
low-income students.
K–3 Primary Class Size Reduction Program payments are distributed to districts to help fund
reductions in class sizes in early primary grades based on the marginal cost of these reductions with
lower student-teacher ratios and maximum class sizes required for districts with higher shares of free
lunch–eligible students.26 The Virginia Preschool Initiative uses lottery funds to provide preschool
services to at-risk 4-year-old children not served by Head Start. The program allocates $6,125 for each
4-year-old estimated to be low income and not served by Head Start based on the share of students
eligible for free lunch.27 Lottery revenues also fund other programs, which in 2017 included tuition
reimbursement for districts with certain special education students attending regional special
education schools in other districts, split funding for regular special education and textbooks,28 foster
care, reading and math programs, school breakfast, foster care, additional CTE funds, alternative
education, graduation and GED initiatives, teacher training and mentorship, and supplemental
unrestricted funds.29
Equity under the Current Formula
In fiscal year 2017, Virginia spent $6.57 billion on school funding (45 percent of total state and local
funding), and districts contributed an additional $8.02 billion.30 The average cost-adjusted per student
SCHOOL DISTRICT FUNDING IN VIRGINIA 7funding from the state and districts combined was $10,579.31 To better understand how Virginia’s at-
risk and other provisions relate to funding for different students, we analyze the fiscal year 2016–17
state funding formula and 2016–17 school year funding for SOQ, incentive, categorical, lottery, and
other programs using an equity measure developed by the Urban Institute (Chingos and Blagg 2017).
This measure looks at school funding progressivity in each state by calculating estimates of average
spending, in cost-adjusted dollars, on poor students (students from families below the federal poverty
level) relative to nonpoor students. We adapt this measure to look at two additional measures of equity:
funding for students of color relative to white students and funding for students in rural schools relative
to students in urban schools.
We use district-level data because the state funding formula typically allocates dollars to districts,
not to schools. We do not capture any differences in spending across schools within districts (and across
students within schools). For example, poor students may benefit from programs or targeted revenue
streams not available to nonpoor students. Conversely, nonpoor students may attend schools with
more highly paid teachers or enroll in courses that are more expensive to provide than the schools poor
students are enrolled in within the same district.
To calculate the average distribution of funding for poor and nonpoor students, we use district-level
poverty data from the US Census Bureau’s Small Area Income and Poverty Estimates to estimate the
share of children ages 5 to 17 who are from low-income families in each district.32 We merge these data
with district-level state and local funding levels from the Virginia Department of Education (VDOE),
adjusted for local costs.33 We calculate a weighted average of each district’s per student funding using
the number of poor children in each district as the weight.34 Then, we calculate the same weighted
average using the number of nonpoor children in each district. The average poor student lives in a
district that receives $32 or 0.3 percent more in per student funding, in cost-adjusted dollars, than the
average nonpoor student. Poor children live in districts that receive $10,607 in per student funding, and
nonpoor children live in districts that receive $10,575 in per student funding.
8 SCHOOL DISTRICT FUNDING IN VIRGINIABOX 1
Calculating Equity Measures
This simplified example best explains our equity measure calculation. In this example, the state has only
two districts, A and B, each with 100 students.
District A District B
$10,000 per student $13,000 per student
10 poor, 90 nonpoor students 30 poor, 70 nonpoor students
District B is located in an area where there are higher wages because of increased living costs, so they
will likely need to spend more on teacher and staff salaries (a key driver of cost in education). We use
the Comparable Wage Index to adjust the per student amount down to account for this difference.
District A District B
$10,000 per student $13,000 per student
$10,000 per student, cost-adjusted $12,000 per student, cost-adjusted
10 poor, 90 nonpoor students 30 poor, 70 nonpoor students
Next, we compute a weighted average funding level for poor and nonpoor students.
Poor: (10 students from A x $10,000) + (30 students from B x $12,000) = $11,500 per student
10 students from A + 30 students from B
Nonpoor: (90 students from A x $10,000) + (70 students from B x $12,000) = $10,875 per student
90 students from A + 70 students from B
The difference between these two average per student amounts constitutes our measure of equity.
$11,500 per poor student – $10,875 per nonpoor student = $625
Thus, in our simplified example, we estimate that the average poor student lives in a district that
receives $625 more per student than the average nonpoor student.
To calculate the equity measure for students of color and white students, we use district-level race
and ethnicity data from the Common Core of Data to calculate the number of students of color and
white students. We calculate the equity measure for these two groups the same way we compute it for
poor and nonpoor students, weighting by student enrollment in each district and again adjusting for
variation in local costs. The average student of color in Virginia attends a district that receives $16 or
0.2 percent more in per student funding, in cost-adjusted dollars, than the average white student. The
average student of color attends a district that receives $10,588 in per student funding, and the average
white student attends a district that receives $10,571 in per student funding.
To calculate the equity measure for students attending schools in rural areas and students
attending schools in urban areas, we use school-level data from the Common Core of Data on student
enrollment in schools in either a rural or urban area.35 The rest of our calculations follow the same
SCHOOL DISTRICT FUNDING IN VIRGINIA 9process we used to calculate the equity measure for poor and nonpoor students. We merge data with
VDOE finance data and calculate weighted averages of districts’ per student funding for students
attending rural schools and students in urban schools. The average student attending a rural school
receives $329 or 3.1 percent less in per student funding, in cost-adjusted dollars, than students
attending an urban school. Students attending rural schools receive an average of $10,354 in per
student funding, and students attending urban schools receive an average of $10,683 in per student
funding.
FIGURE 1
Cost-Adjusted District Funding Average Student Receives in Virginia
Average funding per student
$10,800
$10,700
$10,600
$10,500
$10,400
$10,683
$10,300 $10,579 $10,575 $10,607 $10,588
$10,571
$10,200
$10,354
$10,100
$10,000
Student Student not in Student in White student Student of Student Student
poverty poverty color attending attending rural
urban school school
URBAN INSTITUTE
Source: Urban Institute analysis of Virginia Department of Education school finance data, the National Center for Education
Statistics (NCES) Common Core of Data, and Census Bureau Small Area Income and Poverty Estimates.
Note: Cost adjustments made using NCES Comparable Wage Index.
Hypothetical Changes to Virginia’s School
Funding Formula and Potential Outcomes
Before pushing for changes, it is necessary to understand the potential effects of amending Virginia’s
school funding formula on the total cost of education, the share financed by the state and local districts,
and equity for different groups.36 Altering different parameters in the formula could increase or
10 SCHOOL DISTRICT FUNDING IN VIRGINIAdecrease overall costs, raise or lower the share financed by the state versus local districts, and be more
equitable or less equitable in terms of students’ race or ethnicity, family income, and enrollment in an
urban or rural school. Virginia could consider how different measures of prosperity and population are
weighted when calculating each district’s composite index, whether to cap the required local share and
at what level, whether the local share of the state’s poor school-age children should be accounted for in
sales tax revenue distributions, whether to fund cost of competing adjusted salaries in selected districts,
and the size of various funding streams targeting low-income, special education, and other at-risk
students.
A key assumption in these calculations is that local districts would not alter the funding they
provide in response to changes in state funding except to meet local effort and matching requirements.
All districts provided more local funding than required in 2017, and almost all districts have done so in
previous years. Thus, we assume that districts would supply additional funds only when the required
local funding exceeds what they are currently providing.37
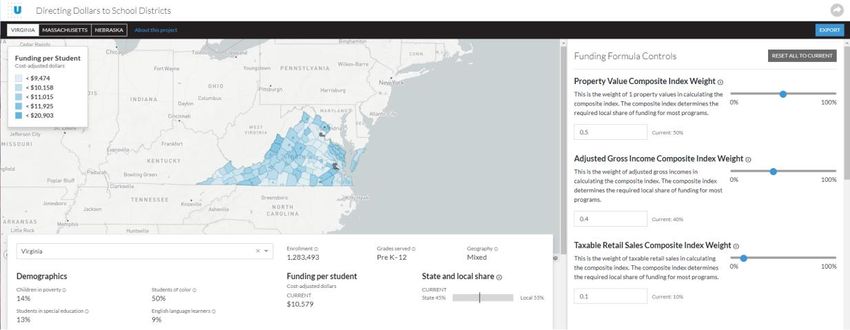
BOX 2
Changing the Formula
This brief highlights only some of the potential changes that could be introduced into the current
funding formula. You can implement changes yourself by navigating to our interactive, “Directing
Dollars to School Districts: Computing the Effects of Changes to State Funding Formulas.”a
This interactive allows you to implement multiple changes for Virginia and see the resulting distribution
of dollars.b In addition to Virginia, this interactive will provide the opportunity to look at formula
changes for Massachusetts, Nebraska, and Texas.
a
Kristin Blagg, Matthew Chingos, Victoria Lee, Cary Lou, Stipica Mudrazija, and Victoria Rosenboom, “Directing Dollars to School
Districts: Computing the Effects of Changes to State Funding Formulas,” Urban Institute, October 31, 2018,
https://edfunding.urban.org/.
b
Results in the interactive and this brief may differ slightly because of small differences in rounding calculations.
SCHOOL DISTRICT FUNDING IN VIRGINIA 11How Would Changing the Composite Index
of Local Ability to Pay Affect Funding Measures?
Virginia calculates a composite index of local ability to pay every two years as part of its biennial budget
process. This figure determines the share of funding in the SOQ and other programs that each district is
required to finance. The composite index is pegged to 45 percent statewide. On average, districts must
provide 45 percent of the funding for applicable programs, although the level for specific districts varies
based on each district’s relative prosperity (a weighted average of per capita true property values,
adjusted gross income, and taxable retail sales). Property values are weighted the most in this
calculation, accounting for 50 percent of the average, followed by adjusted gross income (40 percent),
and taxable sales (10 percent). This overall per capita metric is calculated as a weighted average of both
per student (weighted two-thirds) and per total state population (weighted one-third) measures of
prosperity relative to the state average. Finally, the share that any single district is required to pay is
capped at 80 percent. The estimated effects of changes to these parameters assume districts would not
adjust their local financial support unless SOQ and other programs’ effort and match requirements
surpassed current local funding.
Adjusting the components of the composite index calculation could substantially affect equity.
Because these three values reflect different kinds of district wealth—property wealth, income, and
commercial—shifts in these components could result in nonuniform shifts in funding. If we were to use
only property values in this calculation,38 we calculate that the average student of color would live in a
district that receives $67 more in funding per student than the average white student—compared with
$16 more under the current formula. But the existing gap between urban and rural students would
widen, from $329 in the baseline to $528 under this scenario. Relative to baseline, districts where poor
students live would see slightly higher funding compared with districts with nonpoor students, with the
difference in per student funding increasing from $32 to $42. This adjustment would leave the overall
funding split between state and local sources relatively unchanged, while total school funding, in actual
dollars, and average per student funding, in cost-adjusted dollars, would increase slightly (appendix
table A.1).
12 SCHOOL DISTRICT FUNDING IN VIRGINIAFIGURE 2
Cost-Adjusted District Funding Average Student Receives in Virginia
Calculating the composite index using only property values, relative to the current formula
Average funding per student
Current formula
$10,800
$10,700
$10,600
$10,500
$10,400 $10,793
$10,663 $10,662
$10,300 $10,627 $10,621 $10,593
$10,200
$10,265
$10,100
$10,000
Student Student not in Student in White student Student of Student Student
poverty poverty color attending attending rural
urban school school
URBAN INSTITUTE
Source: Urban Institute analysis of Virginia Department of Education school finance data, the National Center for Education
Statistics (NCES) Common Core of Data, and Census Bureau Small Area Income and Poverty Estimates.
Note: Cost adjustments made using NCES Comparable Wage Index.
If the state used only a district’s adjusted gross income when calculating state-local funding splits, it
would provide $141 more in cost-adjusted dollars in districts where the average poor student lives
relative to the average nonpoor student (from a current baseline of $32). The gap in funding between
students in urban and rural schools would narrow, with rural students granted $126 less in cost-
adjusted funding per student, on average, instead of the current difference of $329. But the difference
in funding between students of color and white students would reverse, with cost-adjusted funding per
student $17 higher, instead of the current $16 lower, in districts where the average white student
resides versus the average student of color. Total and cost-adjusted per student school funding would
fall slightly, and the split between state and local funding would remain essentially unchanged (appendix
table A.1).
SCHOOL DISTRICT FUNDING IN VIRGINIA 13FIGURE 3
Cost-Adjusted District Funding Average Student Receives in Virginia
Calculating the composite index using only adjusted gross incomes, relative to the current formula
Average funding per student
Current formula
$10,800
$10,700
$10,600
$10,500
$10,400
$10,700
$10,300 $10,587 $10,618
$10,578 $10,559 $10,570
$10,492
$10,200
$10,100
$10,000
Student Student not in Student in White student Student of Student Student
poverty poverty color attending attending rural
urban school school
URBAN INSTITUTE
Source: Urban Institute analysis of Virginia Department of Education school finance data, the National Center for Education
Statistics (NCES) Common Core of Data, and Census Small Area Income and Poverty Estimates.
Note: Cost adjustments made using NCES Comparable Wage Index.
Calculating the composite index using only taxable retail sales (i.e., business tax base) as a measure
of prosperity would lead to the most dramatic changes. Rural-urban district funding discrepancies
would flip: average funding for rural students would be $87 higher relative to urban students, rather
than $329 lower. This change would also produce a significant funding disparity between white
students and students of color. The difference in cost-adjusted funding per student between districts
where the average student of color and the average white student live would flip from $16 more to
$109 less. Additionally, poor students would fare worse, on average, under this scenario than currently,
with the difference in funding for districts where they live versus nonpoor students’ districts, reversing
from $32 more to $280 less. Total school funding would also increase slightly in actual dollars. A small
decrease in state funding is offset by a slightly larger but still minor increase in funding from local
districts, as higher local effort and matching requirements would overtake some districts’ current
funding (appendix table A.1).
14 SCHOOL DISTRICT FUNDING IN VIRGINIAFIGURE 4
Cost-Adjusted District Funding Average Student Receives in Virginia
Calculating the composite index using only taxable retail sales, relative to the current formula
Average funding per student
Current formula
$10,800
$10,700
$10,600
$10,500
$10,400
$10,300 $10,592 $10,607 $10,613
$10,553 $10,526
$10,498
$10,200
$10,312
$10,100
$10,000
Student Student not in Student in White student Student of Student Student
poverty poverty color attending attending rural
urban school school
URBAN INSTITUTE
Source: Urban Institute analysis of Virginia Department of Education school finance data, the National Center for Education
Statistics (NCES) Common Core of Data, and Census Bureau Small Area Income and Poverty Estimates.
Note: Cost adjustments made using NCES Comparable Wage Index.
Instead of changing these prosperity measures’ weights, the state could modify the relative
importance of per student versus total population per capita measures when calculating the composite
index, giving more weight or less weight to the actual student population being funded. Increasing the
per student weight tends to slightly increase overall funding while decreasing progressivity, increasing
the funding gap between students in urban and rural schools, and having a negligible effect on
differences in funding by race and ethnicity. Lowering the weight affects these outcomes moderately in
the opposite direction. At one extreme, using only a per student or per enrollee measure would only
slightly alter funding allocations: increasing total funding by $50 million in actual dollars, affecting racial
and ethnic funding differences little, and broadening urban-rural gaps slightly. It would flip the
additional funding per student, in cost-adjusted dollars, for districts where the average poor student
lives versus those where nonpoor student tends to live from $32 more currently to $47 less with this
change.
At the other extreme, using only total per capita measures of prosperity in determining each
district’s state-local funding split when calculating the composite index would have moderate effects,
SCHOOL DISTRICT FUNDING IN VIRGINIA 15including a decrease in total funding by $100 million in actual dollars (appendix table A.1). This change
would also narrow the difference in average per student funding between students in urban and rural
schools from $329 to $225 and increase the additional funds per student in districts where poor
students tend to live relative to those where nonpoor students usually live by more than 500 percent
(from $32 to $195). As with using exclusively per student measures, calculating the composite index
with only total population per capita measures would have little effect on funding differences by race or
ethnicity.
16 SCHOOL DISTRICT FUNDING IN VIRGINIAFIGURE 5
Cost-Adjusted Difference in District Funding, by Student Characteristics in Virginia
Changes in district funding difference, by total population weight in composite index per capita calculation
Funding for students in poverty – funding for students not in poverty
$200
$100
Current formula
$0
0% 10% 20% 30% 40% 50% 60% 70% 80% 90% 100%
-$100
Funding for students of color – funding for white students
$100
$50
Current formula
$0
0% 10% 20% 30% 40% 50% 60% 70% 80% 90% 100%
-$50
Funding for students in rural schools – funding for students in urban schools
0% 10% 20% 30% 40% 50% 60% 70% 80% 90% 100%
$0
Current formula
-$200
-$400
-$600
Total population weight in composite index per capita calculation
URBAN INSTITUTE
Source: Urban Institute analysis of Virginia Department of Education school finance data, the National Center for Education
Statistics (NCES) Common Core of Data, and Census Bureau Small Area Income and Poverty Estimates.
Note: Cost adjustments made using NCES Comparable Wage Index.
SCHOOL DISTRICT FUNDING IN VIRGINIA 17Finally, changing the 80 percent cap for an individual district’s required share of funding would
affect total school funding and the share of funding coming from the state, as well as equity measures.
At one end of the spectrum, lowering the cap on a district’s required share of funding from 80 percent to
50 percent in the composite index calculation would increase the state’s share of total school funding
(pegged at 55 percent when calculating local effort and matching requirements and at 45 percent of
actual total funding in the baseline). In this scenario, overall district funding would fall to 53 percent of
total school funding and increase state funding by around $420 million in actual dollars, which would
boost total school funding by the same amount to $15 billion in actual dollars, or $10,848 per student in
cost-adjusted dollars.39
But by lowering the cap for local contributions, the adjusted formula would direct most of these
additional state funds to the wealthy urban districts that are required to provide a higher share of
school funding in the existing formula. This would more than eliminate the supplemental funds going to
districts that tend to have more poor students, reversing the difference in average per student funding,
in cost-adjusted dollars, between districts where the average poor student lives and those where the
average nonpoor student lives from $32 more to $83 less. Similarly, urban-rural equity would decrease,
with the gap in funding increasing from $329 per student, on average, to $555. Conversely, this change
would increase the difference in funding between districts where students of color usually live and
those where white students tend to reside. The average student of color would live in a district that
receives $86 more in funding per student than the average white student under this scenario, compared
to $16 more currently. When lowering the cap more gradually from 80 percent, there is a kink in the
equity measure outcomes at 70 percent because of the cap increasing the state’s responsibility for
funding in Fairfax, a prosperous district with the highest total school funding in actual dollars ($2.67
billion) starting just under this point.
At the other end of the spectrum, removing the cap on the local share of school funding for
individual districts tends to affect outcomes in the opposite direction as lowering the cap, but the
changes are muted, as fewer districts and students would be affected (appendix table A.1). Changes in
overall funding and the aggregate state and local split would be modest, while the funding gaps between
urban and rural districts would contract by around $50 per student. The difference between funding
that the average poor student’s district receives and the amount for the average nonpoor student’s
district would increase from $32 to $43, and the difference in cost-adjusted funding per student
between the average student of color and white student’s districts would decrease from $16 to $1.
18 SCHOOL DISTRICT FUNDING IN VIRGINIAFIGURE 6
Cost-Adjusted Difference in District Funding, by Student Characteristics in Virginia
Changes in the district funding difference, by level of composite index cap
Funding for students in poverty – funding for students not in poverty
$200
$100
Current formula
$0
50% 60% 70% 80% 90% 100%
-$100
Funding for students of color – funding for white students
$100
$50
Current formula
$0
50% 60% 70% 80% 90% 100%
-$50
Funding for students in rural schools – funding for students in urban schools
50% 60% 70% 80% 90% 100%
$0
Current formula
-$200
-$400
-$600
Composite index cap
URBAN INSTITUTE
Source: Urban Institute analysis of Virginia Department of Education school finance data, the National Center for Education
Statistics (NCES) Common Core of Data, and Census Bureau Small Area Income and Poverty Estimates.
Note: Cost adjustments made using NCES Comparable Wage Index.
SCHOOL DISTRICT FUNDING IN VIRGINIA 19How Would Changes to Basic Aid Affect Various Funding Measures?
The state could also consider how changes to its Basic Aid formula—the primary SOQ funding
component and single largest funding stream overall—would affect equity measures and the total
amount and state and local shares of school funding. Many inputs to the Basic Aid calculation are set in
legislation or regulations, with amounts precalculated by the Virginia Department of Education. These
factors include the number of instructional and support positions and their compensation rates, fringe
rates and the employer health care premium amount for benefits, reimbursement rates and
replacement costs for transportation, and per student funded amounts based on prevailing costs for
other support expenses. But the state could change two parameters within this framework: how it
distributes sales tax revenue earmarked for education and whether to fund higher salaries for selected
districts—mostly in or close to the DC metropolitan area—as cost of competing adjustments (COCA).
Distributing sales tax revenues based on the number of poor students living in each district rather
than the total school-age population, as in the current formula, would increase funding progressivity:
more dollars would go toward less prosperous districts that are required to contribute a lower share of
funding, and fewer dollars would go toward more prosperous districts required to foot a higher share of
funding. Although this change would not affect the total amount of Basic Aid calculated for each district,
providing less combined state sales tax revenues and other state funding to wealthier districts (thus
requiring them to cover a higher share of the program’s funding) leads to lower state funding in these
more prosperous districts overall. But per our assumptions, this change does not lead these districts to
provide additional local funding, as they already tend to provide more local funding than is required as
part of Basic Aid and other SOQ and state programs and would still largely do so. This scenario leads to
more state funding (when considering sales tax revenue and other state funds combined) going toward
less prosperous districts, but the combined effect of this increase and the decrease in state funds going
toward more prosperous districts would lead to a modest net decrease of $60 million in overall state
funding. Total school funding, including both state and local sources, would fall slightly from $14.60
billion to $14.54 billion in actual dollars, and funding per student would dip slightly from $10,579 to
$10,555 in cost-adjusted dollars.
The difference in cost-adjusted funding per student between the district where the average poor
student lives and where the average nonpoor student lives would rise substantially from $32 to $215.
This change would also increase the additional funding for districts where students of color reside
relative to those where white students tend to live. Under this scenario, the average student of color
would live in a district that receives $59 more in cost-adjusted funding per student than the average
white student, compared with $16 currently. Additionally, the difference in average per student funding
between those in urban versus rural schools would fall from $329 to $252.
20 SCHOOL DISTRICT FUNDING IN VIRGINIAFIGURE 7
Cost-Adjusted District Funding Average Student Receives in Virginia
Allocating sales tax revenue based on share of poor students, relative to the current formula
Average funding per student
Current formula
$10,800
$10,700
$10,600
$10,500
$10,400
$10,740
$10,300
$10,634
$10,555 $10,585
$10,525 $10,525
$10,200 $10,382
$10,100
$10,000
Student Student not in Student in White student Student of Student Student
poverty poverty color attending attending rural
urban school school
URBAN INSTITUTE
Source: Urban Institute analysis of Virginia Department of Education school finance data, the National Center for Education
Statistics (NCES) Common Core of Data, and Census Bureau Small Area Income and Poverty Estimates.
Note: Cost adjustments made using NCES Comparable Wage Index.
Removing the supplemental salary funding for COCA districts would also modestly lower total
school funding by decreasing overall state funding (appendix table A.1). These reductions would fall only
on COCA districts, which tend to be more prosperous, with decreases primarily affecting Basic Aid but
also affecting other SOQ and non-SOQ programs whose funding is based, in part, on instructional
personnel rates. The impact on equity would be more muted than the sales tax revenue change, with the
additional per student funding for districts where poor and nonpoor students tend to live increasing by
around $30, on average, and the urban-rural district funding gap falling, on average, by around $45 in
cost-adjusted dollars. This change would also flip the difference in average funding between districts
where students of color and where white students tend to live from $16 more to $6 less in cost-
adjusted per student funding.
SCHOOL DISTRICT FUNDING IN VIRGINIA 21FIGURE 8
Cost-Adjusted District Funding Average Student Receives in Virginia
Eliminating the cost of competing adjustment, relative to the current formula
Average funding per student
Current formula
$10,800
$10,700
$10,600
$10,500
$10,400
$10,300 $10,611
$10,577
$10,522 $10,513 $10,525 $10,519
$10,200
$10,328
$10,100
$10,000
Student Student not in Student in White student Student of Student Student
poverty poverty color attending attending rural
urban school school
URBAN INSTITUTE
Source: Urban Institute analysis of Virginia Department of Education school finance data, the National Center for Education
Statistics (NCES) Common Core of Data, and Census Bureau Small Area Income and Poverty Estimates.
Note: Cost adjustments made using NCES Comparable Wage Index.
How Would Changes to Funding Streams Targeting Disadvantaged
and At-Risk Students Affect Various Funding Measures?
Virginia’s school funding formula provides separate funding streams and programs targeting students
whose families are low income, who receive special education, and who are otherwise at risk of falling
behind or dropping out. Decreasing these funding streams tends to decrease equity, state costs, and
total funding, while increasing these streams increases equity, state costs, and total funding. The one
exception is special education funding, which increases urban-rural and nonpoor-poor student funding
equity but decreases racial and ethnic equity.40
The prevention, intervention, and remediation program provides funding to districts for one
additional hour of instruction for each at-risk student, which is proxied by calculating the share eligible
for free lunch in the district, on average, over the past three years. This funding includes a sliding scale
for class size, based on the district’s performance on the state’s standards of learning over the prior
three years. Eliminating the program would decrease costs and negatively affect equity across the
22 SCHOOL DISTRICT FUNDING IN VIRGINIAboard, while doubling, tripling, or quadrupling districts’ funding would increase equity and costs
(appendix table A.1).
FIGURE 9
Cost-Adjusted Difference in District Funding, by Student Characteristics in Virginia
Changes in district funding difference, by level of prevention, intervention, and remediation funding
Funding for students in poverty – funding for students not in poverty
$200
$100
Current formula
$0
0% 40% 80% 120% 160% 200% 240% 280% 320% 360% 400%
-$100
Funding for students of color – funding for white students
$100
$50
Current formula
$0
0% 40% 80% 120% 160% 200% 240% 280% 320% 360% 400%
-$50
Funding for students in rural schools – funding for students in urban schools
0% 40% 80% 120% 160% 200% 240% 280% 320% 360% 400%
$0
Current formula
-$200
-$400
-$600
Level of prevention, intervention, and remediation funding
URBAN INSTITUTE
Source: Urban Institute analysis of Virginia Department of Education school finance data, the National Center for Education
Statistics (NCES) Common Core of Data, and Census Bureau Small Area Income and Poverty Estimates.
Note: Cost adjustments made using NCES Comparable Wage Index.
SCHOOL DISTRICT FUNDING IN VIRGINIA 23The at-risk program provides additional funding per at-risk student, with the amount determined as
the amount of Basic Aid per student in the district multiplied by a percentage add-on from 1 to 13
percent. The add-on percentage for each district is based on the average share of students eligible for
free lunch over the past three years, with higher shares for more needy districts. Lowering the add-on
percentage to 1 percent for all districts would decrease costs and negatively affect equity across the
board,41 while increasing the percentage by 5 points, 10 points, or more for each district would increase
equity and costs (appendix table A.1).
FIGURE 10
Cost-Adjusted Difference in District Funding, by Student Characteristics in Virginia
Changes in district funding difference, by change in at-risk funding add-on percentage
Funding for students in poverty – funding for students not in poverty
$200
$100
Current formula
$0
-12% -10% -8% -6% -4% -2% 0% 2% 4% 6% 8% 10% 12% 14% 16% 18% 20%
-$100
Funding for students of color – funding for white students
$100
$50
Current formula
$0
-12% -10% -8% -6% -4% -2% 0% 2% 4% 6% 8% 10% 12% 14% 16% 18% 20%
-$50
Funding for students in rural schools – funding for students in urban schools
-12% -10% -8% -6% -4% -2% 0% 2% 4% 6% 8% 10% 12% 14% 16% 18% 20%
$0
Current formula
-$200
-$400
-$600
Change in at-risk funding add-on percentage (percentage points)
URBAN INSTITUTE
Source: Urban Institute analysis of Virginia Department of Education school finance data, the National Center for Education
Statistics (NCES) Common Core of Data, and Census Bureau Small Area Income and Poverty Estimates.
Notes: Cost adjustments made using NCES Comparable Wage Index. The add-on percentage for each local district has a floor of 1
percent (minimum set in statute). If the proposed offset would result in a locality having an add-on percentage lower than 1
percent, the add-on percentage is set to the 1 percent minimum.
24 SCHOOL DISTRICT FUNDING IN VIRGINIAThe K–3 Primary Class Size Reduction Program provides funds to districts, based on their actual or
average state costs, as an incentive to lower class sizes below thresholds based on the average share
eligible for free lunch over the past three years. Eliminating the program would decrease costs but
negatively affect equity across the board, while doubling, tripling, or quadrupling funding would
increase equity and costs (appendix table A.1).
FIGURE 11
Cost-Adjusted Difference in District Funding, by Student Characteristics in Virginia
Changes in district funding difference, by level of K–3 primary class size reduction payments
Funding for students in poverty – funding for students not in poverty
$200
$100
Current formula
$0
0% 40% 80% 120% 160% 200% 240% 280% 320% 360% 400%
-$100
Funding for students of color – funding for white students
$100
$50
Current formula
$0
0% 40% 80% 120% 160% 200% 240% 280% 320% 360% 400%
-$50
Funding for students in rural schools – funding for students in urban schools
0% 40% 80% 120% 160% 200% 240% 280% 320% 360% 400%
$0
Current formula
-$200
-$400
-$600
Level of K–3 primary class size reduction payments
URBAN INSTITUTE
Source: Urban Institute analysis of Virginia Department of Education school finance data, the National Center for Education
Statistics (NCES) Common Core of Data, and Census Bureau Small Area Income and Poverty Estimates.
Note: Cost adjustments made using NCES Comparable Wage Index.
The Virginia Preschool Initiative provides districts’ schools and community-based organizations
funding to provide early education to at-risk (i.e., low-income) 4-year-old children not currently served
by Head Start. The number of at-risk students is estimated by multiplying the projected number of 4-
SCHOOL DISTRICT FUNDING IN VIRGINIA 25You can also read


