Entropy of Co-Enrolment Networks Reveal Disparities in High School STEM Participation
←
→
Page content transcription
If your browser does not render page correctly, please read the page content below
This is a provisional file, not the final typeset article                                                   1

                                         Entropy of Co-Enrolment Networks Reveal
                                         Disparities in High School STEM Participation
                                         Steven Martin Turnbull 1,2∗ and Dion R.J. O’Neale 2,3
                                         1 Schoolof Critical Studies in Education, Faculty of Education and Social Work,
                                         University of Auckland, Auckland, New Zealand
                                         2 Te Punaha Matatini, University of Auckland, Auckland, New Zealand
                                         3 Department of Physics, University of Auckland, Auckland, New Zealand

                                         Correspondence*:
                                         Steven Martin Turnbull
                                         s.turnbull@auckland.ac.nz
arXiv:2008.13575v1 [cs.CY] 27 Aug 2020

                                         ABSTRACT

                                           The current study uses a network analysis approach to explore the STEM pathways that
                                         students take through their final year of high school in Aotearoa New Zealand. By accessing
                                         individual-level microdata from New Zealand’s Integrated Data Infrastructure, we are able to
                                         create a co-enrolment network comprised of all STEM assessment standards taken by students
                                         in New Zealand between 2010 and 2016. We explore the structure of this co-enrolment network
                                         though use of community detection and a novel measure of entropy. We then investigate how
                                         network structure differs across sub-populations based on students’ sex, ethnicity, and the socio-
                                         economic-status (SES) of the high school they attended. Results show the structure of the STEM
                                         co-enrolment network differs across these sub-populations, and also changes over time. We
                                         find that, while female students were more likely to have been enrolled in life science standards,
                                         they were less well represented in physics, calculus, and vocational (e.g., agriculture, practical
                                         technology) standards. Our results also show that the enrolment patterns of the Māori and Pacific
                                         Islands sub-population had higher levels of entropy, an observation that may be explained by
                                         fewer enrolments in key science and mathematics standards. Through further investigation of
                                         this disparity, we find that ethnic group differences in entropy are moderated by high school SES,
                                         such that the difference in entropy between Māori and Pacific Islands students, and European
                                         and Asian students is even greater. We discuss these findings in the context of the New Zealand
                                         education system and policy changes that occurred between 2010 and 2016.

                                         Keywords: Network Analysis, STEM Education, Assessment, Enrolment, Entropy

                                         1   INTRODUCTION

                                         There is an increasing demand to understand the choices that students make when it comes to selecting
                                         courses in secondary school and further education. Obtaining a clear picture of the skills that students leave
                                         school with is an important goal for governments across the world, and this is especially true regarding
                                         Science, Technology, Engineering and Mathematics (STEM). For example, the New Zealand Qualifications
                                         Authority (NZQA) (New Zealand Qualifications Authority, 2016, p.8) specifically stated that:

                                              To meet the demand for essential skills for the twenty first century, New Zealand needs to grow the
                                              number and diversity of skilled workers in Science, Technology, Engineering and Maths.

                                                                                                                                                     1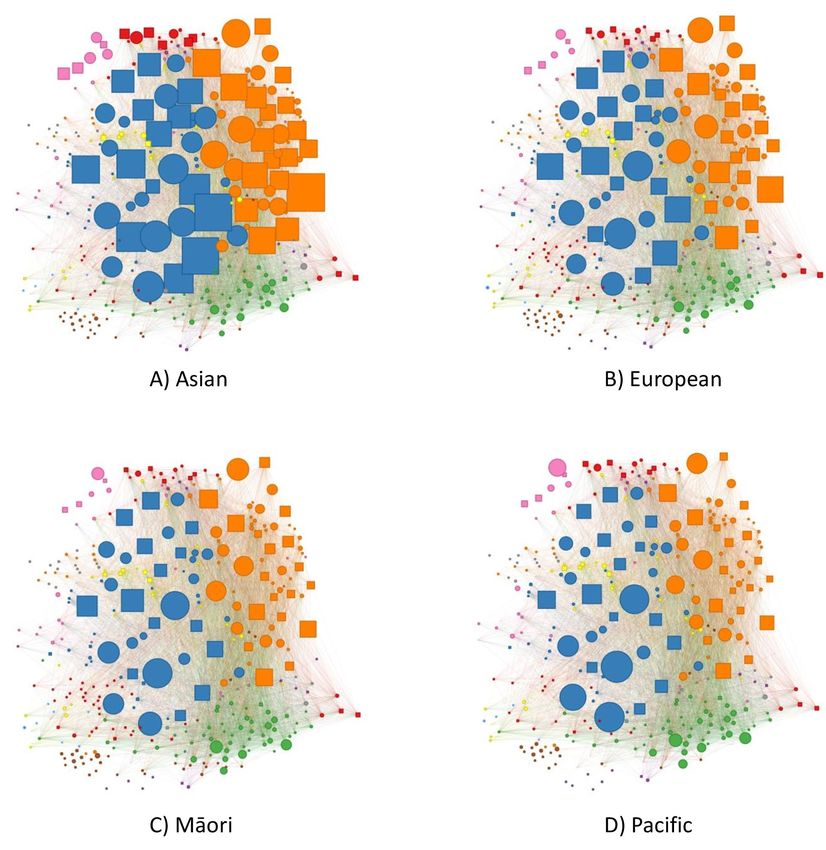
Turnbull et al.                                               Entropy of STEM Co-Enrolment Networks

  Governments are pushing to not only increase the number of students participating in STEM education, but
also to increase the representation of students who have been historically underrepresented in STEM. While
trends may differ across countries, disparities in STEM participation tend to be found at the intersection
of gender, ethnicity and social class (Archer et al., 2015; Comparative Education Research Unit, 2017).
Globally, women are typically underrepresented in subjects such as physics and computer science, while
there tends to be gender parity in subjects such as biology and medicine. In the case of Aotearoa New
Zealand, similar disparities in STEM participation are found (New Zealand Qualifications Authority, 2016;
Education Counts, 2016a,b). In addition, students from Māori and Pacific Island backgrounds have also
been underrepresented in post-compulsory STEM education (Ministry of Education, 2014; New Zealand
Qualifications Authority, 2016).
  Student attrition from STEM education is often viewed in terms of a leaky pipeline, with students from
groups who are under represented in STEM being more likely to drop out of STEM education with each
advance from one educational stage to the next. However, participation in STEM education is complex.
Not only is it important to consider the socio-cultural context in which students are placed when they make
their subject choices, it is also important to consider the structural context of the education system. We are
increasingly able to draw upon rich, complex, education-related administrative data to achieve this, but we
must consider how we can analyse these data in a manner that preserves complex structures and provides
new and useful insights. By meeting this goal, we can increase our understand of what participation in
STEM looks like.
  As detailed by Hipkins and Bolstad (2005), there are many ways in which STEM participation can be
reported on. At a broad level, we can summarise the number of students enrolled in each subject (e.g., how
many students of each demographic group study biology?). We can also explore patterns at finer-grained
levels by summarising participation per high school (e.g., which high schools have higher proportions
of students studying science?), or by reporting participation at the level of assessment (e.g., how many
students took a specific biology exam?). While it is relatively easy to summarise and interpret participation
at broad levels, untangling and understanding patterns of subject participation at fine-grained levels can be
a difficult task. This task is especially difficult in the context of Aotearoa New Zealand, which operates a
particularly complex high school assessment system.
  The goal of the current study is to develop and employ a novel method of reporting on student participation
in STEM by looking specifically at students’ co-enrolments at the level of assessment. We begin by
summarising the insights that can be gained by exploring STEM participation at a broad level. We then
provide a brief summary of the National Certificate of Educational Achievement (NCEA), Aotearoa New
Zealand’s internationally unique high school qualification. We then move on to demonstrate how the
quantitative technique of network analysis can be employed to reveal structures in NCEA participation.
Finally, we discuss the novel insights provided by network analysis of STEM co-enrolments in NCEA
assessments spanning the previous decade.

1.1   Broad Understandings of Student Participation in STEM

  Student participation in STEM is often reported at a broad level, with information detailing the counts of
students who are enrolled in each subject, and how this differs across demographic groups. In Aotearoa
New Zealand, data is readily available by sex (male or female) and Socio-economic status (SES) from
2004 to 2018 (Ministry of Education, 2018). Exploring these data can provide a surface level description of
what the field of STEM education looks like in Aotearoa New Zealand.

This is a provisional file, not the final typeset article                                                   2
Turnbull et al.                                               Entropy of STEM Co-Enrolment Networks

  As shown in Figure 1, in Year 13 (final year of high school), female students in Aotearoa New Zealand
are less likely to take physics, with this under-representation being steady across years. The same figure
shows that female students are more likely to take biology, and more recently chemistry, with this
over-representation becoming increasingly more pronounced over time.
  Figure 2 shows that female students continue to be underrepresented in mathematics subjects, such as
accounting and calculus. However, female students have higher levels of representation in statistics than
male students in recent years (Ministry of Education, 2018). The same data shows that, in technology
subjects, the computer and engineering subjects have continually been male-dominated, with this becoming
more pronounced over time(Ministry of Education, 2018). Food technology and textiles are the only female
dominated technology domains.
  Data from Ministry of Education (2018) also allows us to see trends in STEM participation by school
decile, a proxy measure of SES. In Aotearoa New Zealand, school decile refers to the affluence of the
neighborhood in which a school is located. High decile schools are located in more affluent areas, whilst
low decile schools are located in less affluent areas. As shown in Figure 3, students who attended higher
decile schools had greater rates of participation in science subjects, and this pattern was also evident for
calculus and statistics. The relationship between student enrolment in technology learning domains and
decile has no discernible pattern.
  Broad level data, such as those discussed above, allow us to interpret trends in subject enrolments
over time. However, they provide only a surface level understanding of STEM participation. Beneath
the aggregation of counts per subject label hides important information that is useful for policy makers
and researchers. Each subject consists of many different assessments, each covering unique content and
following different assessment criteria. The following section will provide a brief introduction to Aotearoa
New Zealand’s main high school assessment system, the National Certificate of Educational Achievement
(NCEA).

1.2   A Brief Introduction to the National Certificate of Educational Achievement
  The National Certificate of Educational Achievement (NCEA) is the main form of secondary school
assessment in Aotearoa New Zealand. First introduced to students in 2002, NCEA was designed to replace
norm-referenced assessment. In norm-referenced assessments student achievement is judged against the
average achievement of the student population (Mahoney, 2005). Instead, achievement in NCEA is based
on the competencies of individual students (Hipkins et al., 2016), meaning that achievement is an indicator
of what a student knows, and not just how they rank amongst their peers. Therefore, it is possible for
all students to pass if they all meet the assessment criteria. Assessment operates at the level of specific
skills, or standards, that comprise a subject discipline. For example, instead of just receiving an overall
grade for biology, students take several standards in the subject discipline of biology that demonstrate their
competence in particular areas (e.g., “Demonstrate understanding of biological ideas relating to micro-
organisms”). By successfully completing standards, students accumulate credits, the value of which is
linked to the amount of work needed to fulfil a standard. The three levels of the NCEA typically correspond
to the final three years of high school. NCEA Level 1 is typically taken in Year 11 (age ∼ 15), NCEA
Level 2 in Year 12, and NCEA Level 3 in Year 13.
  What makes the NCEA a unique assessment system is its flexibility. Compared to the systems it replaced
(School Certificate, Sixth Form Certificate, and Bursary), there is more variety in the assessments/standards
that students may be enrolled in (Mahoney, 2005). In providing increased choice to students and their

This is a provisional file, not the final typeset article                                                   3
Turnbull et al.                                               Entropy of STEM Co-Enrolment Networks

educators, and more flexible pathways through high school, it was hoped that the NCEA would benefit
students from a range of backgrounds. As stated in the New Zealand curriculum (Ministry of Education,
2007, p.41):

     Schools recognise and provide for the diverse abilities and aspirations of their senior students in ways
     that enable them to appreciate and keep open a range of options for future study and work. Students
     can specialise within learning areas or take courses across or outside learning areas, depending on the
     choices that their schools are able to offer.

The NCEA meets these goals by providing students with more learning pathways through high school,
which aims to serve both students who wish to progress to tertiary study, and those who want to enter into
vocational careers. These two pathways are reflected in the two main types of assessment offered: unit and
achievement standards.

1.2.1   Unit and Achievement Standards

  Unit standards tend to assess more vocational subjects (e.g., plumbing, hairdressing, agriculture). Unit
standards have strict criteria that need to be achieved in order to pass (Hipkins et al., 2016), and are
thus suited to assessing skills that follow a procedure. If a student meets the criteria they pass; if they
fail a step, they fail the standard. All unit standards are assessed internally by the institution where the
student is placed, offering the opportunity to teach and learn in a manner that caters more to students’
contexts. Internal assessments are moderated by the NZQA, according to the New Zealand Qualification
Framework(NZQA, 2016), to ensure the assessment is consistent and rigorous. That being said, schools
often provide the opportunity for students to retake failed internal assessments at a later time.
  Achievement standards assess more traditional subjects that are tied to the New Zealand curriculum,
such as science, mathematics, and English. While many achievement standards are assessed internally, a
number of them are taken under standardised conditions and assessed by an external body (i.e., the NZQA).
Unlike unit standards, where students can only be judged to have passed or failed, achievement standards
often have assessment criteria that can be interpreted more subjectively and require a different grading
structure (Hipkins et al., 2016). Instead of pass or fail, achievement standards have four outcomes: not
achieved, achieved, merit, and excellence. This grading structure seeks to reward students who demonstrate
knowledge at a higher level than simply showing competence. The introduction of different grading levels
in achievement standards provides increased opportunity to rank students by performance Shulruf et al.
(2010), a process that NCEA was not initially designed to accommodate (Hipkins et al., 2016).
  The relevance of achievement and unit standards can be tied to students’ future aspirations in the context
of STEM. Wong (2016, p.20) differentiates these aspirations as being tied to either careers in science,
or careers from science. Careers in science may be defined as: “...occupations that are involved with the
research or discovery of science as their primary purpose” (Wong, 2016, p.20). Achievement standards
may be more closely linked to these types of careers as they provide the means to assess theoretical work,
and provide the pathway to university. Careers from science may be defined as “careers that are related to
science” but prioritise other aspects of STEM (Wong, 2016, p.20). This includes careers in technology, and
also careers in horticulture and farming that are even more applied. The vocational slant of unit standards
may prepare students better for these types of careers from science. With that being said, students can take
a combination of unit and achievement standards.

This is a provisional file, not the final typeset article                                                  4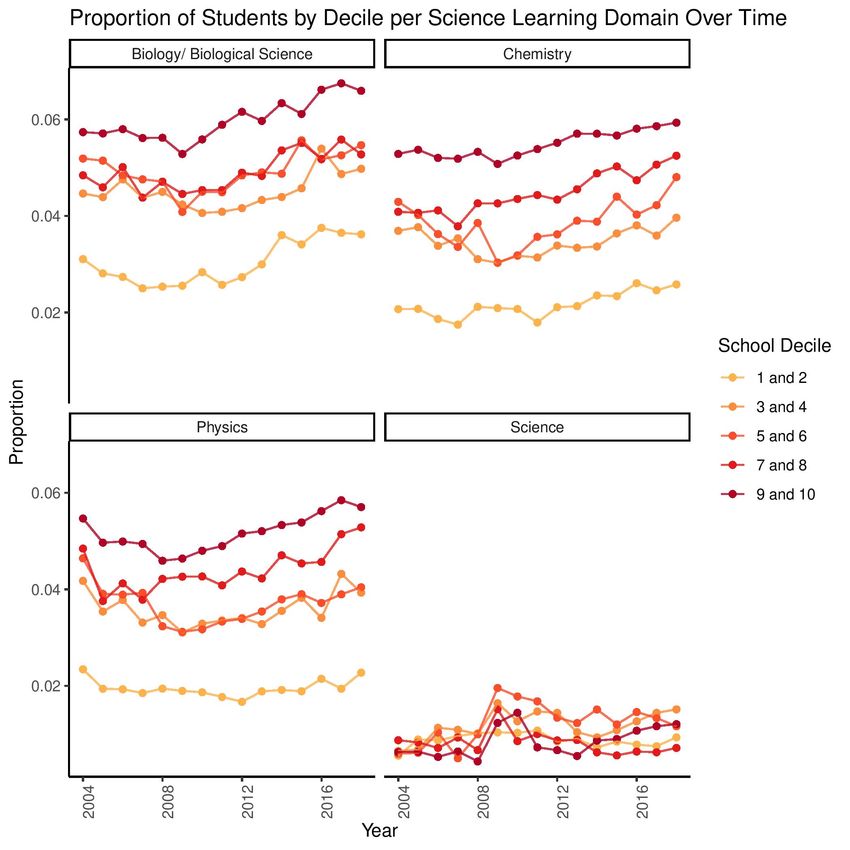
Turnbull et al.                                               Entropy of STEM Co-Enrolment Networks

  While there are many potential pathways through the NCEA, the eventual goal for students is to
accumulate enough credits to achieve NCEA Level 3. Students who wish to attend university must meet a
separate goal over and above the requirements for NCEA Level 3. To be eligible to enrol at a university,
students must attain University Entrance (UE), which is the equivalent of achieving NCEA Level 3 with a
specified number of credits coming from three subjects on an approved subjects list (these include subjects
such as biology, physics, mathematics, and English) with specific achievement standards (NZQA, 2020),
and a higher standard of literacy than regular NCEA Level 3 (Hipkins et al., 2016). Specific university
programs may also have their own requirements for enrolment. For example, to transition from NCEA to
engineering at the University of Auckland, students must attain specific externally assessed achievement
standards in Level 3 calculus and physics (University of Auckland, 2020). Alternate pathways to university
STEM study are possible, such as completion of university foundation courses, but these take additional
time. The decisions that students make regarding the selection of STEM standards in NCEA Level 3 can
thus have long-lasting implications. It is therefore especially important to understand how NCEA Level 3
is structured, and how this relates to student outcomes.

  Given the complexity of the NCEA, exploring participation in STEM at the level of individual assessments
can provide additional insights that complement our broad level understandings of STEM participation
discussed previously. Doing so allows us to explore factors related to individual standards (such as the
type of standard assessment and whether it was assessed internally or externally) as well as co-enrolment
patterns and pathways through assessments. To build on the broad level understandings outlined above, we
now adopt the following research questions:

    • Can we identify patterns in the NCEA Level 3 standards taken by students in STEM?
    • If so, how do the patterns of NCEA Level 3 standard enrolments differ across demographic
      characteristics, SES, and time?

  Given that the NCEA can be considered “one of the most complicated education system in the world”
(Hipkins et al., 2016), unpacking details at a more fine-grained level can be a daunting task. To explore this
complicated system and answer our research questions, we employ quantitative techniques based in the
field of network analysis. We explain how network analysis can be used as a tool to understand patterns
of assessment, especially in contexts where the system is complex (as with the NCEA). The following
sections will discuss how network analysis can help us explore what participation looks like for students
studying STEM.

2     A NETWORK METHODOLOGY

2.1    Data

  We make use of Statistics NZ’s Integrated Data Infrastructure (IDI) to access administrative data pertaining
to students’ high school and census information (Statistics New Zealand, 2018). The IDI is a collection of
government data sets, containing micro-data on student enrolment and demographics, linked at the level
of individuals for the population of Aotearoa New Zealand. We focus on students taking NCEA Level 3
from 2010 to 2016, as this is the most up to date data available at the time of writing. We focus on NCEA
Level 3 as this level is the most highly specialised, and precedes entrance to university and employment.
Years prior to 2010 are available, but were omitted due to processing constraints. The years spanning 2010

This is a provisional file, not the final typeset article                                                   5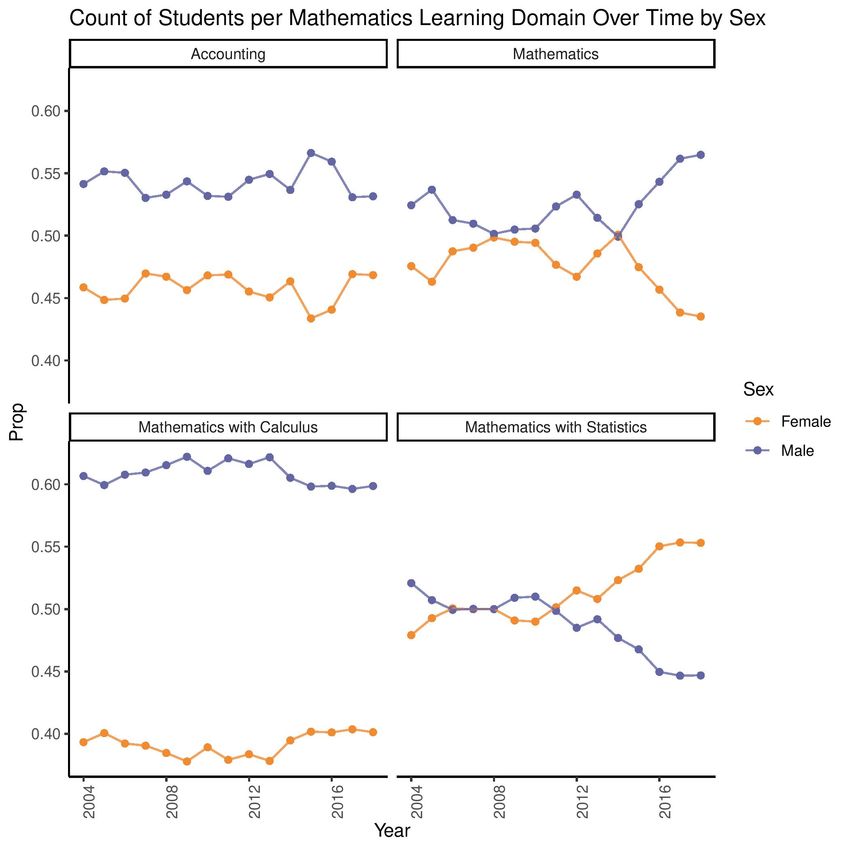
Turnbull et al.                                               Entropy of STEM Co-Enrolment Networks

to 2016 were also of specific interest, due to education policy reforms introduced around 2012 and 2013
(Hipkins et al., 2016).
  We apply several rules when selecting student cohorts to be included, in order to minimise the risk of
adding statistical noise to our analysis. In order to focus our analysis on students who have had the majority
of their education in Aotearoa New Zealand, we only select individuals who are identified as having tax,
birth or visa records present in the IDI. We also only include students who had NCEA records when they
were 15 or 16 and during NCEA Level 1. These filters help focus our sample on the resident population of
Aotearoa New Zealand, and minimise the chances of including visitors or foreign exchange students. We
also limit our sample to students who attended state schools in Aotearoa New Zealand. This is because
private schools in Aotearoa New Zealand are more likely to offer a combination of the NCEA and other
formal qualifications (such as Cambridge or International Baccalaureate), introducing additional layers of
complexity. For the purposes of our analysis we also assign each student a single cohort year based on the
most frequent year in which they took standards. This is because students are able to take NCEA Level 3
standards over multiple years. For example, if a student took two NCEA Level 3 standards during 2015,
and ten NCEA Level 3 standards during 2016, we would assign the student to the 2016 cohort. We choose
not to exclude Level 3 standards taken in a different year from the overall cohort year, as these standards
would still contribute to the student’s qualification.
 We include the following variables in our analysis:

  • Students’ sex (male or female). Due to limitations in the administrative data used, we are not able to
      include gender (and non-binary classifications of gender) in our analysis.
  • Students’ ethnicity. Each student is able to identify with multiple ethnic groups, following the
      classification set out by Stats NZ (Stats NZ, 2005). The main ethnic groups include European;
      Māori; Pacific Island; Asian; Middle Eastern, Latin American, or African (MELAA); and Other. For
      the purposes of this study, we do not report results for MELAA and Other populations as they include
      a broad cross section of individuals, but typically involve relatively small numbers.
  • High school decile. This is a rating out of 10 for the affluence of the area where the school is located.
    For the purposes of the following analysis, we categorise high school decile into 3 groups. Deciles 1-3
    are low decile, deciles 4-7 are medium decile, and deciles 8-10 are high decile.
  • NCEA Level 3 standards taken. For each student, we have records of all of the standards taken at
    NCEA Level 3. We only include standards from the New Zealand curriculum learning areas of Science,
    Technology and Mathematics (Ministry of Education, 2007). For each standard, we have information
    on its subject area (e.g., physics, biology, mathematics etc.), whether it was a unit or achievement
    standard, and whether it was assessed internally or externally.

2.2    Network Analysis

  We employ network analysis to understand STEM enrolment at NCEA Level 3 at a fine-grained level. At
its fundamental level, a network is a collection of nodes and edges. Nodes can represent an agent (e.g., a
student) or an object (e.g., a standard); edges link two nodes together to indicate some form of relationship.
Networks can be used to represent anything from human relationships and transport networks, to biological
and computer systems (Barabási, 2003). In education research, network analysis has tended to focus on
the relationships shared between students in the classroom (Tranmer et al., 2014), or communication
between staff at educational institutions (Daly, 2010). There are few examples of education research that

This is a provisional file, not the final typeset article                                                   6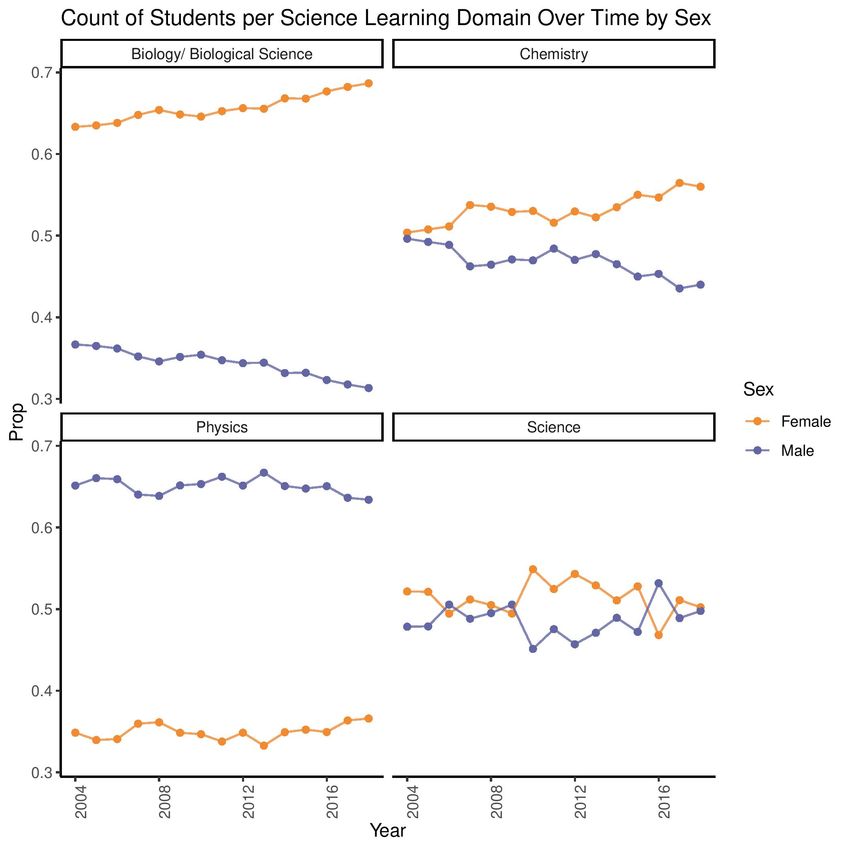
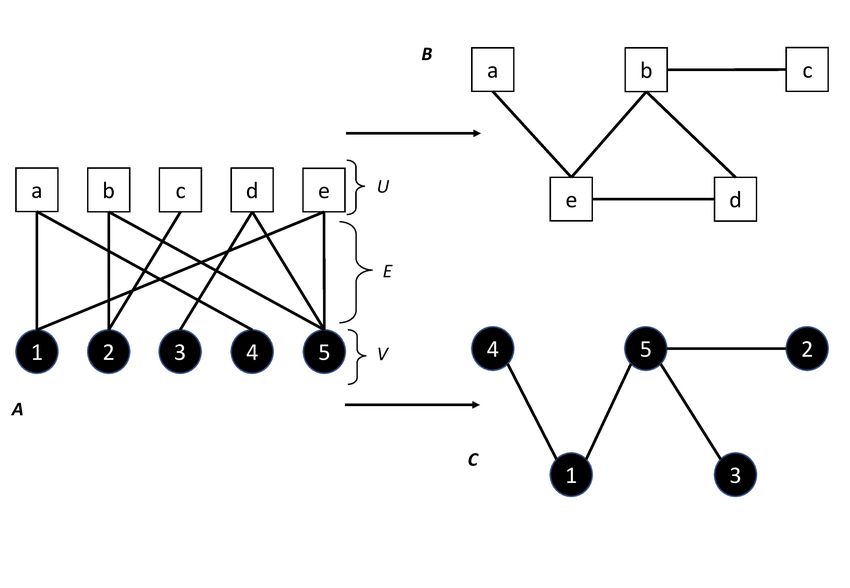
Turnbull et al.                                               Entropy of STEM Co-Enrolment Networks

use network analysis to investigate non-social relationships. We seek to expand this area of research by
applying network analysis to high school assessment enrolment data. As we will outline in the following
section, network analysis can help us identify patterns in NCEA standard co-enrolments.
  In our analysis, nodes take the form of students and standards. Edges in our network represent any
recorded instance where a student was enrolled in a NCEA Level 3 STEM standard during high school.
This creates a bipartite network (also commonly referred to as a two-mode network). A bipartite network is
any network where there are two types of node, and nodes can only connect to a node of a different type. In
our case, a standard cannot be connected directly to another standard, and a student cannot be connected
to another student. For example, in A in Figure 4, standards may be represented by nodes in set U, and
students may be represented by nodes in set V.
  We create a network of students and the standards they were enrolled in for the whole of our student
population. We structure this network so that it is multidimensional. Each student node belongs to a specific
year, region, and decile, while standards can exist across multiple years, regions, and school deciles. In
order to analyse the properties of our network, we are required to ‘project’ onto one set of nodes. This
means that we take the node set belonging to a single node type, and generate edges between these nodes
when they are linked to a common node of the other node set. For example, B and C in Figure 4 shows the
projection of the network in Figure 4. In the projections, standards represented in set U are now connected
to one another (B), and students in set V are also now connected (C).
  As we are interested in the patterns of standards that students took, we project onto the standard nodes
(Figure 4:B). This results in a network of standards that are connected by edges indicating that students took
those two standards together within their NCEA Level qualification. The edges of the projected standard
network can also take on a weighting that corresponds to the frequency that two standards were taken
together by students.

2.3   Normalization and Community Detection
  Our goal is to use the co-enrolment network to understand the standards that tend to be taken together, and
by which students. To do this, we employ community detection. Community detection is a process in which
we identify sets of nodes that are clustered together by the edges in the network. Previous research by Ferral
(2005) has employed similar clustering techniques to investigate communities of subjects that tend to be
taken together in the NCEA, but this was limited by the number of high schools sampled, the response rate
of schools, and the availability of demographic and standard information. Usually, community detection
methods identify communities by maximising the modularity score within communities. Modularity refers
to the tendency of nodes to connect to other nodes within the same community relative to nodes that are
outside the community. While there are many different community detection algorithms, the current study
makes use of the infomap algorithm (Rosvall et al., 2009).
  In order for our communities to more truly represent the standards that tend to be taken together, we
need to normalize our edges so that weights do not refer to the raw counts of students’ co-enrolments. The
raw weighting does not consider the fact that standards have different populations of students. As a result,
community detection may group two standards together simply because one standard has a large number
of students. To explain more clearly, we can use the hypothetical case of English Standard A, Physics
Standard A and Physics Standard B. If English Standard A has a population of 1000 students, and 10%
of those students take Physics Standard B, the raw weight is 100 students. If 100 students took Physics
Standard A, and 90% of those students took Physics Standard B, the raw weight is 90 students. While

This is a provisional file, not the final typeset article                                                   7
Turnbull et al.                                                 Entropy of STEM Co-Enrolment Networks

we would expect the two physics standards to be grouped together, using raw counts of students as edge
weights may not result in grouping that meet these expectations. Instead, we make use of a normalization
technique called Revealed Comparative Preference (RCP) to provide more consistent communities. RCP
measures the fraction of students from standard j who also took a second standard i, relative to the overall
fraction of students taking standard i, across all other standards. More specifically:
                                                               P
                                                         xij / xij
                                                                j
                                        RCP (i, j) = P           P
                                                           xij / xij
                                                            i   ij

where xi,j is the number of students taking both standard i and j, xj ( or xi ) is the total number of students
taking standard j (respectively, standard i), and x is the total number of unique students enrolled in any
standard. This RCP metric is based on the measure Revealed Comparative Advantage, used in economics
(Balassa, 1965), and was calculated using the EconGeog package (Balland, 2017) in R (R Core Team,
2013). The RCP calculation returns a value where anything greater than 1 indicates a ‘preference’ for
two standards being taken together. A value below 1 indicates that, given the number of students in either
standard, there was no preference for the two standards being taken together.
  We remove any edge in the network where the RCP value is below 1, and subsequently any node that
no longer has any edges (isolated nodes with a degree of 0). This results in a network that consists of
standards connected by edges with a weighting relative to the preference for each standard being taken
together with its neighbors in NCEA Level 3. We then identify communities of standards that are grouped
together in our network using the infomap community detection algorithm (Rosvall et al., 2009). In simple
terms, the infomap algorithm partitions the network in a way that maximizes the number of edges within a
community, relative to the edges between communities.

2.4     Exploring Participation

  To compare student participation across the educational fields detected, we can consider the relative
proportion of students from particular years, and across school deciles and social groups. One of our goals
is to establish an idea of how each network is structured. Are the enrolments for a specified demographic
group spread more evenly across a network, or are they focused in particular areas? To answer this question,
we employ the metric of entropy. Entropy is a concept originating from the field of thermodynamics, and
provides an indication of how organised or disorganised a system is. In the case of the current study, we
use entropy to assess how participation is spread across the network. Using the measures of entropy as
signals of disparities, we then explore the rates of participation across communities and standards in finer
detail. The following section will outline our measure of entropy.

2.4.1    Entropy

  Entropy provides an aggregated metric of how ordered a system is. Systems that are highly ordered have a
lower level of entropy, while disordered systems have higher entropy. To use an analogy, a crystalline solid
with atoms focused together on a regular grid has low entropy, while a gas with atoms randomly spread
across a grid has higher entropy. Following this analogy, we may explain low entropy as an indication that a
pattern of standard enrolments is more focused or specialised in specific areas. In contrast, high entropy in
the network of standards indicates that a patterns of enrolment is more diverse. By partitioning our network

This is a provisional file, not the final typeset article                                                    8
Turnbull et al. Entropy of STEM Co-Enrolment Networks
into different social groups (e.g., across sex, ethnicity, and school decile) we can explore similarities and
differences in network structures.
We calculate entropy in two steps. Firstly, we work out the probability of a sub-population enrolling
in a specific standard given the total number of enrolments in the network for that sub-population. This
probability is given by: P q
xij
j
pqi = P
xqij
ij
where xqi is the number of students in a sub-population q enrolled in standard i, and xq is the total number
of enrolments for that sub-population. Using this measure of probability, we calculate entropy using the
following formula:
N
q
X pqi log pqi
S =−
log xq
i
Where pqi is the probability of a student from sub-population q enrolling in standard i, given the overall
total number of enrolments for that sub-population(xq ). The resulting score S q provides an single positive
value that indicates the entropy in the network, where a lower value indicates lower entropy (i.e., ordered
patterns of enrolments), and a higher value indicates higher entropy ( i.e., more disordered enrolments).
While we choose to normalise by the total number of enrolments for a sub-population, alternative methods
of normalisation are also possible. For example we could normalise by the number of standards in the
network. This would be equivalent to assuming that the probability of a student enrolling in a specific
standard is independent of the standard. This assumption does not hold for two reasons. Firstly, standards
have very different numbers of student enrolments. Secondly, different student groups are differently
represented in different standards. Normalising by xq accounts for the number of students from a sub-
population enrolled in a specific standard. However, it does not let us distinguish between effects due to
the size/popularity of a standard and those due to differing preferences of specific populations for specific
standards. A downfall of this approach is that it does not account for standards that have no enrolments for
students in a specific sub-population.
We ascertain a level of confidence by using a bootstrapping method, where we vary the count xqi in each
standard i by a uniform random amount of up to ±20%, and recalculate entropy. We repeat this process
1000 times for each entropy measure.
2.4.2 Trends
Following the entropy measure, we investigate how participation differs across demographic groups per
standard by comparing raw counts, proportions, and probabilities. The communities identified provide
a good indication of the standards that tend to be taken together, which allows us to explore rates of
participation across groups of standards as well as individual standards. We are able to explore a range of
attributes, such as such as the probabilities of sub-populations enrolling in a standard, with respect to sex,
ethnicity, school decile, and type of standard (achievement/unit standards, internally/eternally assessed).
Following the identification of different communities of standards, our goal is to explore the student
enrolment patterns in these communities. Based on trends outlined previously by (Hipkins et al., 2016) and
based on data from Ministry of Education (2018), we make the following hypotheses:
This is a provisional file, not the final typeset article 9Turnbull et al. Entropy of STEM Co-Enrolment Networks
• Female students will be more likely to have enrolled in standards in communities related to biology.
• Male students will be more likely to have enrolled in standards in communities related to physics,
calculus and computer science.
• Students who attended high decile schools will be more likely to have enrolled in externally assessed
standards.
Less research has investigated the relationship between assessment type (achievement or unit) and STEM
enrolment, but we may expect that students groups who historically succeed in traditional forms of
education (high SES, European and Asian students) to be more likely to have enrolled in externally
assessed achievement standards. Student groups who have historically been under-served by traditional
assessment may be more likely to have enrolled in unit standards.
3 RESULTS AND DISCUSSION
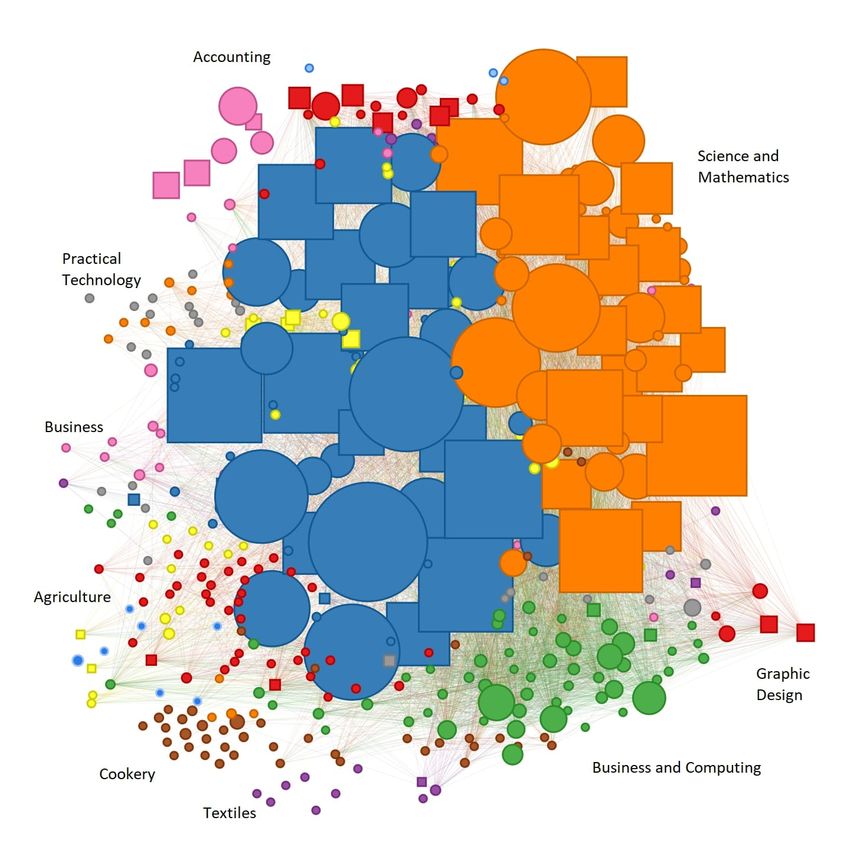
The complete co-enrolment network across all years, regions, and deciles is shown in Figure 5). Across all
years the infomap algorithm identified 42 communities of Level 3 STEM standards. As NCEA Level 3 is
the most specialised stage of high school education, we would expect our network to be strongly partitioned
into different community structures. This is reflected in a high modularity score of 0.83. The modularity
score indicates that the nodes tend to share more edges with nodes within the same community than with
nodes in different communities. The structure of the network changed over the period of time considered in
the analysis, with a significant change taking place between 2012 and 2013. During this time, a change in
education policy resulted in a reform in assessment. Science and mathematics linked unit standards were
phased out, and a new set of achievement standards were introduced. Post the education reform in 2013,
the overall number of standards diminished, and the network is mainly dominated by one community of
mathematics and science standards (see Figure 6). This policy change is also reflected in changing levels of
entropy in the network over time. As shown in Figure 7, the overall entropy of the network of assessments
(taking all students into account) decreased over time. This gives an indication that, following the reforms
to standards in 2013, student enrolments were more standardised and focused, and less flexible.
Through the use of network analysis we are able to delineate the main fields of study that comprise NCEA
Level 3 STEM. Our method of using RCP and community detection separates out standards according
to their propensity for being taken together, rather than simply classifying by subject label. The resulting
network is partitioned according to two main pathways, communities of standards reflecting progression to
university study (i.e., mainly achievement standards), and communities of standards orientated towards
vocations (unit standards, and internally assessed standards). The detected communities thus provide a
clearer picture of NCEA enrolment than broader subject labels. To provide an example, the chemistry
standard “Evaluate the interaction of a chemical process with society and/or the environment” may
not assess the same content knowledge as another chemistry standard “Demonstrate understanding of
the properties of organic compounds”. Despite both standards belonging to the chemistry domain, the
community detection algorithm assigned them to different communities in the network. While standards
assessing applications of science to other vocations or to societal issues may help in the pathway to careers
from science, standards assessing scientific theory are more representative of the pathway to university and
careers in science.
On the whole, the communities in the network tended to be comprised of standards from the same domain
of study. For example, biology standards tend to be taken in conjunction with other biology standards,
This is a provisional file, not the final typeset article 10Turnbull et al. Entropy of STEM Co-Enrolment Networks physics with physics, and so on. However, the community detection algorithm mainly grouped science and mathematics subjects in the two large communities. These two communities, which occurred at different time periods (one before 2013, and one after) can be viewed as the pathway to university study. They consist mainly of achievement standards (many of them externally assessed, especially after 2013), and include physics, biology, chemistry, and calculus. The following sections will outline some patterns that can be observed from 2010 to 2016 by sex, ethnicity and school decile. While there are a vast number of patterns to be explored and discussed further, we focus our discussion on the main patterns. We provide the reader with full access to an interactive web application that can be used to explore the network in depth (https://stur600.shinyapps.io/ ExploreNCEA_L3_STEM/). This application allows the user to filter the network by subject disciplines, types of standard, as well as school decile and demographic criteria. Through the patterns that we highlight, we seek to demonstrate the additional insights that can be gained through investigating the NCEA at a finer-grained level, and how they can further inform our understanding of what STEM participation looks like in Aotearoa New Zealand. We begin our discussion by focusing on the patterns that were seen based on students’ sex, and then move on to discuss patterns by students’ ethnicity and school decile. Patterns by Sex Overall, there were small differences in the entropy in the network by sex, with entropy being slightly higher for the male sub-population (see Figure 7). This finding suggests that the male sub-population of the network had more enrolments spread across the network, while the female sub-population were more focused in specific areas. Further investigation of communities in the network showed clear examples of disparities in subject enrolments by sex which may explain the difference in entropy. Male students tended to dominate communities defined by standards in the agriculture, engineering, and practical technology (welding, furniture making etc.) domains, while female students had greater rates of enrolments in standards related to life sciences and textiles. Corroborating the broad level trends outlined previously in the current study, and the trends detailed across other international contexts (Else-Quest et al., 2013; Sheldrake et al., 2015; National Science Foundation, 2017; of Physics, 2013), female students were more likely to enrol in biology standards, and less likely to enrol in physics and calculus standards. The majority of biology standards had around 60-70% female students across years, while female students were also more likely to have enrolled in standards in the Core Science domain. This domain includes standards such as Research a current scientific controversy (61.5% female) and Describe genetic processes (67.3% female). Female students were less likely to be represented in calculus and physics standards than male students. Investigating these disparities at the standard-level provides additional insights (see Table 1). The rates of enrolment for female students in the physics standards were low, with the proportion of female students in externally assessed physics standards being around 35% overall. The participation of female students in the standards related to calculus were also low compared to male students, with the proportion of female students being around 35-38% in the main externally assessed standards. Interestingly, the internally assessed unit standard equivalents of the calculus standards, which were available to students prior to 2013, had an increased proportion of female students (around 42-46%). Much research has been dedicated to understanding why disparities persist in physics and calculus by sex, with research often suggesting that female students tend to be less confident in mathematics and calculus compared to male students (Hofer and Stern, 2016; Heilbronner, 2012; Simon et al., 2015). It may be that the calculus unit This is a provisional file, not the final typeset article 11
Turnbull et al. Entropy of STEM Co-Enrolment Networks
Standard Assessment Type Domain Female (%)
Differentiate functions and
use derivatives to solve EX Calculus 38.2
problems
Integrate functions and use
integrals to solve problems EX Calculus 38.3
Differentiate functions and
use differentiation to solve IN (Unit) Calculus 42.3
problems
Integrate functions and use
integration to solve problems IN (Unit) Calculus 46.3
Demonstrate understanding of
wave systems EX Physics 35.2
Demonstrate understanding of
electrical systems EX Physics 34.7
Demonstrate understanding of
mechanical systems EX Physics 36.2
Table 1. Calculus and Physics Standard Enrolments by Sex. Female students were underrepresented
in calculus and physics standards in general, but especially in the external achievement standards that were
part of the pathway to university science. The representation of female students in calculus unit standards
was closer to even.
standards, which are assessed internally, in a familiar space with the opportunity to resit, offers a safer
assessment environment where female students are more comfortable (see Cheryan et al. (2017) for a
comprehensive review of the issues impacting on gender differences in STEM choice).
Patterns by Ethnicity and School Decile
We report the results for ethnicity and school decile together, given that they are inextricably linked;
Māori and Pacific students are over-represented in low decile schools. With the exception of students
attending low decile schools, the Māori and Pacific sub-populations had higher entropy, while Asian and
European students had lower entropy (see Figure 8).
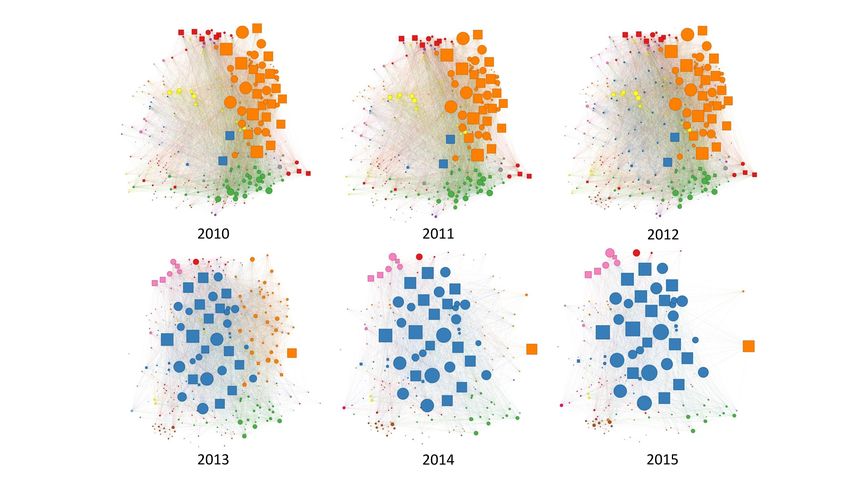
As can be seen in Figure 9 the higher entropy for the Māori and Pacific sub-populations can be attributed
to the fewer enrolments for Māori and Pacific students in science and mathematics (especially in the
communities reflecting the pathways to university science), and the relatively increased enrolments in
vocationally orientated standards. Asian and European students had more enrolments focused in science
and mathematics, and were also over-represented in externally assessed standards, which are fewer in
number than internally assessed standards.
Although enrolments for the European and Asian sub-populations were focused in the communities of
science and mathematics standards needed for university, the Asian sub-population had slightly higher
entropy across years. The Asian sub-population had more enrolments in accounting standards, as well as
mathematics and science standards overall, while the European sub-population had a narrower range of
standards and relatively fewer enrolments in internally assessed science and mathematics standards. The
higher entropy for Asian sub-population may relate to the categorical grouping of “Asian”, which contains
This is a provisional file, not the final typeset article 12Turnbull et al. Entropy of STEM Co-Enrolment Networks an extremely diverse population of students. This categorisation ranges from Pakistan and Bangladesh to China, and also some Pacific Island nations (e.g., Fijian Indians). The diversity of the population, including the cultures and social backgrounds, may have been reflected in an increased diversity of enrolments. Figure 8 shows that entropy is more similar across ethnic groups for low decile schools, and that overall, the baseline entropy (indicated by the black line) for low decile schools is greater than the baseline entropy for higher decile schools. The higher entropy for low decile schools may be a consequence of increased enrolments in internally assessed standards, and fewer enrolments in standardised, externally assessed standards. Previous research has commented on this pattern (Hipkins et al., 2016). Wilson et al. (2017) observed that lower decile schools were less likely to have students enrolled in Subject Literacy Achievement Standards, which are achievement standards that can be used as indicators of subject-specific literacy. After exploring the rates of enrolment, we also confirm that lower decile schools are less likely to have students enrolled in key externally assessed science and mathematics standards. While each ethnic group sub-population tends to have a similar entropy in low decile schools, a wider gap is present for middle and higher decile schools. For these schools, entropy is lower for Asian and European sub-populations, and higher for Māori and Pacific sub-populations. This suggests that the enrolment in STEM standards for Māori and Pacific students in middle and high deciles schools tends to be more diverse and less standardised. The lower entropy for Asian and European students is likely related to the focused participation in science and mathematics achievement standards required for university entrance, while enrolment for Māori and Pacific sub-populations is less focused in these standards and more balanced across other domains (including communities of unit standards). Table 2 shows the rates of enrolment in some key externally assessed science and calculus standards for each ethnic group sub-population, split by school decile and comparing 2010 to 2013. This is a provisional file, not the final typeset article 13
% of Asian     % of Euro      % of Māori    % of Pacific
                                                                                Standard                     Domain        Year   Low High       Low High       Low High       Low High
                                                             Differentiate functions and use
                                                             derivatives to solve problems                   Calculus      2010   36.2    52.2   17.7    23.1   11.3    15.9   13.4    15.2
                                                             Apply differentiation methods in solving
                                                                                                             Calculus      2016   35.4    57.3   19.0    25.7   9.9     16.3   13.6    18.3
                                                                                                                                                                                                                 Turnbull et al.

                                                             problems
                                                             Describe processes and patterns of              Biology       2010   19.6    32.8   18.8    29.0   10.9    23.3   7.4     17.0
                                                             evolution
                                                             Demonstrate understanding of evolutionary
                                                             processes leading to speciation                 Biology       2016   27.2    33.7   24.0    31.8   14.6    27.3   13.6    27.6
                                                             Describe aspects of organic chemistry           Chemistry     2010   25.0    40.0   14.8    24.7   7.4     16.0   10.0    12.1
                                                             Demonstrate understanding of the
                                                             properties of organic compounds                 Chemistry     2016   32.0    42.6   19.9    27.9   13.0    19.6   14.2    19.6
                                                             Demonstrate understanding of mechanical
                                                             systems                                         Physics       2010   25.4    38.0   14.7    23.9   7.0     16.7   8.4     11.0
                                                             Demonstrate understanding of mechanical
                                                             systems                                         Physics       2016   30.3    46.4   17.4    27.3   8.5     15.8   9.6     17.0

                                                            Table 2. Key Standard Enrolments by Ethnicity and Decile. The percentages of students enrolled in key externally assessed achievement
                                                            standards in STEM by ethnic group and school decile (low/high). The percentage indicates the number of students from that ethnic group in a
                                                            particular year who enrolled in the standard, as a fraction of the total number of students from that ethnic group in a particular year who took a

This is a provisional file, not the final typeset article
                                                            STEM standard. For example, of the Asian students attending a low decile school in 2010 who took a STEM standard, 36.2% took the calculus
                                                            standard Differentiate functions and use derivatives to solve problems. These percentages show that rates of enrolment differed across ethnic
                                                            groups, with varied differences within these groups by school decile, and also comparing standards offered in 2010 and 2016.

14
                                                                                                                                                                                                                 Entropy of STEM Co-Enrolment Networks
Turnbull et al. Entropy of STEM Co-Enrolment Networks While Table 2 shows that Asian and European had higher rates of participation in key externally assessed science and calculus standards, the differences between low and high school deciles appears to be considerable for the Asian sub-population compared to other groups. For example, the difference in participation for Asian students by decile in the calculus standard on differentiation offered in 2016 is 22%, compared to 6.7% for European, 6.4% for Māori, and 4.7% for Pacific Islands. This may once again point to the diversity of the categorisation of “Asian”, but importantly highlights the importance of considering ethnic group categorisations in tandem with SES. The fact that low decile and Māori and Pacific sub-populations had fewer enrolments in key science and mathematics standards provides evidence that the pathway to university science is dominated by higher decile schools, and especially Asian and European students at these schools. In contrast, students from lower decile schools, and also Māori and Pacific students in higher decile schools, had relatively more enrolments in a larger and more disparate pool of internally assessed unit standards. Unit standards provide a valuable type of assessment that prepares students for vocational careers, and it may be that a higher proportion of students from less affluent areas seek vocational careers after high school. However, this does not necessarily explain why Māori and Pacific sub-populations attending higher decile schools are less likely to be channelled into science and mathematics standards. The differing patterns of enrolment for Māori and Pacific Island sub-populations and Asian and Pakēha is complex, but may be explained in several ways. Firstly, higher decile schools primarily serving Māori and Pacific students may choose to offer more internal assessments that provide increased opportunity to assess in culturally appropriate way (e.g., less competition, more formative feedback). Secondly, and less optimistically, it may be that teachers hold lower expectations for Māori and Pacific students (Turner et al., 2015), and are less likely to place them in the pathway towards university science. This idea was reflected by a participant in a study by (Graham et al., 2010): “The teachers decide where the class is at in terms of choosing which standards [Unit versus Achievement]. It’s a disadvantage on you because it depends on what the teacher thinks you can do and what the kids in your class can do.” Our analysis also highlights the impact of a pivotal reform in the NCEA, where curriculum-linked unit standards were phased out, and the system became more standardised and less flexible. Our results suggest that this change did not result in a decrease in participation in science and mathematics for Māori and Pacific Island sub-populations who were over-represented in the curriculum-linked unit standard in earlier years. Instead, as can be seen in Table 2 enrolment often increased at a greater rate than other ethnic groups, especially in higher decile schools. For example, in high decile schools the Pacific Island sub-population saw an larger increase of around 10.6% in external biology standard relating to evolution, compared to 0.9% for Asian, 2.8% for European, and 4% for Māori. Although we cannot comment on how this educational reform impacted on students’ outcomes in science and mathematics, the reduced flexibility may actually help students by making NCEA less complex. Previous research has found that the complexity of NCEA can be confusing for students and parents to navigate (Graham et al., 2010; Jensen et al., 2010). 3.1 Implications and Future Directions The current study fills a gap in the previous literature by investigating patterns of co-enrolments in NCEA Level 3 STEM standards by students’ sex, ethnicity, and a proxy measure of SES. We believe that this study is the first of its kind to use bipartite networks to represent high school assessment data. Through our methodological approach, we are able to take into account a wealth of information related to students and the standards that they enrolled in. This includes demographic information (such as sex and ethnicity) This is a provisional file, not the final typeset article 15
Turnbull et al.                                                Entropy of STEM Co-Enrolment Networks

and specific NCEA Level 3 standard information, such as the manner in which standards were assessed
(externally or internally), and whether the standard was an achievement standard (traditional curriculum
based subjects, such as English or science) or a unit standard (more vocational subjects, such as farming or
practical technology).
  The NCEA is very complex, but our method of analysis allows us to consider the different pathways
that students follow based on the assessments they enrolled in. The communities of standards highlighted
through our analysis reflect two main pathways, either towards vocations and careers from science, or the
pathway towards university and careers in science. Despite growing discussion regarding the outcomes
of different types of standards in the Aotearoa New Zealand context (Hipkins et al., 2016; Lipson, 2017),
there has been a lack of research into how this information relates to student background. The methodology
and results outlined in the current study enables us to represent the NCEA as a complex education system,
and this can provide detailed insights into what science participation looks like.
  A limitation of our analysis is the fact that we do not have access to students’ level of achievement in the
standards they enrolled in Level 3, or in previous years. As detailed by Jensen et al. (2010), achievement
outcomes in standards would be highly influential in shaping the pathways that open up or close off
for students as they go through NCEA. Furthermore, the disparities seen in participation in key science
standards may be tied to the development of academic identity (Bolstad and Hipkins, 2008) which we are
also unable to quantify. (Archer et al., 2014, p.216) argue that “‘cleverness’ [can be viewed] as a racialized,
gendered, and classed discourse, such that the identity of the ‘ideal’ or ‘clever’ student is not equally open
to all students as a viable and authentic identity.” This notion of ‘cleverness’ may explain the disparities
found in the current study. More specifically, it may be that the ‘clever’ pathway through NCEA is not
open to all students. As described by Hipkins et al. (2016), NCEA informally developed into a two-tiered
system, with curriculum-linked unit standards commonly being viewed an easy pathway, and achievement
standards, and especially externally assessed achievement standards, being viewed as a tougher pathway.
Students who identify as less academic may purposefully seek easy pathways through NCEA, without fully
understanding that doing so can reduce educational opportunities later on (Jensen et al., 2010).
  Students with a family background of success in education may be more likely to view the academic
pathway as normal or even expected. This idea is described in a related study of high school science
pathways in the United Kingdom, where Archer et al. (2017) found that students from more affluent
backgrounds were more likely to see the science-orientated pathway as an ‘obvious’ choice. Students from
less affluent backgrounds may also be more motivated to seek full time employment, rather than pursue
a pathway towards university study and the debt it may entail. However, the question remains as to the
extent to which student from less affluent backgrounds knowingly choose vocational pathways and are not
channeled down this pathway by simply attended a school in a low SES area.

4   CONCLUSION
The current study uses network science methods to explore disparities in science participation in Aotearoa
New Zealand. It summarises the broad rates of participation by sex and school decile, and also participation
at a finer-grained level through a network analysis of STEM standard co-enrolments for the final year of
high school. The initial summary of science participation showed that male students have been more likely
to take ‘physical’ subjects (e.g., physics, calculus, practical technology), while female students have been
more likely to take life science subjects (e.g., biology, health). A network analysis of NCEA enrolment data

This is a provisional file, not the final typeset article                                                  16
You can also read