Leading Into the Future - Valhalla Community School A Northern Alberta Charter School
←
→
Page content transcription
If your browser does not render page correctly, please read the page content below
Authority: 0224 Valhalla School Foundation

    Leading Into the Future
 Valhalla Community School
  A Northern Alberta Charter School

  Three Year Education Plan 2018-2021

Annual Education Results Report 2017-2018

           November 30, 2018

                                                              Page 1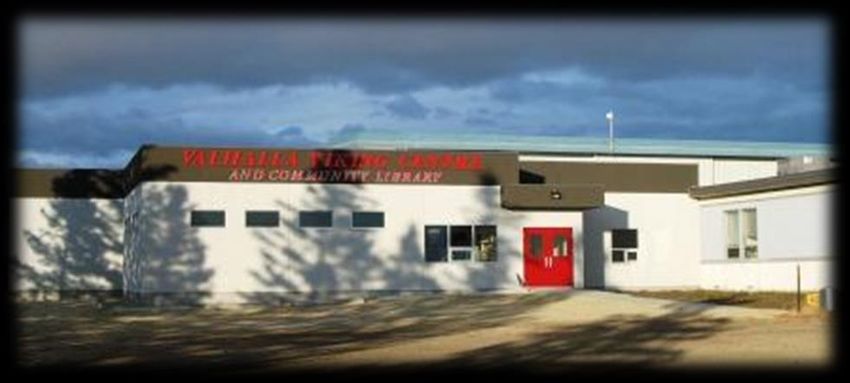
Authority: 0224 Valhalla School Foundation

Message from the Board Chair
The Valhalla School Foundation Board of Directors is pleased with many of the results as
reported in our Three Year Education Plan 2018-2021 and the Annual Education Results
Report 2017-2018, as we achieved an overall rating of ‘Excellent’ in six of the ten
Accountability Pillar Survey measures. While we are naturally disappointed with the current
PAT results, we are conscious that these results, in a small school, do tend to vary from year to
year. We are confident that strategies being actively pursued by the Valhalla Community
School will continue to be effective in working to carry out our vision of equipping students
with both knowledge and skills that will enable them to make positive contributions at their
future places of employment, as well as in the communities or groups with which they choose
to associate. We would also like to note and recognize the efforts of our staff in developing
and implementing a database of internal standardized testing to help all stakeholders
understand the effectiveness and progress of our charter school program.

The Charter Board would like to acknowledge the great benefit to all Albertans, in that we are
part of a provincial education system that allows equality for every child by providing charter
public school choice. In 2008, when the VSF was granted its charter, grounded in whole group
direct instruction, incorporating mandatory second language and student leadership
development, it created the opportunity for students to have the freedom to choose a Charter
Public School education in rural, northern Alberta for the first time. As always, we are
committed to learning, growth and development for all those involved in our charter public
school system and with that, it is the privilege of the charter board to commit to good
governance and the efficient, accountable use of the tax dollars entrusted to us, thereby
ensuring we have the resources available to meet our goals of producing students who are
excellent communicators, prepared for community involvement and leadership.

On behalf of the Charter Board, I would like to thank our families and community, along with
our dedicated staff, for their continued support, commitment and partnership in carrying out
the vision for our students and making the Valhalla Community School a special place to be.

Sincerely,

____________________________
Nancy Westad, Board Chair

                                                                                              Page 2
Authority: 0224 Valhalla School Foundation
Accountability Statement
The Annual Education Results Report for the 2017-2018 school year and the Education Plan
for the three years commencing September 1, 2018 for Valhalla School Foundation was
prepared under the direction of the Board in accordance with its responsibilities under the
School Act. This document was developed in the context of the provincial government’s
business and fiscal plans. The Board has used the results reported in the document, to the best
of its abilities, to develop the Education Plan and is committed to implementing the strategies
contained within the Education Plan to improve student learning and results. The Board
approved this combined Annual Education Results Report for the 2017/2018 school year and
the three-year Education Plan for 2017-2020 on November 21, 2018.
____________________________ November 30, 2018
Mrs. Nancy Westad, Board Chair Date
____________________________ November 30, 2018
Mr. John Picard, Superintendent Date
Board of Directors
Nancy Westad (Chair) Jerry Shepelwick
Tamara Fricke Brandie Skaksen
Paul Gibson Janelle Trodd
Senior Officials
Superintendent of Schools.................................................................................... Mr. John Picard
Secretary Treasurer ............................................................................................... Mrs. Anna Odd
Transportation Supervisor …………………………………………………...Mr. John Moutray
Page 3Authority: 0224 Valhalla School Foundation
Foundation Statements
Vision and Purpose
The Valhalla Community School (VCS) aims to instil a readiness for leadership by equipping its rural
students with both knowledge and skills that will enable them to make positive contributions at their future
places of employment, as well as in the communities or groups with which they choose to associate.
Mission
The Valhalla Community School (VCS) prepares students with the attitudes, knowledge and skills necessary
for success in a rapidly changing economy. Students will develop strong ethical and civic standards, a solid
commitment to their families, neighbourhood, school, province, and country.
Guiding Philosophies and Principles
The Valhalla School Foundation (VSF) views rural education as possessing unique and beneficial
characteristics with the potential to maximize student learning. In general, rural students approach life from
an entrepreneurial perspective and have close, personal ties to members of their family and community.
According to the work of Gordon Neufeld (Hold On To Your Kids: Why Parents Need to Matter More
Than Peers, Vintage Canada, 2005) the connectedness of a community has a significant impact on the
“parent-orientation” of a child and, by extension, contributes to their success in school. Similarly, multi-
grade groupings contribute to an environment that encourages this same sense of community connectedness.
The VSF believes the unique aspects of rural education that distinguish it from its urban cousin call for a
diligent focus on structured teaching practises that maximize opportunities for all students. In addition, direct
community involvement will underscore the importance of civic commitment and participation for the
students of VCS. The VSF believes it must provide students with opportunity to develop the knowledge,
skills and attitudes necessary for success in both urban and rural settings.
The VSF recognizes the central role of parent and guardian in the life of a child and therefore sees itself as a
partner commissioned to foster academic success as part of the overall process of child development. It is a
priority that parents form a majority of the Foundation’s representatives.
The VSF recognizes that it is in the students’ best interest for the Foundation to support its educators by
clearly defining all goals and expectations and providing the means necessary for them to be carried out. The
VSF views self-confidence as a product of competence. It commits to student success in academics and
leadership in an atmosphere of supportive encouragement.
The VSF holds in high regard for its students the skills of memorization of both prose and arithmetic, mental
calculation and dignified visual presentation of written work in the form of excellent penmanship and
recognizes the role of diligent drill and practise in fostering regular, automatic presentation of said mastered
skills. The VSF strongly upholds the skill of critical thinking as an important part of child development. It is
a crucial tool for developing logic and the Foundation purports it is through the mastery of skills and the
acquiring of knowledge that one formulates a basis for such critical analysis. As students advance, the focus
on skills and knowledge can naturally lead to more opportunities for abstract reasoning, logic and self-reliant
thought processes.
Page 4Authority: 0224 Valhalla School Foundation
Jurisdiction Profile
Valhalla Community School is located in the hamlet of Valhalla Centre, located approximately 50 km
north west of Grande Prairie, Alberta. The first school was opened in 1916; parent volunteers built a
log school house, and the board required each parent to build school desks for their own children. The
current school building was built in 1954, and is today owned and operated by the Valhalla Heritage
Society.
Valhalla Community School was started by a group of parents and local residents when adjustments
were made to the local school boundaries in early 2008, and the school was slated to close at the end of
June, 2008. Parents and supporters formed a steering committee to explore and develop initiatives.
This committee began a series of meetings with the stakeholders in the local education system, and the
opportunity to start a charter school emerged. In the space of a few months, and with the help of
Alberta Education the charter process was completed, and Valhalla Community School commenced
classes on September 2nd, 2008.
Valhalla Community School now offers Kindergarten to Grade 9 and while registration varies as is the
case in many small rural schools, we have seen very strong registration in Kindergarten (15 or more)
over the last four years, with the resultant strong numbers in the elementary grades. We recognize that
the charter focus and programming at VCS will be successful to the degree that students follow the
program starting in their formative years. In order to foster this, our communication plans have had a
particular focus to help the community understand the charter goals and attract students to the program
beginning in Kindergarten. This has borne fruit and the registration numbers in the kindergarten and
first cycle elementary years as well as our partner pre-school programs in Valhalla are strong, which
bodes well for the future stability and success of our school and our students.
Over the years, schools in Valhalla Centre have been strongly supported by the community. This
tradition remains unshakeable and forms the cornerstone of the Valhalla School Foundation and the
Valhalla Community School, in partnership with the local Valhalla Heritage Society, which owns the
school building. It is the determination and unflagging commitment of the community that has made a
Charter School in Valhalla Centre a reality. Rural leadership as a focus of the school is an articulation
of these values.
Valhalla School continues to enjoy excellent Parent Satisfaction Survey results, and it continues to be a
goal to maintain and improve on this high standard. As we have adapted to the realities of our changed
student profile, and at the same time continue to build our student body from the early years, we are
seeing a continuation of the successes already experienced and the fulfillment of the promise which our
rural community school holds for all students. We strive to ensure our decisions are made in the spirit
of our Charter and in the best interests of student learning. We remain creative in meeting program
needs at the Valhalla Community School and strive to ensure stakeholder satisfaction with the quality
of basic education and timeliness of services for students.
Page 5Authority: 0224 Valhalla School Foundation
Trends, Issues and Future Challenges
We consistently strive to provide a stable foundation of high expectations that best assists students to prepare
for their futures as well-adjusted, contributing citizens. We support the continued commitment of staff to engage
in reflective practice, continuous improvement and collaborative decision-making. This ongoing and sustained
support provides continuity of purpose as we build our citizenry of tomorrow.
Trends
We value our students as learners and encourage them take ownership of their learning, to develop solid
foundations and competencies, and to take leadership to solve real life problems. Through the use of Direct
Instruction and the application of our Teaching and Learning Framework, we create learning environments
where our students are supported with differentiated structured programming through grouping students
according to their level. Reflecting research in Direct Instruction, we continue to develop effective strategies
and practices to ensure successful student learning through clear objectives and routines, scaffolding learning
through appropriate scope and sequence, and continuous formative assessment. An additional focus has been to
ensure the alignment of the “Writing Road to Reading” and the “Reading Mastery” programs as well as the
“JUMP” and “Saxon” math programs with the Alberta Program of Studies.
Valhalla School Foundation administration and staff continue to systematically utilize Provincial Achievement
Test and other standardized test results to inform teacher long range plans and to influence the practice of
teaching, with the goal of ensuring that student learners at Valhalla meet or exceed provincial averages. This
has resulted in overall improvements in our internal assessments, while success on the Provincial Achievement
Test scores varies from year to year, highly dependent on the cohort taking the tests, as is typical in very small
schools. In order to develop some stability and long-term understanding of the strengths and challenges of our
program, the Valhalla Community School staff have developed and continue to improve upon internal
standardized assessment tools and database.
Valhalla School Foundation has provided students and staff with the support of teaching aides to support
inclusion of an increased number of ELL students and students who have a variety of learning challenges. To
improve engagement rates and focus in the classroom, VSF teachers have experienced ongoing staff
development to provide a consistent approach to classroom management as well as strategies to enhance student
motivation and performance.
Over the past five years, numerous initiatives have been implemented at Valhalla Community School to meet
the needs of our students, related to challenges including higher numbers of ELL students, more students with
special needs, students behind in their studies, and need for higher parental involvement in the education of their
children.
By all accounts, including local surveys, local assessments, Accountability Pillar results, and prior PAT results,
these initiatives have met with success. Student skills in literacy and numeracy are better developed, the sense
of belonging and community among parents and their children continues to increase, student motivation and
success are higher at the junior high level, and the quality and reputation of the school is solid.
Page 6Authority: 0224 Valhalla School Foundation
As a result of the Charter School Evaluation and Renewal process, a number of new initiatives have been
implemented that represent the next steps in fulfilling the promise of our charter school. These initiatives will
be carried out as a result of the renewal of our charter granted in February of 2018. They include:
• Two action research projects;
• A renewed partnership with education students at Grande Prairie Regional College;
• The continuous development of local standardized assessments, and;
• The continuous implementation and development of our Direct Instruction Teaching and Learning
Framework.
Issues and Future Challenges
Supporting our students adequately is an ongoing challenge due to funding inequities that we are constantly
facing. Funding initiatives that do not include charter schools and inequitable transportation funding have had a
negative impact on our financing.
Added to this, our registration numbers, although still strong in the lowest grades, have not grown due to the
high level of transience in our area. These low numbers combined with the inequitable funding bring us
numerous challenges in our budget numbers.
Page 7Authority: 0224 Valhalla School Foundation
Summary of Accomplishments – 2017-2018
● Granted a five-year renewal of our charter.
● Continued with expanded leadership program including rotating student council (all junior
high students have opportunity to experience membership and work in Student Council) and
increased leadership/citizenship instruction and practice in all grades
o includes student planned, led and performed productions: Remembrance Day,
Christmas, Spring Sing Talent Show, etc.
o service program partnering young student with older students for shared activities and
help: eg. paired reading, shared lunches, etc.
o Student Council planned and implemented programs such as School Spirit Days, in-
school fundraisers, celebration activities
● Continued “Enhanced Learning Opportunity” class for all Junior High students; 30 minutes
daily of teacher supervised time to learn and practice study skills and work on homework
assignments
● Continued junior high “Study, Knowledge, Initiative and Life-long Learning” (SKILL)
Program to provide increased support to struggling students
● Partnership with FCSS and AHS for student support services
● Developing partnership with local provider for dyslexia support services
● Programs to enhance parental involvement in school life
o continued active School Council
o improved registration process continued to ensure accurate, timely student registration
o implementation of documentation and process to intentionalize and strengthen parent-
school partnership
o implementation of program to increase participation in School Council
▪ classroom assignments requiring all classes from grade 3-9 to attend one
School Council meeting per year with a parent (as per charter requirement)
▪ goals: meet charter requirement for students to experience a community style
meeting each year, increase parent involvement and participation at School
Council
● Seven-day grade 8-9 cultural/language field trip to Quebec City, Montreal and Ottawa
● Ongoing and increasing collaboration with area schools
● Participated in transition meetings with local high school to coordinate curriculum and
expectations for supporting success of VCS students when they graduate into high school
● Staff development of Direct Instruction Framework and internal standardized assessment
program to document student success and growth
● All classroom staff (certified teachers and Educational Assistants) traveled to Edmonton to
participate in Professional Development at the annual TAAPCS conference
● Development of Internal Standardized Assessment (ISA) database to record student
performance and growth
o ongoing documentation of individual student and cohort performance
o documentation of:
▪ ISA results (all students assessed twice per year)
▪ PAT results
▪ Report Card Final marks.
Page 8Authority: 0224 Valhalla School Foundation
Combined 2018 Accountability Pillar Overall Summary (Required for Public/Separate/Francophone/Charter
School Authorities and Level 2 Private Schools)
Valhalla School Foundation Alberta Measure Evaluation
Measure Category Measure Prev Prev 3 Prev Prev 3
Current Current
Year Year Year Year Achievement Improvement Overall
Result Result
Result Average Result Average
Safe and Caring Schools Safe and Caring 88.6 85.8 89.4 89.0 89.5 89.4 Very High Maintained Excellent
Program of Studies 79.4 78.6 78.4 81.8 81.9 81.7 High Maintained Good
Education Quality 93.2 92.8 93.1 90.0 90.1 89.9 Very High Maintained Excellent
Student Learning
Opportunities Drop Out Rate 10.2 6.1 3.8 2.3 3.0 3.3 Very Low Maintained Concern
High School Completion Rate
n/a n/a n/a 78.0 78.0 77.0 n/a n/a n/a
(3 yr)
Student Learning PAT: Acceptable 67.1 85.4 79.7 73.6 73.4 73.3 Low Maintained Issue
Achievement (Grades K-9) PAT: Excellence 2.6 25.0 16.8 19.9 19.5 19.2 Very Low Declined Concern
Diploma: Acceptable n/a n/a n/a 83.7 83.0 83.0 n/a n/a n/a
Diploma: Excellence n/a n/a n/a 24.2 22.2 21.7 n/a n/a n/a
Student Learning
Achievement (Grades 10- Diploma Exam Participation
n/a n/a n/a 55.7 54.9 54.7 n/a n/a n/a
12) Rate (4+ Exams)
Rutherford Scholarship
n/a n/a n/a 63.4 62.3 61.5 n/a n/a n/a
Eligibility Rate
Transition Rate (6 yr) n/a n/a n/a 58.7 57.9 59.0 n/a n/a n/a
Preparation for Lifelong
Learning, World of Work, Work Preparation 91.7 95.8 90.6 82.4 82.7 82.4 Very High Maintained Excellent
Citizenship
Citizenship 86.1 81.5 83.9 83.0 83.7 83.7 Very High Maintained Excellent
Parental Involvement Parental Involvement 87.1 97.5 95.4 81.2 81.2 81.0 Very High Maintained Excellent
Continuous Improvement School Improvement 89.5 79.4 83.7 80.3 81.4 80.7 Very High Maintained Excellent
Notes:
1. Data values have been suppressed where the number of respondents/students is fewer than 6. Suppression is marked with an asterisk (*).
2. Overall evaluations can only be calculated if both improvement and achievement evaluations are available.
3. Results for the ACOL measures are available in the detailed report: see "ACOL Measures" in the Table of Contents.
4. Survey results for the province and school authorities were impacted by the changes in the number of students responding to the survey through
the introduction of the OurSCHOOL/TTFM (Tell Them From Me) survey in 2014.
5. Aggregated PAT results are based upon a weighted average of percent meeting standards (Acceptable, Excellence). The weights are the number
of students enrolled in each course. Courses included: English Language Arts (Grades 6, 9, 9 KAE); Français (Grades 6, 9); French Language
Arts (Grades 6, 9); Mathematics (6, 9, 9 KAE); Science (Grades 6, 9, 9 KAE); and Social Studies (Grades 6, 9, 9 KAE).
6. Participation in Provincial Achievement Tests was impacted by the flooding in June 2013 (Grade 9 only) and by the fires in May to June 2016.
Caution should be used when interpreting trends over time for the province and those school authorities affected by these events.
7. Aggregated Diploma results are a weighted average of percent meeting standards (Acceptable, Excellence) on Diploma Examinations. The
weights are the number of students writing the Diploma Examination for each course. Courses included: English Language Arts 30-1; English
Language Arts 30-2; French Language Arts 30-1; Français 30-1; Mathematics 30-1; Mathematics 30-2; Chemistry 30; Physics 30; Biology 30;
Science 30; Social Studies 30-1; and Social Studies 30-2.
8. Caution should be used when interpreting evaluations and results over time for Mathematics 30-1/30-2, as equating was not in place until the
2016/17 school year. Alberta Education does not comment on province wide trends until it has five years of equated examination data.
9. Participation in Diploma Examinations was impacted by the flooding in June 2013 and by the fires in May to June 2016. Caution should be used
when interpreting trends over time for the province and those school authorities affected by these events.
10. Weighting of school-awarded marks in diploma courses increased from 50% to 70% in the 2015/2016 school year. Caution should be used when
interpreting trends over time.
11. Due to the change from previous data source systems to Provincial Approach to Student Information (PASI), Rutherford Scholarship Eligibility Rate
results prior to 2015 are not available.
Page 9Authority: 0224 Valhalla School Foundation
Combined 2018 Accountability Pillar First Nations, Métis and Inuit Summary
(Required for Public/Separate/Francophone School Authorities)
Valhalla School Foundation
Alberta (FNMI) Measure Evaluation
(FNMI)
Measure Category Measure Prev Prev 3 Prev Prev 3
Current Current
Year Year Year Year Achievement Improvement Overall
Result Result
Result Average Result Average
Safe and Caring Schools Safe and Caring n/a n/a n/a n/a n/a n/a n/a n/a n/a
Program of Studies n/a n/a n/a n/a n/a n/a n/a n/a n/a
Education Quality n/a n/a n/a n/a n/a n/a n/a n/a n/a
Student Learning
Opportunities Drop Out Rate n/a * n/a 4.8 5.8 6.3 n/a n/a n/a
High School Completion Rate
n/a n/a n/a 53.3 53.7 50.5 n/a n/a n/a
(3 yr)
Student Learning PAT: Acceptable n/a n/a n/a 51.7 51.7 52.0 n/a n/a n/a
Achievement (Grades K-9) PAT: Excellence n/a n/a n/a 6.6 6.7 6.5 n/a n/a n/a
Diploma: Acceptable n/a n/a n/a 77.1 77.1 76.6 n/a n/a n/a
Diploma: Excellence n/a n/a n/a 11.0 10.7 10.3 n/a n/a n/a
Student Learning
Achievement (Grades 10- Diploma Exam Participation
n/a n/a n/a 24.4 21.8 21.2 n/a n/a n/a
12) Rate (4+ Exams)
Rutherford Scholarship
n/a n/a n/a 35.9 34.2 33.0 n/a n/a n/a
Eligibility Rate
Transition Rate (6 yr) n/a n/a n/a 33.0 31.8 32.8 n/a n/a n/a
Preparation for Lifelong
Learning, World of Work, Work Preparation n/a n/a n/a n/a n/a n/a n/a n/a n/a
Citizenship
Citizenship n/a n/a n/a n/a n/a n/a n/a n/a n/a
Parental Involvement Parental Involvement n/a n/a n/a n/a n/a n/a n/a n/a n/a
Continuous Improvement School Improvement n/a n/a n/a n/a n/a n/a n/a n/a n/a
Notes:
1. Data values have been suppressed where the number of respondents/students is fewer than 6. Suppression is marked with an asterisk (*).
2. Overall evaluations can only be calculated if both improvement and achievement evaluations are available.
3. Aggregated PAT results are based upon a weighted average of percent meeting standards (Acceptable, Excellence). The weights are the
number of students enrolled in each course. Courses included: English Language Arts (Grades 6, 9, 9 KAE); Français (Grades 6, 9); French
Language Arts (Grades 6, 9); Mathematics (6, 9, 9 KAE); Science (Grades 6, 9, 9 KAE); and Social Studies (Grades 6, 9, 9 KAE).
4. Participation in Provincial Achievement Tests was impacted by the fires in May to June 2016. Caution should be used when interpreting trends
over time for the province and those school authorities affected by this event.
5. Aggregated Diploma results are a weighted average of percent meeting standards (Acceptable, Excellence) on Diploma Examinations. The
weights are the number of students writing the Diploma Examination for each course. Courses included: English Language Arts 30-1; English
Language Arts 30-2; French Language Arts 30-1; Français 30-1; Mathematics 30-1; Mathematics 30-2; Chemistry 30; Physics 30; Biology 30;
Science 30; Social Studies 30-1; and Social Studies 30-2.
6. Caution should be used when interpreting evaluations and results over time for Mathematics 30-1/30-2, as equating was not in place until the
2016/17 school year. Alberta Education does not comment on province wide trends until it has five years of equated examination data.
7. Participation in Diploma Examinations was impacted by the fires in May to June 2016. Caution should be used when interpreting trends over time
for the province and those school authorities affected by this event.
8. Weighting of school-awarded marks in diploma courses increased from 50% to 70% in the 2015/2016 school year. Caution should be used when
interpreting trends over time.
9. Due to the change from previous data source systems to Provincial Approach to Student Information (PASI), Rutherford Scholarship Eligibility
Rate results prior to 2015 are not available.
10. Student demographic data used when calculating Student Outcome Measures and Provincial Achievement Tests results was updated in October
2016. This impacted results based on enrolment (e.g., self-identified First Nations, Metis and Inuit), exception (e.g., learning disability) and grant
program codes (e.g., English as Second Language students) reported in previous years.
11. 2016 results for the 3-year High School Completion and Diploma Examination Participation Rates have been adjusted to reflect the correction of
the Grade 10 cohort.
12.
Page 10Authority: 0224 Valhalla School Foundation
Measure Evaluation Reference (Optional)
Achievement Evaluation
Achievement evaluation is based upon a comparison of Current Year data to a set of standards which remain consistent over time. The
Standards are calculated by taking the 3 year average of baseline data for each measure across all school jurisdictions and calculating the
5th, 25th, 75th and 95th percentiles. Once calculated, these standards remain in place from year to year to allow for consistent planning and
evaluation.
The table below shows the range of values defining the 5 achievement evaluation levels for each measure.
Measure Very Low Low Intermediate High Very High
Safe and Caring 0.00 - 77.62 77.62 - 81.05 81.05 - 84.50 84.50 - 88.03 88.03 - 100.00
Program of Studies 0.00 - 66.31 66.31 - 72.65 72.65 - 78.43 78.43 - 81.59 81.59 - 100.00
Education Quality 0.00 - 80.94 80.94 - 84.23 84.23 - 87.23 87.23 - 89.60 89.60 - 100.00
Drop Out Rate 100.00 - 9.40 9.40 - 6.90 6.90 - 4.27 4.27 - 2.79 2.79 - 0.00
High School Completion Rate (3 yr) 0.00 - 57.03 57.03 - 62.36 62.36 - 73.88 73.88 - 81.79 81.79 - 100.00
PAT: Acceptable 0.00 - 66.07 66.07 - 70.32 70.32 - 79.81 79.81 - 84.64 84.64 - 100.00
PAT: Excellence 0.00 - 9.97 9.97 - 13.44 13.44 - 19.56 19.56 - 25.83 25.83 - 100.00
Diploma: Acceptable 0.00 - 71.45 71.45 - 78.34 78.34 - 84.76 84.76 - 87.95 87.95 - 100.00
Diploma: Excellence 0.00 - 9.55 9.55 - 12.59 12.59 - 19.38 19.38 - 23.20 23.20 - 100.00
Diploma Exam Participation Rate (4+ Exams) 0.00 - 31.10 31.10 - 44.11 44.11 - 55.78 55.78 - 65.99 65.99 - 100.00
Transition Rate (6 yr) 0.00 - 39.80 39.80 - 46.94 46.94 - 56.15 56.15 - 68.34 68.34 - 100.00
Work Preparation 0.00 - 66.92 66.92 - 72.78 72.78 - 77.78 77.78 - 86.13 86.13 - 100.00
Citizenship 0.00 - 66.30 66.30 - 71.63 71.63 - 77.50 77.50 - 81.08 81.08 - 100.00
Parental Involvement 0.00 - 70.76 70.76 - 74.58 74.58 - 78.50 78.50 - 82.30 82.30 - 100.00
School Improvement 0.00 - 65.25 65.25 - 70.85 70.85 - 76.28 76.28 - 80.41 80.41 - 100.00
Notes:
1) For all measures except Drop Out Rate: The range of values at each evaluation level is interpreted as greater than or equal to the lower
value, and less than the higher value. For the Very High evaluation level, values range from greater than or equal to the lower value to
100%.
2) Drop Out Rate measure: As "Drop Out Rate" is inverse to most measures (i.e. lower values are "better"), the range of values at each
evaluation level is interpreted as greater than the lower value and less than or equal to the higher value. For the Very High evaluation
level, values range from 0% to less than or equal to the higher value.
Improvement Table
For each jurisdiction, improvement evaluation consists of comparing the Current Year result for each measure with the previous three-year
average. A chi-square statistical test is used to determine the significance of the improvement. This test takes into account the size of the
jurisdiction in the calculation to make improvement evaluation fair across jurisdictions of different sizes.
The table below shows the definition of the 5 improvement evaluation levels based upon the chi-square result.
Evaluation Category Chi-Square Range
Declined Significantly 3.84 + (current < previous 3-year average)
Declined 1.00 - 3.83 (current < previous 3-year average)
Maintained less than 1.00
Improved 1.00 - 3.83 (current > previous 3-year average)
Improved Significantly 3.84 + (current > previous 3-year average)
Overall Evaluation Table
The overall evaluation combines the Achievement Evaluation and the Improvement Evaluation. The table below illustrates how the
Achievement and Improvement evaluations are combined to get the overall evaluation.
Achievement
Improvement Very High High Intermediate Low Very Low
Improved Significantly Excellent Good Good Good Acceptable
Improved Excellent Good Good Acceptable Issue
Maintained Excellent Good Acceptable Issue Concern
Declined Good Acceptable Issue Issue Concern
Declined Significantly Acceptable Issue Issue Concern Concern
Category Evaluation
The category evaluation is an average of the Overall Evaluation of the measures that make up the category. For the purpose of the
calculation, consider an Overall Evaluation of Excellent to be 2, Good to be 1, Acceptable to be 0, Issue to be -1, and Concern to be -2. The
simple average (mean) of these values rounded to the nearest integer produces the Category Evaluation value. This is converted back to a
colour using the same scale above (e.g. 2=Excellent, 1=Good, 0=Intermediate, -1=Issue, -2=Concern)
Page 11Authority: 0224 Valhalla School Foundation
Charter Goals
CHARTER GOAL ONE: To produce students who are excellent communicators.
Outcome 1:1: Students will communicate with intelligence, using grammatically correct language in both
spoken and written word, by mastering the basic skills of reading, writing and arithmetic.
Results (in percentages) Target Targets
Performance Measures
2014 2015 2016 2017 2018 2018 2019 2020 2021
Percent of parents satisfied that students communicate with
intelligence, using grammatically correct language in both 91.0 100.0 97.0 100.0 100.0 97.0 98.0 100.0 100.0
spoken and written word.
Percent of parents satisfied with improvement in students’
91.0 100.0 100.0 100.0 100.0 100.0 100.0 100.0 100.0
math skills and understanding.
Percent of teachers satisfied that the programs and
resources reflect the Program of Studies and the objectives 88.0 100.0 100.0 100.0 100.0 100.0 100.0 100.0 100.0
of the Charter.
Percent of teachers satisfied with the improvement of student
90.0 100.0 100.0 100.0 100.0 100.0 100.0 100.0 100.0
basic skills in reading, writing and mathematics.
Percent of teachers satisfied that the Peer Coaching program
has resulted in the adoption of one or more new teaching 83.0 67.0 100.0 100.0 100.0 100.0 100.0
strategies in their practice.
Percent of teachers satisfied that the Peer Coaching program
has resulted in improved communication and collegial 100.0 83.0 100.0 100.0 100.0 100.0 100.0
support in the school.
Percent of teachers who are satisfied that the Peer Coaching
100.0 67.0 100.0 100.0 100.0 100.0 100.0
program has resulted in improved student engagement.
Percentage of students who have been in the “Reading
Mastery” program for two years who are at or above grade 79.0 100.0 100.0 100.0 100.0 100.0 100.0 100.0 100.0
level in reading.
Percentage of students who have been in the “Reading
Mastery” program for two years who are above grade level in 38.0 63.0 70.0 78.0 80.0 66.0 81.0 82.0 83.0
reading.
PAT Results See Page 38 and 39
Comment on Results
Our Reading Mastery results have revealed the extreme reading challenges that some of our older students brought with them in
registering in the upper grades, but also show the general progress and attainment of students (see chart). Our PAT results have
strongly improved in recent years, although we struggled with a weak cohort in 6 and 9 along with the anomalies of small cohorts
this past year. Our survey results continue to indicate that there are strong levels of satisfaction with improvement in basic skills.
Strategies
• Staff have been responsible for the development of a clear Direct Instruction Teaching and Learning Framework
and are continually working on improved implementation as a function of their professional growth plans.
• Local standardized assessment tools have been identified and baseline assessment measures have been taken
throughout the course of the school year. (see below)
• Teachers continue to analyze and compare their programs and resources to the Program of Studies and the
expectations of the Charter.
• Implementation of the Writing Road to Reading continues, with adjustments to the literacy program to best utilize
time and to ensure an appropriate scope and sequence of learning.
• Teacher professional development has been enhanced through regular meetings, regular Peer Coaching, and
student feedback.
• Increase cross-curricular emphasis on writing skills and opportunities and the implementation of an intentional
cursive writing program.
Page 12Authority: 0224 Valhalla School Foundation
INTERNAL STANDARDIZED ASSESSMENT INITIATIVE
While our previous CTBS testing exercise had become much more efficient, through concentrating on literacy
and numeracy, we had found that the cost in terms of resources and time was high relative to the actual
benefits. As a result, it was decided to put more time and effort into the development and application of locally
developed standardized assessment practices.
This initiative is bearing fruit, with the development of local standardized tests, in the five core subjects of
Mathematics, Language Arts, Social Studies, Science, and French as a Second Language, at all grade levels
from to Grade Nine. We have also contracted with an exterior partner to develop a database to track
assessments and provide our staff and other stakeholders with data, tracked over time, for individual students,
for each core subject discipline, and for cohorts by year of entry in Kindergarten.
We have data for most core subjects and most of our grade levels for the fall of this year (2018), and will begin
with reporting on these initial assessments in the Annual Education Report for the 2018-2019 school year.
Page 13Authority: 0224 Valhalla School Foundation
Outcome 1:2: Students will communicate with confidence on a broad range of subjects by developing a firm
understanding of history, science, and fine arts.
Results (in percentages) Target Targets
Performance Measures
2014 2015 2016 2017 2018 2018 2019 2020 2021
Percent of parents satisfied that students communicate with
98.0 97.0 97.0 100.0 96.9 100.0 100.0 100.0 100.0
confidence on a broad range of subjects.
Percent of teachers satisfied with program improvement
67.0 60.0 100.0 100.0 100.0 100.0 100.0 100.0 100.0
based on analysis of PAT results.
PAT results in Science and Social Studies See PAT results Page 38 and 39
Strategies
• Local standardized assessment practices are helping to determine adaptations to improve outcomes in content
areas in history, social studies and science.
• Continue to integrate fine arts across the curriculum; maximize effectiveness and delivery of in-school music
program; increase drama productions and opportunities for visiting artists to enhance program.
• Long Range Plans progress will continue to be reviewed regularly through staff professional learning community
time.
• Development of assessment practices for the cursive writing program to assess capacity for note-taking, reflective
thought, and summarization skills.
Outcome 1:3: Students will express themselves in an articulate manner when public speaking.
Results (in percentages) Target Targets
Performance Measures
2014 2015 2016 2017 2018 2018 2019 2020 2021
Percent of parents satisfied that students express
themselves in an articulate manner when public 84.0 92.0 94.0 100.0 100.0 95.0 97.0 100.0 100.0
speaking.
Percent of students who meet an acceptable
standard of achievement (at or above 60%) in a 76.0 86.0 87.0 83.0 80.0 90.0 90.0 91.0 92.0
public speaking event, reported by grade level.
Percent of students who meet a standard of
excellence in public speaking (at or above 80%) 43.0 37.0 47.0 40.0 33.0 50.0 50.0 50.0 50.0
(New Measure)
Comments on Results
Clearer rubrics for these performance measures, with more objective standards, are helping to improve both clarity of
outcomes and student results for this important aspect of the Valhalla Community School program.
Strategies
• Teachers provide incremental opportunities for students to speak in public, in front of classmates as well as the
school.
• Skills in public speaking are taught intentionally and directly.
• Students will have opportunity to present projects and ideas to other classes in the school.
• Increased opportunities to hear public speakers will be offered to students.
• Students memorize and recite poetry in early elementary grades.
Page 14Authority: 0224 Valhalla School Foundation
Outcome 1:4: Students will develop proficiency in French as a second language
Results (in percentages) Target Targets
Performance Measures
2014 2015 2016 2017 2018 2018 2019 2020 2021
Percent of parents satisfied that students are developing
82.0 87.0 97.0 88.0 87.1 95.0 90.0 91.0 92.0
proficiency in a second language.
Percent of teachers satisfied that students are developing New
100.0 100.0 Measure
proficiency in a second language
Strategies
• Optimize scheduling and environmental factors to maximize student learning and engagement.
• Look into video-conferencing with an English language learning class in Quebec.
• French language instruction effectively combining whole group instruction while grouping students according
to their level of second language development.
• Online use of the “Duolingo” resource for language studies
•
Page 15Authority: 0224 Valhalla School Foundation
CHARTER GOAL TWO: To prepare students for community involvement and leadership.
Outcome 2:1: Students will participate in activities that teach and recognize the importance of community
involvement by directly experiencing the efforts of community and municipal groups, and participating in
relevant discussions at an age appropriate level.
Results (in percentages) Target Targets
Performance Measures
2014 2015 2016 2017 2018 2018 2019 2020 2021
Percentage of students who have participated in two or more community
82.0 45.0 86.0 77.0 86.1 92.0 93.0 94.0 95.0
or student groups or meetings during the course of the school year.
Percentage of students in grades 3 and above who have participated in
relevant discussions at an age appropriate level and meet the standard in 89.0 79.0 85.0 91.0 91.0 92.0 93.0 94.0 95.0
communicating an understanding of the roles and functions of community and
student groups.
Percentage of parents who are satisfied that students are able to identify
the efforts of community and municipal groups in the school and the 90.0 97.0 85.0 84.0 100.0 91.0 92.0 94.0 96.0
community, and recognize the importance of community involvement.
Percent of parents of students in grades 3 and above who report that their
son/daughter has participated in relevant discussions and in community 85.0 100.0 100.0 100.0 100.0 100.0 100.0
and student groups or meetings during the school year.
Percent of junior high students satisfied with their opportunity to participate in
100 91.0 55.0 100.0 67.0 83.0 100.0 100.0
student council.
Percent of junior high students who have improved their skills and attitudes
55.0 87.5 67.0 90.0 91.0 92.0
regarding involvement in community organizations.
Comment on Results
We are continuously working to clarify our pedagogical objectives as well as our assessment of student success in these
objectives, and to match them more closely to stated charter goals.
Strategies
• Curriculum opportunities to link community involvement (attend meetings, participate in discussions, and understand
civic organization and structures) with academic studies are optimized.
• Visits and presentations by community leaders including board members will be enhanced.
• Focus on service learning through enhancement of the community at the school itself (buddy systems, helping
younger students with activities, support for custodial services).
• Continuation of Student Council development including representation from all grade levels, determined through
public speaking presentations, with decision-making strategies and discussion in all classes.
• Student Council is open to all junior high students through a rotating elective option.
• All students are encouraged, by grade level, to attend at least one School Council meeting with their parents.
• A “House League” structure sees older and younger students work together in various competitive and positive
community building activities will continue.
• TED talks will be researched as a means of exposing students to public speaking and social issues.
•
Page 16Authority: 0224 Valhalla School Foundation
Outcome 2.2: Enhanced parental involvement in the school community.
Results (in percentages) Target Targets
Performance Measures
2014 2015 2016 2017 2018 2018 2019 2020 2021
Number of means of communication developed between the school, School
NM 16 18 18 20 20 20 20 20
Council and parents
Percent of parents participating in one or more school events 75.0 76.0 76.0 68.0 72.4 75.0 80.0 81.0 82.0
Percent of parents attending at least one School Council meeting NM 83.0 59.0 46.7 60.0 65.0 66.0 67.0
Percent of parents reporting that the efforts of teachers to communicate about
curriculum developments and progress has helped them to be more engaged in NM 95.0 93.5 96.0 97.0 98.0
their child’s education.
Strategies
• Continuing to work together with School Council to find ways to build community and improve communication between
the school, School Council and parents.
• Initiative to have all students grades 3 and above attend one School Council meeting with their parents.
• Monthly communication to parents about curriculum developments and strategies to engage their children in related
discussions.
• A new strategy to involve parents with homework questions requiring dialogue with parents.
•
Comment on Results
Valhalla Community School continues to have high levels of satisfaction from students, parents and the community. Accountability
Pillar results, local satisfaction surveys and a survey supporting our five-year charter renewal application all underscore the high level
of satisfaction from all parties. There is little doubt that Valhalla is serving a need as a school of choice in northwestern Alberta. A key
to this success as well as the success of our students has been an increased emphasis on helping parents understand the goals
and expectations of the school and as a result, families are increasingly making a positive choice about Valhalla for their children. An
emphasis on communicating the goals of the charter to the community has resulted in higher enrollment in kindergarten and early
elementary as well as pre-school; this, however, is diminished by the transitory nature of the area and families leaving the area due
to economic instability.
Teachers at Valhalla have been building skills in meeting the needs of all students, as well as developing their skills in direct
instruction, strong classroom management, and mastery of the various direct instruction resource and the program. The school has
moved its second language program forward to focus on French, in response to teacher circumstances and a survey of parents.
Programming adjustments are responding to the needs of students with particular challenges, particularly in the junior high. Finally,
parent partnerships are being developed strategically to build community and to ensure parent commitment to the program as well
as their support for student learning.
As a result of these initiatives, we have seen an improvement in our Provincial Achievement Testing score in the previous two years,
although both cohorts were small and a few students with serious challenges had an unusually large negative impact on our results..
Finally, we were delighted to receive a five-year renewal from the Minister and look forward to many more years of success at
Valhalla Community School.
* Target set for 2016/17 in the three year education plan 2016/17 – 2018/19.
Page 17Authority: 0224 Valhalla School Foundation
Outcome One: Alberta’s students are successful
Results (in percentages) Target Evaluation Targets
Performance Measure
2014 2015 2016 2017 2018 2018 Achievement Improvement Overall 2019 2020 2021
Overall percentage of students in
Grades 6 and 9 who achieved the
acceptable standard on Provincial 57.1 67.0 86.8 85.4 67.1 87.0 Low Maintained Issue 85.0 86.0 87.0
Achievement Tests (overall cohort
results).
Overall percentage of students in
Grades 6 and 9 who achieved the
standard of excellence on 1.2 6.3 19.1 25.0 2.6 16.0 Very Low Declined Concern 15.0 16.0 17.0
Provincial Achievement Tests
(overall cohort results).
Comment on Results
We were pleased with our results in the preceding two years, but as is common in very small schools, a few
students with particular challenges in each of our grade six and grade nine cohorts had a strong impact on our
recent (2018) results.
✓
Strategies
• Staff have been responsible for the development of a clear Direct Instruction Teaching and Learning
Framework and are working on improved implementation as a function of their professional growth plans.
• Local standardized assessment tools have been identified and baseline assessment measures have been
taken throughout the course of the past school year.
• Teachers continue to analyze and compare their programs and resources to the Program of Studies, PAT
results, and the expectations of the Charter.
• Implementation of the Writing Road to Reading continues, with adjustments to the literacy program to best
utilize time and to ensure an appropriate scope and sequence of learning.
• Teacher professional development has been enhanced through regular meetings, Peer Coaching, and
student feedback.
• Increased cross-curricular emphasis on writing skills and opportunities and the implementation of an
intentional cursive writing program.
• All junior high students have Enhanced Learning Opportunity programming scheduled to develop their
organizational and learning skills.
• Junior high students with strong organizational challenges and difficulty in mastering basic skills are
involved in a focused Study Skills program.
• Supporting the building of staff capacity to meet needs and contribute to improved success for all students,
through identification of individual student challenges, strengths, and effective strategies for each.
• Teacher professional development includes: implementation of a consistent approach to class
management; direct instruction strategies; strategic questioning; the enhancement of student motivation
and engagement; formal student written survey feedback; and a Peer Coaching program.
• Enrich the curriculum content delivered to our students as per charter expectations.
• Streamline student portfolio system to ensure appropriate feedback to students and information to parents
Notes:
1. Data values have been suppressed where the number of respondents/students is fewer than 6. Suppression is marked with an asterisk (*).
2. Overall evaluations can only be calculated if both improvement and achievement evaluations are available.
3. Aggregated PAT results are based upon a weighted average of percent meeting standards (Acceptable, Excellence). The weights are the
number of students enrolled in each course. Courses included: English Language Arts (Grades 6, 9, 9 KAE); Français (Grades 6, 9); French
Language Arts (Grades 6, 9); Mathematics (6, 9, 9 KAE); Science (Grades 6, 9, 9 KAE); and Social Studies (Grades 6, 9, 9 KAE).
4. Participation in Provincial Achievement Tests was impacted by the flooding in June 2013 (Grade 9 only) and by the fires in May to June 2016.
Caution should be used when interpreting trends over time for the province and those school authorities affected by these events.
Page 18Authority: 0224 Valhalla School Foundation
Outcome One: Alberta’s students are successful (continued)
[No Data for Diploma Exam Results
Results (in percentages) Target Evaluation Targets
Performance Measure
2013 2014 2015 2016 2017 2018 Achievement Improvement Overall 2019 2020 2021
High School Completion Rate -
Percentage of students who
n/a n/a n/a n/a n/a n/a n/a n/a
completed high school within
three years of entering Grade 10.
Drop Out Rate - annual dropout
7.7 0.0 5.3 6.1 10.2 Very Low Maintained Concern
rate of students aged 14 to 18
High school to post-secondary
transition rate of students within n/a n/a n/a n/a n/a n/a n/a n/a
six years of entering Grade 10.
Percentage of Grade 12 students
eligible for a Rutherford n/a n/a n/a n/a n/a n/a n/a n/a
Scholarship.
Percentage of students writing
four or more diploma exams
n/a n/a n/a n/a n/a n/a n/a n/a
within three years of entering
Grade 10.
Strategies
• VCS personnel are contacting teachers and administrators in the local high school to determine what
capacities and skills our graduates are demonstrating and what needs improvement in terms of our
program.
• Facilitating return of former students (now in high school) to speak to staff and students about preparing for
high school.
Notes:
1. Data values have been suppressed where the number of respondents/students is fewer than 6. Suppression is marked with an asterisk (*).
2. Overall evaluations can only be calculated if both improvement and achievement evaluations are available.
3. Diploma Examination Participation, High School Completion and High school to Post-secondary Transition rates are based upon a cohort of
grade 10 students who are tracked over time.
4. Aggregated Diploma results are a weighted average of percent meeting standards (Acceptable, Excellence) on Diploma Examinations. The
weights are the number of students writing the Diploma Examination for each course. Courses included: English Language Arts 30-1; English
Language Arts 30-2; French Language Arts 30-1; Français 30-1; Mathematics 30-1; Mathematics 30-2; Chemistry 30; Physics 30; Biology 30;
Science 30; Social Studies 30-1; and Social Studies 30-2.
5. Caution should be used when interpreting evaluations and results over time for Mathematics 30-1/30-2, as equating was not in place until the
2016/17 school year. Alberta Education does not comment on province wide trends until it has five years of equated examination data.
6. Participation in Diploma Examinations was impacted by the flooding in June 2013 and by the fires in May to June 2016. Caution should be used
when interpreting trends over time for the province and those school authorities affected by these events.
7. Weighting of school-awarded marks in diploma courses increased from 50% to 70% in the 2015/2016 school year. Caution should be used when
interpreting trends over time.
8. Due to the change from previous data source systems to Provincial Approach to Student Information (PASI), Rutherford Scholarship Eligibility
Rate results prior to 2015 are not available.
Page 19Authority: 0224 Valhalla School Foundation
Outcome One: Alberta’s students are successful (continued)
Results (in percentages) Target Evaluation Targets
Performance Measure
2014 2015 2016 2017 2018 2018 Achievement Improvement Overall 2019 2020 2021
Percentage of teachers, parents
and students who are satisfied
that students model the 78.5 81.7 88.5 81.5 86.1 90.0 Very High Maintained Excellent 90.0 91.0 92.0
characteristics of active
citizenship.
Percentage of teachers and
parents who agree that students
are taught attitudes and
91.7 78.6 97.5 95.8 91.7 96.0 Very High Maintained Excellent 95.0 96.0 97.0
behaviours that will make them
successful at work when they
finish school.
Comment on Results
Valhalla Community School continues to be a safe and caring environment for students, where there is high stakeholder
satisfaction with attitudes and behaviors connected to citizenship and preparation for life as an adult. We note a smaller
level of satisfaction with regard to students respecting each other and following rules, and are implementing strategies to
meet these challenges.
Strategies
• Certain identifiable challenges last year have moved the staff team to be more clear in their expectations
and more prompt to address behavior, meet with parents and students, and impose consequences where
necessary. The school staff are seeing very positive results to these strategies early in the school year.
• Continue the development of an integrated and local rural leadership development program, with more
exposure to meetings and community leaders as well as relevant discussions connected to the Social
Studies program. Service to the community, attending School Council and Board meetings, and School
Council activities all contribute to this.
• Continue to have Family/Community closeness modeled to the students every day by staff.
Notes:
1. Data values have been suppressed where the number of respondents/students is fewer than 6. Suppression is marked with an asterisk (*).
2. Survey results for the province and school authorities were impacted by the changes in the number of students responding to the survey through
the introduction of the OurSCHOOL/TTFM (Tell Them From Me) survey in 2014.
Page 20Authority: 0224 Valhalla School Foundation
Outcome One: Alberta’s students are successful (continued)
Results (in percentages) Target Evaluation Targets
Performance Measure
2014 2015 2016 2017 2018 2018 Achievement Improvement Overall 2019 2020 2021
Percentage of teacher and parent
satisfaction that students
demonstrate the knowledge, skills 80.0 80.0 81.0 82.0
and attitudes necessary for lifelong 61.1 70.6 73.8 83.3 74.4 n/a n/a n/a
learning.(This measure is required
for charter and private school
authorities with only K-9 schools)
Comment on Results
Increasingly, we recognize that attitudes of life-long learning are highly influenced by the home environment, and as a result, we are working
on ways and means of increasing the involvement of parents in the education of their children. In addition, a variety of strategies are
developed to enhance understanding that they are members of a community in which healthy involvement includes both independence and
interdependence.
Strategies
• VCS applies technology integration using Google Chrome laptops providing for the development of
technological capacity that is both effective and efficient.
• Enhancing courses by continuing to refine our understanding of appropriate use of technology.
• Developing opportunities for students to become leaders through service learning.
• All students are exposed to educational experiences which explore the efforts of community and municipal
groups, including assessment of understanding and transfer to curriculum areas.
• Curriculum opportunities to link community involvement with academic studies will be optimized.
• Opportunities to attend meetings, participate in discussions, and understand civic organization and
structures will be developed and optimized.
• Student Council are open to all junior high students through a rotating elective option.
• Initiative for all classes grades 3 and above to attend at least one School Council meeting with their parents.
• Continuous curriculum updates with the intention of increasingly engaging parents in the education of their
children.
Notes:
1. Data values have been suppressed where the number of respondents/students is fewer than 6. Suppression is marked with an asterisk (*).
2. Survey results for the province and school authorities were impacted by the changes in the number of students responding to the survey through
the introduction of the OurSCHOOL/TTFM (Tell Them From Me) survey in 2014.
Page 21You can also read