Finance & Property Committee - District School Board Ontario ...
←
→
Page content transcription
If your browser does not render page correctly, please read the page content below
Finance & Property Committee
                         Tuesday, April 20, 2021 @ 3:45 p.m.
                                  Microsoft Teams

                                    AGENDA
1) Call to Order

2) Approval of the Agenda

3) 2021 Capital Priorities Update

4) Trustee Determination and Distribution

5) OSBIE Help Report 2020

6) Honeywell Guarantee Report – Year 8

7) Other Business
Trustee Determination
and Distribution Guide
for Ontario District School Boards
                             2018
This document is intended as a guide only. Users should rely on their
             legal counsel for advice on all questions relating to the subject matter
             of this document.

The Ontario Public Service endeavours to demonstrate leadership with respect to accessibility in Ontario. Our goal is to
ensure that Ontario government services, products, and facilities are accessible to all our employees and to all members
of the public we serve. This document, or the information that it contains, is available, on request, in alternative formats.
Please forward all requests for alternative formats to ServiceOntario at 1-800-668-9938 (TTY: 1-800-268-7095).
Contents
   Introduction 		2
   Section I
   Trustee Determination and Distribution: A Responsibility of District
   School Boards		 3
   What Do You Need to Get Started? 		 4
   Completing the Determination and Distribution Calculations 		 6
   Trustee Determination – Using the Online Calculator 		 8
   Trustee Distribution – Using the Online Calculator 		 8
   Trustee Determination – Manual Calculation Using Templates 		 10
   Trustee Distribution – Manual Calculation Using Templates 		 13
   Need Help with D&D Calculations? 		 20

   Section II
   Key Dates for 2018 Elections 		 21

   Section III
   Questions and Answers 		 22

   Appendix A
   Tables from Ontario Regulation 412/00 		 25

   Appendix B
   Dispersal Rules from Ontario Regulation 412/00 		 30

   Appendix C
   Trustee Positions Determined for the 2006 General Election,
   and Additional Positions Ordered by the Minister in 2010 		 31

   Une publication équivalente est disponible en français sous le titre suivant : Guide de détermination
   du nombre et de la répartition des membres élus à l’intention des conseils scolaires de l’Ontario, 2018.
   This publication is available on the Ministry of Education’s website, at www.ontario.ca/edu.
Introduction
                 Before each general election, every board of trustees determines the number
                 of trustee positions on their board1 and distributes these positions across the
                 board’s area of jurisdiction. This process is known as trustee determination
                 and distribution (D&D). By March 31 of an election year, school boards are
                 required to complete a D&D Report showing their D&D calculations, and,
                 by April 3 in the election year, to submit it to:
                 • the Ministry of Education;
                 • the election clerks for all municipalities within the board’s jurisdiction;
                 • the secretary of every other board that is wholly or partially within the
                   board’s area of jurisdiction.

                 The D&D process plays an important role in ensuring that representation on
                 school boards is democratic and fair. It also allows trustee candidates to identify
                 and select an electoral ward in which to run. Therefore, it is very important
                 for school boards to make accurate D&D calculations.

                 This guide offers two options to help you complete the D&D calculations:
                 • an online D&D calculator, which you can find on the Web page of the
                   Ontario Education Services Corporation (OESC) at
                   http://trusteecalc.oesc-cseo.org/trustee-elections/calculator/
                 • a manual approach using the steps and templates provided in this guide

                 The guide has three sections:
                 • Section I provides information and steps for completing the D&D Report.
                 • Section II sets out key dates for the 2018 election.
                 • Section III contains frequently asked questions about the D&D process
                   and answers to them.

1. The terms school board and board are used in this document to refer to district school boards.

2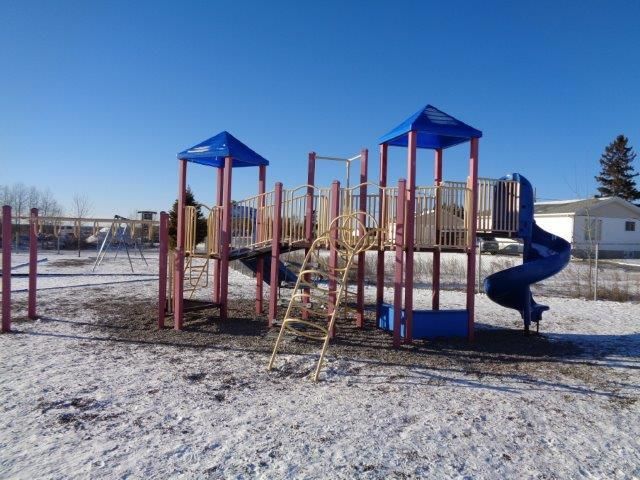
Section I
Trustee Determination and Distribution:
A Responsibility of District School Boards
       The number of elected school trustees and their distribution over a board’s
       jurisdiction are governed by the Education Act and by Ontario Regulation
       (O. Reg.) 412/00, “Elections to and Representation on District School Boards”.

       Trustee Determination
       The number of elected trustee positions on a board is the number that was
       determined for the board for the purposes of the 2006 general election, with
       the following provisos (section 58.1 (10.0.1) of the Education Act):
       • For a school board whose number of elected trustees was increased by
         order of the Minister following the isolate board mergers in 2009, the total
         number of elected trustees includes the additional position(s) ordered by
         the Minister.
       • A board may by resolution reduce its number of elected trustees to not
         fewer than five.
       • A board that has experienced a change in population or area of jurisdiction
         may use the formula in O. Reg. 412/00 to recalculate its number of elected
         trustees.

       Trustee Distribution
       Boards are responsible for allocating their elected trustee positions over their
       area of jurisdiction. They do this by:
       • combining local municipalities and local municipal wards in their area of
         jurisdiction into a number of geographic areas;
       • allocating their trustee positions to these areas. The steps are set out in
         O. Reg. 412/00, and the process is referred to as trustee distribution.

                                                                                       3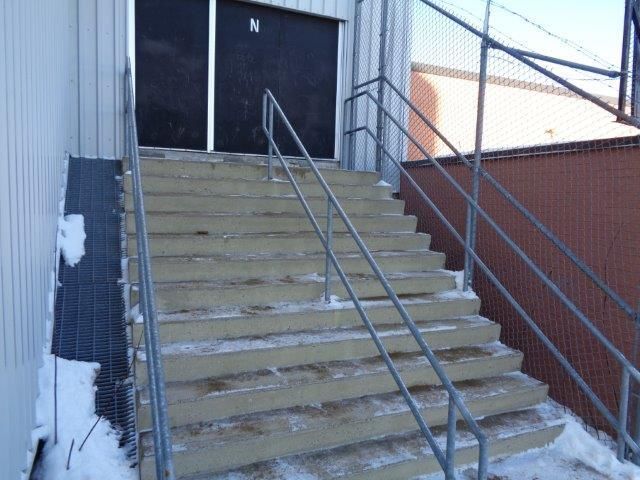
If a board has formed a geographic area that includes two or more municipal-
      ities, then the board must identify the municipality with the largest population
      of the board’s electoral group. This is known as the lead municipality. The
      school board election clerk of the lead municipality has certain responsibilities
      for the entire geographic area, such as accepting nominations and announcing
      the result of the vote.

      Determination and Distribution Report
      School boards are required to submit a Determination and Distribution
      Report (D&D Report) to the Minister of Education, the election clerks for
      all municipalities within the board’s jurisdiction, and the secretary of every
      other board that is wholly or partially within the board’s area of jurisdiction.

      The D&D Report must include:
      • the D&D results;
      • if applicable, the identification of any lead municipality;
      • a copy of the data and calculations by which
         –– the D&D results were reached
         –– any lead municipality was identified;
      • copies of all relevant board resolutions.

      The submission deadline for the D&D Report is April 3, 2018.

What Do You Need to Get Started?
      1. Population of Electoral Group Report
      The first piece of information you will need to complete your D&D Report
      is the population of the electoral group for each of the local municipalities
      and local municipal wards within your school board’s area of jurisdiction.
      The Municipal Property Assessment Corporation (MPAC) produces this
      data and will provide a Population of Electoral Group Report (PEG Report)
      to your board before February 15, 2018.

      In some cases, an area without municipal organization is attached to a
      municipality for school board election purposes. Other areas without
      municipal organization are deemed to be municipalities under the
      Education Act. The PEG Reports contain the electoral group data
      for these areas as well.

4                                        Trustee Determination and Distribution Guide, 2018
2. Board Resolution Regarding Low Population
                Municipalities
            You will need to know whether or not your board is designating any munic-
            ipalities within its jurisdiction as “low population” areas. Boards whose area
            of jurisdiction includes more than one municipality must pass a resolution by
            March 31 of an election year either:
            • designating one or more municipalities as low population municipalities; or
            • declaring that no such designation will be made (O. Reg. 412/00, s. 4).

            This resolution must be included in your D&D Report.

            Typically, a board will designate one or more municipalities as a low population
            area to allow for greater representation to an area than would be accorded
            by a strict representation-by-population approach. There is no limit on the
            number of low population areas a board may designate.

            Designating municipalities as low population areas affects the calculation of
            trustee distribution by allowing the board to increase the sum of electoral
            quotients for those municipalities by either one or two. It does not affect the
            total number of trustees for the board.

            3. Board Resolution Regarding Voluntary Reduction
                of Board Members
            School boards may reduce the number of elected trustees below the number
            provided for in the Education Act and O. Reg. 412/00, but not below the
            minimum number of five members. This can be done only by a resolution
            of the board.

            If a school board chooses to exercise this option, the resolution must be
            passed before March 31 of an election year. A copy of the resolution must
            be included in the D&D Report.

Section I                                                                                    5
Completing the Determination and
Distribution Calculations
      Summary of Steps: Completing Your D&D Report
      1. Gather the following information:
         • the number of trustee positions determined by your board in 2006 and,
           if applicable, the number of additional trustees ordered by the Minister
           in 2010 (see Appendix C);
         • your board’s 2018 PEG Report;
         • if applicable, the name(s) of any municipalities within your board’s
           jurisdiction that have been designated as low population municipalities,
           and whether the sum of electoral quotients for those municipalities is
           to be increased by one or two;
         • a copy of the provisions regarding distribution set out in sections 4 to 8
           of O. Reg. 412/00, available online at
           http://www.e-laws.gov.on.ca/html/regs/english/elaws_regs_000412_e.htm.

         If you wish to calculate whether your board may have additional trustees,
         you may use the online calculator on the OESC’s Web page. If you are
         doing a manual calculation, you will need:
         • a copy of the six tables contained in O. Reg. 412/00, which are
           reproduced in Appendix A;
         • a copy of the rules set out in O. Reg. 412/00, which are reproduced in
           Appendix B, for determining the number of additional members based
           on your board’s dispersal factor.

      2. Determine your board’s number of trustee positions:
         • For most boards, this will be the number determined for the purposes
           of the 2006 election, unless:
           –– the Minister ordered additional trustees for your board in 2010
               following the isolate board mergers; or
           –– your board has passed a resolution to reduce its number of elected
               trustees to not fewer than five; or
           –– your board has experienced a change in population or area of
               jurisdiction and would like to use the formula in O. Reg.412/00 to
               recalculate its number of elected trustees.

6                                      Trustee Determination and Distribution Guide, 2018
3. Allocate the trustee positions to the geographic areas formed by your
               board. This step requires the calculation of the electoral quotient for each
               municipality or municipal ward using the PEG data provided by MPAC. The
               online calculator will do this for you. If you wish to do a manual calculation,
               you will find the steps and templates you may use for this purpose on
               pages 13 to 18. In either case, you will need to know:
               • the number of elected trustee positions;
               • the number of municipalities/municipal wards and unorganized territories
                 in your board’s jurisdiction;
               • the number, if any, of designated low population municipalities;
               • the number (one or two) by which the sum of their electoral quotients
                 would be increased.

            4. Make copies of the D&D calculations. If you used the Web-based calculator,
               it provides an option for printing your calculations. If you used a manual
               method, copy your completed D&D templates or any other chart you
               may have used for your calculations.

            5. Seek approval from your board on the number of trustees to be elected
               and their geographic distribution. Note that all resolutions must be passed
               by March 31, 2018.

            6. Prepare your D&D Report and send it, by April 3, 2018, to the Minister,
               the school board election clerks for all the municipalities within the
               area of jurisdiction of the board and the secretary of every other board
               that is wholly or partially within the area of jurisdiction of your board.
               The completed D&D Report must include:
               • the D&D results;
               • if applicable, the identification of any lead municipality;
               • a copy of the data and calculations by which the D&D results were
                 reached and by which any lead municipality was identified;
               • copies of all relevant board resolutions.

Section I                                                                                   7
Trustee Determination – Using the Online
Calculator
The online calculator can be found on the website of the OESC at
http://trusteecalc.oesc-cseo.org/trustee-elections/calculator/.
You will be provided with two options for proceeding:
Option 1: If you are not recalculating your board’s elected trustee positions,
then you will be taken to a Web page where you will select your board name
and enter the total population of your board’s electoral group that will be
used in the trustee distribution calculation.
Once you select your board, a number will be generated, which is the total
number of elected trustees for your board. If your board has recently passed
a resolution to reduce the number of trustees, you can choose the board’s
new number of trustees from a drop-down menu.
Option 2: If your board wishes to recalculate its number of elected trustee
positions, then you will be taken to a Web page that you can use to determine
whether a change in your board’s population or area of jurisdiction would
allow your board to have more trustees. You will be asked to identify your
board name and enter the population of your board’s electoral group. When
you click on the Next button, the calculator will determine the allowable
number of trustees for your board. If the resulting number is greater than the
number for 2006 (including trustees ordered by the Minister, if applicable),
the greater number is your board’s maximum allowable number of trustees.
You will then be guided to the trustee distribution calculator.
Trustee Distribution – Using the Online
Calculator
Enter the names of all local municipalities and local municipal wards in your
jurisdiction, and their corresponding electoral group population. The calculator
will then calculate the electoral quotients. If you indicated that your board has
designated one or more low population municipalities, it will also calculate the
alternative electoral quotients.
8 Trustee Determination and Distribution Guide, 2018The electoral quotient is a number that represents the number of trustee(s)
a board can have in a particular geographic area.
The alternative electoral quotient is a number that represents an increased
electoral quotient for low population municipalities and a decreased electoral
quotient for other municipalities. As such, it allows for greater representation
to low population municipalities than would be accorded by a strict represen-
tation-by-population calculation.
The calculator template can be printed and included in your D&D Report.
The final step is to allocate the trustee positions to geographic areas in your
school board by following the rules set out in O. Reg. 412/00:
• Section 6 of O. Reg. 412/00 sets out the distribution provisions for boards
that have jurisdiction in only one municipality and for multi-municipality
boards that have not designated any low population municipalities.
• Section 7 of O. Reg. 412/00 sets out the distribution provisions for boards
that have designated one or more low population municipalities.
To allocate trustee positions, combine the municipalities, municipal wards,
and territories without municipal organization to create geographic areas
(i.e., clusters). The number of geographic areas cannot exceed the allowable
number of trustees.
The sum of the electoral quotients in each geographic area should be as close
as possible to a whole number, and the number of trustees allocated to a
geographic area should be, as nearly as practicable, the sum of the electoral
quotients for that area.
For example, if the sum of the electoral quotients for a geographic area is 1.6,
the distribution rules would require the board to look at other possible
combinations of municipalities and municipal wards that would result in a
quotient closer to a whole number. See the example on page 19.
When clustering municipalities, territories without municipal organization, and
municipal wards to create geographic areas, it is also important to think about
the demographics of your board’s jurisdiction. Consideration could be given to
distributing trustee positions in such a way so that the voices of all, including
marginalized communities, are heard at the board table.
Municipalities, municipal wards, and territories without municipal organization
that make up geographic areas do not need to be adjacent to one another.
The board can combine nonadjacent areas throughout the board’s jurisdiction.
Section I 9Any person can make a submission to a board about the establishment
of geographic areas. The board is required to take these submissions
into consideration in arriving at its decision to form a geographic area
(section 58.1 (13) of the Education Act).
You are now ready to prepare your report to present to the board.
Trustee Determination – Manual Calculation
Using Templates
If your board will not be recalculating its number of elected trustee positions,
then your board’s number of elected trustees will be:
• the number determined for the purposes of the 2006 election; or
• the number determined for the purposes of the 2006 election plus any
additional positions ordered by the Minister in 2010 as a result of the
isolate board mergers; or
• a lower number, in accordance with a resolution passed by the board
to reduce the number of elected trustees. The number cannot be lower
than five.
Provide this number in your D&D Report.
Recalculating Your Board’s Number of Trustees
(Optional)
If your board has experienced a change in population or in area of jurisdiction,
you may use the steps and templates that follow to calculate whether the
determination formula in O. Reg. 412/00 would allow additional trustees.
All of the tables from O. Reg. 412/00 that are used in the calculation are
reproduced in Appendix A to this guide.
Step 1:
Find the population of your board’s electoral group from your 2018 PEG
Report. Enter this figure in Box 1 of the Trustee Determination Template
found on page 12 of this guide.
Step 2:
Refer to “Table 1 – Board Areas” in O. Reg. 412/00. Enter your board’s area
as shown in that table in Box 2.
10 Trustee Determination and Distribution Guide, 2018Step 3:
Divide your board’s electoral group population (Box 1) by your board’s area
(Box 2) to determine your board’s density figure. Enter that figure in Box 3.
Step 4:
Refer to “Table 5 – Dispersal Factors” in O. Reg. 412/00. Enter your board’s
dispersal factor in Box 4.
Step 5:
Refer to “Table 2 – Number of Members Based on Electoral Group Population”
in O. Reg. 412/00. Using the population of your board’s electoral group (Box 1),
enter the corresponding number of trustees based on electoral group population
in Box 5.
Step 6:
Refer to “Table 3 – Number of Additional Members Based on Board
Density” in O. Reg. 412/00. Using the board density figure (Box 3), enter
the corresponding number of additional trustees based on board density
in Box 6.
Step 7:
Refer to “Table 4 – Maximum Number of Additional Members Based on
Board Density” in O. Reg. 412/00. Using your board area figure (Box 2), enter
the maximum number of additional trustees based on board density in Box 7.
Step 8:
In Box 8, enter the lesser of the numbers in Box 6 and Box 7.
Step 9:
Refer to the rules set out in O. Reg. 412/00 regarding dispersal (see dispersal
rules in Appendix B). Using your board’s dispersal factor (Box 4), enter the
corresponding number of additional trustees based on dispersal in Box 9.
Step 10:
In Box 10, enter the greater of the numbers in Box 8 and Box 9.
Step 11:
Calculate the total of Box 5 plus Box 10 and enter it in Box 11.
Step 12:
Referring to the final day school average daily enrolment (not counting pupils
enrolled in Junior Kindergarten) from your board’s 2016–17 Financial Statements,
take the corresponding figure from “Table 6 – Minimum Number of Members
Based on Board Enrolment” found in O. Reg. 412/00 and enter it in Box 12.
Section I 11Step 13:
Select the greater of the numbers in Box 11 and Box 12. This is the number
of your elected trustee positions of your board based on the formula in
O. Reg. 412/00.
You have now completed trustee determination and are ready to calculate
trustee distribution.
Trustee Determination Template – Manual Calculation
Data Source Figure
1. Population of electoral group MPAC Box 1:
2. Board area Table 1, O. Reg. 412/00 Box 2:
3. Board density Population/area Box 3:
4. Dispersal factor Table 5, O. Reg. 412/00 Box 4:
5. Number of population-based Table 2, O. Reg. 412/00 Box 5:
trustees
6. Number of density-based Refer to Table 3, Box 6:
trustees O. Reg. 412/00 using board
density figure
7. Number of density-based Refer to Table 4, Box 7:
(area adjusted) trustees O. Reg. 412/00, using board
area figure
8. Lesser of Box 6 and Box 7 Refer to rules set out in Box 8:
O. Reg. 412/00, s.3
9. Number of additional Refer to rules set out in Box 9:
trustees based on dispersal O. Reg. 412/00, s.3, using
dispersal factor
10. Total number of additional Refer to rules set out in Box 10:
trustees (greater of Box 8 O. Reg. 412/00, s.3
and Box 9)
11. Number of population-based Refer to rules set out in Box 11:
trustees plus additional O. Reg. 412/00, s.3
trustees
12. Minimum number of Refer to rules set out in Box 12:
enrolment-based trustees O. Reg. 412/00, s.3
Number of elected trustees = the greater of the numbers in Box 11 and Box 12
12 Trustee Determination and Distribution Guide, 2018Trustee Distribution – Manual Calculation
Using Templates
If you choose to calculate trustee distribution manually, the following templates
and series of steps allow you to calculate your board’s electoral quotients and
alternative electoral quotients.
There are two templates to choose from:
1. If your board has not designated any municipalities within its jurisdiction as
low population municipalities, follow the steps and template outlined below
under Trustee Distribution – Template A (Boards with No Low Population Areas).
2. If your board has designated one or more municipalities within its jurisdiction
as low population municipalities, follow the steps and template outlined
below under Trustee Distribution – Template B (Boards with Low Population
Municipalities).
Template A (Boards with No Low Population
Municipalities)
Step 1:
Enter the total population of the board’s electoral group as Figure A in the
Trustee Distribution – Template A. This number is provided by MPAC and is
identified in Box 1 in the calculations of trustee determination.
Step 2:
Enter the board’s number of elected trustees as Figure B. This is the final figure
of your trustee determination calculation, including any voluntary reduction of
numbers, if applicable.
Step 3:
List all municipalities and/or municipal wards in the area of your board’s
jurisdiction in Column 1, and enter the corresponding electoral group
population in Column 2. The electoral group population figures are
contained in your PEG Reports provided by MPAC.
Step 4:
This step determines the electoral quotient for each municipality/municipal
ward in your board’s jurisdiction. The electoral quotient tells you how many
trustees you can have in each municipal ward or municipality. For this step:
i. multiply the electoral group population figure for each municipality/municipal
ward (Column 2) by the total number of elected trustee positions (Figure B);
Section I 13ii. divide the above number by the total electoral population group of the
school board (Figure A);
iii. record the calculation, the electoral quotient, in Column 3.
(Repeat for each municipality and/or municipal ward.)
Step 5:
This final step allows you to determine the allocation of trustees to geographic
areas in your school board. In most cases, the number of areas listed in
Column 1 will be greater than the number of trustees on your board. In order
to determine the geographic areas a trustee will represent, combine the
municipalities/municipal wards/territories without municipal organization
into geographic areas, ensuring that the number of geographic areas does
not exceed the allowable number of trustees.
The sum of the electoral quotients in each geographic area should be as
close as possible to a whole number. The number of trustees allocated to
a geographic area should be as close as possible to the sum of the electoral
quotients for that area.
Section 6 of O. Reg. 412/00 sets out the distribution provisions for boards that
have jurisdiction in only one municipality and for multi-municipality boards
that have not designated any low population municipalities.
Trustee Distribution – Template A
(Boards with No Low Population Municipalities)
Population of electoral group = ___________ (Figure A)
Total number of elected trustees = ___________ (Figure B)
Column 1 Column 2 Column 3
Name of Municipality/Ward Electoral Group Electoral Quotient
Population
14 Trustee Determination and Distribution Guide, 2018Template B (Boards with Low Population Municipalities)
Step 1:
Enter the total electoral population group of the school board as Figure A in
the Trustee Distribution – Template B. This number is provided by MPAC and is
identified in Box 1 in the calculations of trustee determination.
Step 2:
Enter the number of board trustees as Figure B. This is the final figure of your
trustee determination calculation, including any voluntary reduction of numbers,
if applicable.
Step 3:
Referring to your board resolution, in Chart 1 list all municipalities within
your board’s jurisdiction that have been designated as low population in
Column 1, and their corresponding electoral group population in Column 2.
The electoral group population figures are contained in your PEG Reports
provided by MPAC.
Step 4:
In Chart 2, list all remaining municipalities in your board’s jurisdiction, i.e.,
those that have not been designated as low population municipalities, in
Column 1, and their corresponding electoral group population in Column 2.
Step 5:
This step determines the electoral quotient for each municipality/municipal
ward in your board’s jurisdiction. The electoral quotient is an indicator of the
level of trustee representation warranted in a particular municipality based
on population and geographic size. For both Chart 1 and Chart 2:
i. multiply the electoral group population figure for each municipality/municipal
ward (Column 2) by the number of board members (Figure B);
ii. divide the above number by the total electoral population group of the
school board (Figure A);
iii. record the calculation, the electoral quotient, in Column 3.
(Repeat for each municipality and/or municipal ward in Charts 1 and 2.)
Section I 15Step 6:
This step calculates the alternative quotients for all municipalities within
your board’s jurisdiction (i.e., both low population and remaining ones).
Using Chart 1 (low population municipalities):
i. total the electoral group population for all municipalities designated as
low population (Column 2) and enter that total as Figure C;
ii. total the electoral quotients for all municipalities designated as low
population (Column 3) and enter that total as Figure D;
iii. add to the total of electoral quotients (Figure D) the number determined
by the board’s resolution designating areas as low population municipalities
(the number will be either 1 or 2 – refer to your board resolution);
iv. multiply the number calculated in the previous step by the individual
municipality’s electoral group population (Column 2) and divide that number
by Figure C (the total electoral group population for all municipalities
designated as low population);
v. record the number calculated in Column 4 of Chart 1 – Alternative
Quotient.
Using Chart 2 (remaining municipalities):
i. total the electoral group population for all remaining municipalities
(Column 2) and enter that total as Figure E;
ii. total the electoral quotients in Column 3 and enter that total as Figure F;
iii. subtract from the total of electoral quotients (Figure F) the number
determined by the board’s resolution designating municipalities as
low population (the number will be either 1 or 2 – refer to your board
resolution);
iv. multiply the number calculated in the previous step by the individual
municipality’s electoral group population (Column 2) and divide that number
by Figure E (the total electoral group population for all municipalities not
designated as low population areas);
v. record the number calculated in Column 4 of Chart 2 – Alternative
Quotient.
16 Trustee Determination and Distribution Guide, 2018Step 7:
This final step allows you to allocate the trustee positions to geographic areas
in your school board. To determine the allocation, combine the municipalities/
municipal wards into geographic areas within each grouping, ensuring that the
number of geographic areas does not exceed the allowable number of trustees.
The sum of the electoral quotients in each geographic area should be as
close as possible to a whole number. The number of trustees allocated to
a geographic area should be as close as possible to the sum of the electoral
quotients for that area.
You are now ready to prepare your D&D Report to present to the board.
Section I 17Trustee Distribution – Template B
(Boards with Low Population Municipalities)
Total population of electoral group = ___________ (Figure A)
Total number of elected trustees = ___________ (Figure B)
Chart 1 – Low Population Municipalities
Column 1 Column 2 Column 3 Column 4
Name of Low Electoral Group Electoral Quotient Alternative Quotient
Population Area Population
Total (Figure C) Total (Figure D)
Chart 2 – Remaining Municipalities
Column 1 Column 2 Column 3 Column 4
Name of Area Electoral Group Electoral Quotient Alternative Quotient
Population
Total (Figure E) Total (Figure F)
18 Trustee Determination and Distribution Guide, 2018Example:
Trustee Distribution – Forming Geographic Areas
Number of trustees = 5
Column 1 Column 2 Column 3 Column 4
Name of Municipality/Ward Electoral Quotient Sum of Electoral Geographic Area
Quotient
Municipality 1 (Ward 1) 0.3
Area 1
Municipality 1 (Ward 2) 0.29 0.94 (1 trustee)
Municipality 1 (Ward 3) 0.35
Municipality 2 0.61
Area 2
Municipality 3 (Ward 1) 0.18 1.04 (1 trustee)
Municipality 3 (Ward 2) 0.25
Municipality 3 (Ward 3) 0.25
Municipality 3 (Ward 4) 0.24 Area 3
1 (1 trustee)
Municipality 3 (Ward 5) 0.28
Municipality 4 (Ward 1) 0.23
Municipality 4 (Ward 2) 0.13
Municipality 4 (Ward 3) 0.19
Municipality 5 (Ward 1) 0.14 Area 4
1.05 (1 trustee)
Municipality 5 (Ward 2) 0.09
Municipality 6 0.23
Municipality 7 0.27
Municipality 8 0.97 0.97 Area 5
(1 trustee)
In the above illustration, a school board has eight municipalities in its area
of jurisdiction and five trustee positions. To distribute its trustee positions,
the board formed five geographic areas by combining municipalities and
municipal wards.
The sum of the electoral quotient for each geographic area is close to a whole
number, which represents the number of trustees for that area (Column 3).
Further, the number of geographic areas does not exceed the allowable
number of trustees – five in this case.
Section I 19Need Help with D&D Calculations?
If you need assistance completing your D&D calculations, help is available.
Some municipal clerks may be willing to offer limited assistance to school
boards having difficulty completing D&D calculations.
Your local Ministry of Education Regional Office is also available to assist
you with your D&D calculations. You may also contact the Leadership,
Collaboration and Governance Branch at the Ministry of Education at
LDB-DDL@ontario.ca.
20 Trustee Determination and Distribution Guide, 2018Section II
Key Dates for 2018 Elections
Activity Date
MPAC data (PEG Reports) sent to boards By February 15
1. Boards may pass resolutions determining the number of By March 31
their trustees and must pass resolutions determining their
trustee distribution.
2. Boards whose area of jurisdiction includes more than
one municipality must pass a resolution establishing, or
not establishing, low population areas.
3. Last day for resolution to reduce trustee numbers
D&D Reports sent to the Minister, school board election clerks By April 3
and secretaries of other school boards in the board’s jurisdiction
Deadline for appeals by municipality regarding trustee distribution April 21
Notices of appeal sent by secretary of the board (i.e., the Director By April 25
of Education) to the Ontario Municipal Board (OMB)
Beginning of nomination and campaign period May 1
Deadline for OMB decision regarding appeal of trustee June 10
distribution calculations
Nomination day: last day for July 27, 2:00 p.m.
• filing nomination, and
• withdrawal of candidacy
Compliance audit committee established Before October 1
Voting day October 22
Board of Trustees’ term of office begins December 1
Campaign period ends December 31
Financial filing deadline for candidates March 29, 2019
21Section III
Questions and Answers
Note: For more detailed information about the election process,
visit the website of the Ministry of Municipal Affairs at
http://www.mah.gov.on.ca/Page219.aspx.
Trustee Determination and Distribution (D&D)
Q. What does trustee D&D mean?
A. Before each general election, the board of trustees of each district
school board calculates the number of elected trustee positions on
their school board and distributes these positions across the board’s
area of jurisdiction. This process is known as trustee D&D.
Q. Who is responsible for the D&D process within the jurisdiction of
the board?
A. The outgoing board of trustees is responsible for trustee D&D calculations.
Using population data received from the Municipal Property Assessment
Corporation (MPAC), school boards follow the rules under the Education
Act to establish the number of trustee positions on the school board
and to allocate the positions to geographic areas within the board.
Q. Why do school boards designate low population municipalities?
A. Designation of low population municipalities allows school boards to
provide greater representation to rural or other municipalities than
they would otherwise have under a strict representation-by-population
approach.
22Q. What is dispersal?
A. Many geographically large school boards have schools that are a long
distance from the school board office. A dispersal factor is included
in the formula for calculating a school board’s number of trustees to
ensure adequate representation of the school board community in
these circumstances.
Q. How is the dispersal factor calculated?
A. The dispersal factor expresses the percentage of elementary schools
of the school board located more than 200 kilometres from its central
office. The Ministry of Education calculates the dispersal factor value for
all school boards and sets it in the regulation (Table 5, O. Reg 412/00).
The dispersal factor value for each school board is calculated according
to the following formula:
Number of elementary schools located more than 200 km from school board office x 100
= Dispersal factor
Total number of elementary schools
Q. Why are the Population of Electoral Group (PEG) Reports significant?
A. PEG Reports reflect the population of the board’s electoral group in
each local municipality and local municipal ward within its jurisdiction.
Boards must use the PEG data to calculate the electoral quotients
they use to distribute trustee positions over their territory and, if
applicable, for determining whether an increase in the PEG would
be sufficient to allow additional trustee positions under the formula
in O. Reg. 412/00.
Q. Why do school boards have to wait until February 15 before receiving
the PEG Reports?
A. The PEG Reports reflect the population of electoral groups as of
January 1, 2018. The gap between January 1 and February 15 is to allow
time for the collection of the data and preparation and delivery of reports
to each municipality and district school board in the province.
Section III 23Q. If I have a question about the D&D process, whom can I contact
for help?
A. Some municipal clerks may be willing to offer limited assistance to
school boards having difficulty completing D&D calculations.
Your local Ministry of Education Regional Office is also available to assist
you with your D&D calculations. You may also contact the Leadership,
Collaboration and Governance Branch at the Ministry of Education at
LDB-DDL@ontario.ca.
24 Trustee Determination and Distribution Guide, 2018Appendix A
Tables from Ontario Regulation 412/00
Table 1 – Board Areas
Item Name of Board Area (km2)
1. District School Board Ontario North East 24,922
2. Algoma District School Board 9,623
3. Rainbow District School Board 14,757
4. Near North District School Board 17,020
5. Keewatin-Patricia District School Board 7,245
6. Rainy River District School Board 10,552
7. Lakehead District School Board 5,274
8. Superior-Greenstone District School Board 18,959
9. Bluewater District School Board 8,686
10. Avon Maitland District School Board 5,639
11. Greater Essex County District School Board 1,872
12. Lambton Kent District School Board 5,505
13. Thames Valley District School Board 7,278
14. Toronto District School Board 634
15. Durham District School Board 1,963
16. Kawartha Pine Ridge District School Board 6,998
17. Trillium Lakelands District School Board 12,133
18. York Region District School Board 1,774
19. Simcoe County District School Board 4,901
20. Upper Grand District School Board 4,192
21. Peel District School Board 1,258
22. Halton District School Board 970
23. Hamilton-Wentworth District School Board 1,127
24. District School Board of Niagara 1,883
25. Grand Erie District School Board 4,067
26. Waterloo Region District School Board 1,383
27. Ottawa-Carleton District School Board 2,806
28. Upper Canada District School Board 12,112
29. Limestone District School Board 7,193
30. Renfrew County District School Board 8,740
25Item Name of Board Area (km2)
31. Hastings and Prince Edward District School Board 7,200
32. Northeastern Catholic District School Board 25,464
33. Nipissing-Parry Sound Catholic District School Board 10,597
34. Huron-Superior Catholic District School Board 9,815
35. Sudbury Catholic District School Board 9,317
36. Northwest Catholic District School Board 11,965
37. Kenora Catholic District School Board 3,070
38. Thunder Bay Catholic District School Board 4,936
39. Superior North Catholic District School Board 18,716
40. Bruce-Grey Catholic District School Board 8,686
41. Huron Perth Catholic District School Board 5,639
42. Windsor-Essex Catholic District School Board 1,872
43. London District Catholic School Board 7,278
44. St. Clair Catholic District School Board 5,505
45. Toronto Catholic District School Board 634
46. Peterborough Victoria Northumberland and Clarington Catholic District 10,324
School Board
47. York Catholic District School Board 1,774
48. Dufferin-Peel Catholic District School Board 2,754
49. Simcoe Muskoka Catholic District School Board 10,640
50. Durham Catholic District School Board 1,963
51. Halton Catholic District School Board 970
52. Hamilton-Wentworth Catholic District School Board 1,127
53. Wellington Catholic District School Board 2,696
54. Waterloo Catholic District School Board 1,383
55. Niagara Catholic District School Board 1,883
56. Brant Haldimand Norfolk Catholic District School Board 4,067
57. Catholic District School Board of Eastern Ontario 12,112
58. Ottawa Catholic District School Board 2,806
59. Renfrew County Catholic District School Board 7,851
60. Algonquin and Lakeshore Catholic District School Board 16,101
61. Conseil scolaire de district du Nord-Est de l’Ontario 46,499
62. Conseil scolaire public du Grand Nord de l’Ontario 65,681
63. Conseil scolaire Viamonde 68,014
64. Conseil des écoles publiques de l’Est de l’Ontario 38,041
65. Conseil scolaire de district catholique des Grandes Rivières 25,452
66. Conseil scolaire de district catholique Franco-Nord 10,597
67. Conseil scolaire de district catholique du Nouvel-Ontario 19,226
68. Conseil scolaire de district catholique des Aurores boréales 38,587
69. Conseil scolaire catholique Providence 28,980
70. Conseil scolaire catholique MonAvenir 40,407
71. Conseil scolaire de district catholique de l’Est ontarien 5,326
72. Conseil scolaire de district catholique du Centre-Est de l’Ontario 33,543
26 Trustee Determination and Distribution Guide, 2018Table 2 – Number of Members Based on Electoral
Group Population
Item Total Population of Electoral Group Number of Members
1. Less than 30,000 persons 5
2. 30,000 to 44,999 persons 6
3. 45,000 to 59,999 persons 7
4. 60,000 to 99,999 persons 8
5. 100,000 to 149,999 persons 9
6. 150,000 to 249,999 persons 10
7. 250,000 to 399,999 persons 11
8. 400,000 to 999,999 persons 12
9. 1,000,000 to 1,499,999 persons 17
10. 1,500,000 persons or more 22
Table 3 – Number of Additional Members Based on
Board Density
Number of Additional
Item Density Members
1. Less than 1.00 7
2. 1.00 or more but less than 1.25 6
3. 1.25 or more but less than 1.50 5
4. 1.50 or more but less than 2.00 4
5. 2.00 or more but less than 3.00 3
6. 3.00 or more but less than 4.00 1
7. 4.00 or more 0
Appendix A 27Table 4 – Maximum Number of Additional Members
Based on Board Density
Number of Additional
Item Board Area Members
1. Less than 8,000 square kilometres 0
2. 8,000 square kilometres or more but less 1
than 12,000 square kilometres
3. 12,000 square kilometres or more but 3
less than 25,000 square kilometres
4. 25,000 square kilometres or more but 6
less than 40,000 square kilometres
5. 40,000 square kilometres or more The lesser of 7 and
the difference between
12 and the number of
members based on
electoral group popu-
lation set out in Table 2
for the population of the
board’s electoral group.
28 Trustee Determination and Distribution Guide, 2018Table 5 – Dispersal Factors
Item Name of Board Dispersal Factor
1. District School Board Ontario North East 16.0
2. Algoma District School Board 13.9
3. Rainbow District School Board 2.6
4. Keewatin-Patricia District School Board 47.1
5. Lakehead District School Board 7.7
6. Superior-Greenstone District School Board 50.0
7. Northeastern Catholic District School Board 23.1
8. Huron-Superior Catholic District School Board 40.0
9. Northwest Catholic District School Board 16.7
10 Kenora Catholic District School Board 20.0
11. Superior North Catholic District School Board 33.3
12. Algonquin and Lakeshore Catholic District School Board 2.7
13. Conseil scolaire de district du Nord-Est de l’Ontario 55.6
14. Conseil scolaire public du Grand Nord de l’Ontario 20.0
15. Conseil scolaire Viamonde 10.2
16. Conseil des écoles publiques de l’Est de l’Ontario 5.9
17. Conseil scolaire de district catholique des Grandes Rivières 27.3
18. Conseil scolaire de district catholique du Nouvel-Ontario 20.7
19. Conseil scolaire de district catholique des Aurores boréales 80.0
20. Conseil scolaire catholique Providence 10.7
21. Conseil scolaire de district catholique du Centre-Est de l’Ontario 1.8
22. All other boards 0.0
Table 6 – Minimum Number of Members Based on
Board Enrolment
Minimum Number
Item Day School Average Daily Enrolment of Members
1. 10,000 to 13,999 pupils 6
2. 14,000 to 21,499 pupils 7
3. 21,500 to 29,999 pupils 8
4. 30,000 to 44,999 pupils 9
5. 45,000 to 84,999 pupils 10
6. 85,000 or more pupils 11
Appendix A 29Appendix B
Dispersal Rules from Ontario
Regulation 412/00
Subsection 3 (2), paragraph 4:
Determine the number of additional members based on dispersal in
accordance with the following rules:
i. If the dispersal factor set out for the board in Table 5 is 0, the number
of additional members based on dispersal is 0.
ii. If the dispersal factor set out for the board in Table 5 is greater than 0
and less than 10, the number of additional members based on dispersal
is 1.
iii. If the dispersal factor set out for the board in Table 5 is 10 or more but
less than 25, the number of additional members based on dispersal is 2.
iv. If the dispersal factor set out for the board in Table 5 is 25 or more
but less than 50, the number of additional members based on dispersal
is 3.
v. If the dispersal factor set out for the board in Table 5 is 50 or more,
the number of additional members based on dispersal is 4.
30Appendix C
Trustee Positions Determined for the 2006
General Election, and Additional Positions
Ordered by the Minister in 2010
Additional
Positions
Ordered by
Item Name of Board 2006 Positions the Minister
1. District School Board Ontario North East 10 –
2. Algoma District School Board 10 –
3. Rainbow District School Board 8 –
4. Near North District School Board 8 –
5. Keewatin-Patricia District School Board 9 1
6. Rainy River District School Board 6 –
7. Lakehead District School Board 8 –
8. Superior-Greenstone District School Board 8 –
9. Bluewater District School Board 9 –
10. Avon Maitland District School Board 9 –
11. Greater Essex County District School Board 10 –
12. Lambton Kent District School Board 10 –
13. Thames Valley District School Board 12 –
14. Toronto District School Board 22 –
15. Durham District School Board 11 –
16. Kawartha Pine Ridge District School Board 10 –
17. Trillium Lakelands District School Board 9 –
18. York Region District School Board 12 –
19. Simcoe County District School Board 11 –
20. Upper Grand District School Board 10 –
21. Peel District School Board 12 –
22. Halton District School Board 11 –
23. Hamilton-Wentworth District School Board 11 –
31Additional
Positions
Ordered by
Item Name of Board 2006 Positions the Minister
24. District School Board of Niagara 11 –
25. Grand Erie District School Board 10 –
26. Waterloo Region District School Board 11 –
27. Ottawa-Carleton District School Board 12 –
28. Upper Canada District School Board 10 –
29. Limestone District School Board 9 –
30. Renfrew County District School Board 8 –
31. Hastings and Prince Edward District School Board 9 –
32. Northeastern Catholic District School Board 8 –
33. Nipissing-Parry Sound Catholic District School Board 6 –
34. Huron-Superior Catholic District School Board 9 –
35. Sudbury Catholic District School Board 6 –
36. Northwest Catholic District School Board 7 1
37. Kenora Catholic District School Board 5 1
38. Thunder Bay Catholic District School Board 6 –
39. Superior North Catholic District School Board 8 –
40. Bruce-Grey Catholic District School Board 6 –
41. Huron Perth Catholic District School Board 5 –
42. Windsor-Essex Catholic District School Board 9 –
43. London District Catholic School Board 8 –
44. St. Clair Catholic District School Board 7 –
45. Toronto Catholic District School Board 12 –
46. Peterborough Victoria Northumberland and 7 –
Clarington Catholic District School Board
47. York Catholic District School Board 10 –
48. Dufferin-Peel Catholic District School Board 11 –
49. Simcoe Muskoka Catholic District School Board 8 –
50. Durham Catholic District School Board 8 –
51. Halton Catholic District School Board 9 –
52. Hamilton-Wentworth Catholic District School Board 9 –
53. Wellington Catholic District School Board 6 –
54. Waterloo Catholic District School Board 9 –
55. Niagara Catholic District School Board 8 –
56. Brant Haldimand Norfolk Catholic District 6 –
School Board
57. Catholic District School Board of Eastern Ontario 7 –
58. Ottawa Catholic District School Board 10 –
59. Renfrew County Catholic District School Board 6 –
32 Trustee Determination and Distribution Guide, 2018Additional
Positions
Ordered by
Item Name of Board 2006 Positions the Minister
60. Algonquin and Lakeshore Catholic District 10 –
School Board
61. Conseil scolaire de district du Nord-Est de l’Ontario 12 –
62. Conseil scolaire public du Grand Nord de l’Ontario 12 –
63. Conseil scolaire Viamonde 12 –
64. Conseil des écoles publiques de l’Est de l’Ontario 12 –
65. Conseil scolaire de district catholique des 9 –
Grandes Rivières
66. Conseil scolaire de district catholique Franco-Nord 6 –
67. Conseil scolaire de district catholique du 10 2
Nouvel-Ontario
68. Conseil scolaire de district catholique des 11 1
Aurores boréales
69. Conseil scolaire catholique Providence 11 –
70. Conseil scolaire catholique MonAvenir 12 –
71. Conseil scolaire de district catholique de 8 –
l’Est ontarien
72. Conseil scolaire de district catholique du Centre-Est 11 –
de l’Ontario
Appendix C 33Trustee Determination Template - Manual Calculation
Data Source Figure
1 Population of electoral group MPAC Box 1: 49,440
2 Board Area Table 1, O.Reg 412/00 Box 2: 24,922
3 Board Density Population/Area Box 3: 1.9838
4 Dispersal Factor Table 5, O.Reg 412/00 Box 4: 16
Number of Population-Based
5 Table 2, O.Reg 412/00 Box 5: 7
Trustees
Number of Density-Based Refer to Table 3, O.Reg 412/00, using
6 Box 6: 4
Trustees board density figure
Number of Density-Based Refer to Table 4, O.Reg 412/00, using
7 Box 7: 3
(Area Adjusted) Trustees board area figure
8 Lesser of Box 6 and Box 7 Refer to rules set out in O.Reg 412/00, s3 Box 8: 3
Number of Additional Refer to rules set out in O.Reg 412/00, s3,
9 Box 9: 2
Trustees Based on Dispersal using dispersal factor
Total Number of Additional
10 Trustees (Greater of Box 8 Refer to rules set out in O.Reg 412/00, s3 Box 10: 3
and Box 9)
Number of Population-Based
11 Trustees plus Additional Refer to rules set out in O.Reg 412/00, s3 Box 11: 10
Trustees (Box 5 and Box 10)
Minimum Number of
12 Refer to rules set out in O.Reg 412/00, s3 Box 12: 5
Enrolment-Based Trustees
Number of Elected Trustees (Greater of Box 11 and Box 12) 10Trustee Distribution District School Board Ontario North East
Pro-Forma as at April 2021
English Relative
Public Elector Cumulative Cumulative Distribution Electors
Electoral Board Area Municipality Electors Quotient Total Electors Total Quotient Distribution Index per Trustee
Hammell, Gooderham, Flett, Hartle, Elridge, Kenny, McCallum,
a Timiskaming Locality Education 84 0.002 84 0.02 Gladman, McClaren, Thistle
a Temagami Town 643 0.013 727 0.15
a Coleman Township 360 0.007 1,087 0.22
a Latchford Town 224 0.005 1,311 0.27
a Cobalt Town 630 0.013 1,941 0.39
a Temiskaming Shores City 4,969 0.101 6,910 1.40
Lorrain, Gillies, Firstbrook, Bridgestocke, Kittson, Barr, Lundy,
Henwood, Cane, Barber, Beauchamp, Bryce, Tudhope, Nicol, Milner,
a Timiskaming Locality Education 450 0.009 7,360 1.49 Haultain,Auld, Corkhill, Willet, Roadhouse, Lawson, Muckle, Chown,
a James Township (Elk Lake) 274 0.006 7,634 1.54
a Harris Township 240 0.005 7,874 1.59
a Hudson Township 282 0.006 8,156 1.65
a Kerns Township 254 0.005 8,410 1.70
a Harley Township 284 0.006 8,694 1.76
a Casey Township 100 0.002 8,794 1.78
a Brethour Township 68 0.001 8,862 1.79
a Hilliard Township 125 0.003 8,987 1.82
a Armstrong Township 326 0.007 9,313 1.88
a Thornloe Village 42 0.001 9,355 1.89 2.00 1.89 9,355
Pense, Ingram, Robillard, Truax, Mulligan, Bayly, Marter, Savard,
Sharpe, Catherine, Pacaud, Marquis,Smyth, Farr, Davidson, Willison
b Timiskaming Locality Education 497 0.010 9,852 1.99 Gowganda
b Charlton and Dack Municipality 439 0.009 10,291 2.08
b Evanturel Township 278 0.006 10,569 2.14
b Englehart Town 1,053 0.021 11,622 2.35
b Chamberlain Township 222 0.004 11,844 2.40
b Matachewan Township 212 0.004 12,056 2.44
b McGarry Township 309 0.006 12,365 2.50
b Larder Lake Township 455 0.009 12,820 2.59
b Gauthier Township 85 0.002 12,905 2.61
b Kirkland Lake Locality Education 870 0.018 13,775 2.79 1.00 0.89 4,420
c Kirkland Lake Town 4,771 0.097 18,546 3.75 1.00 0.97 4,771
d Timmins City 19,088 0.386 37,634 7.61
d Foleyet DSA 113 0.002 37,747 7.63
d Gogama DSA 149 0.003 37,896 7.67 3.00 3.91 6,450
e Iroquois Falls Town 1,903 0.038 39,799 8.05
e Black River-Matheson Township 1,541 0.031 41,340 8.36
Cochrane-Iroquois Falls, Black River-
e Matheson Locality Education 93 0.002 41,433 8.38 1.00 0.72 3,537 Monroe, Teefy, Aurora, Newmarket
f Cochrane Town 2,307 0.047 43,740 8.85
Cochrane-Iroquois Falls, Black River- Mortimer, Pyne, St. John, Hanna, Stimson, Fox, Brower, Fournier,
f Matheson Locality Education 392 0.008 44,132 8.93 Ottaway, Kennedy, Clute, Calder, Blount, Leitch,
f Smooth Rock Falls Town 446 0.009 44,578 9.02
f Fauquier-Strickland Township 177 0.004 44,755 9.05
f Moonbeam Township 362 0.007 45,117 9.13
Kapuskasing, Smooth Rock Falls and
f District Locality Education 23 0.000 45,140 9.13 1.00 0.75 3,707 Haggert, Nansen
g Opasatika Township 52 0.001 45,192 9.14
g Kapuskasing Town 2,691 0.054 47,883 9.69
Kapuskasing, Smooth Rock Falls and
g District Locality Education 35 0.001 47,918 9.69 Owens, O'Brien, McCowan
g Val Rita-Harty Township 235 0.005 48,153 9.74
g Hearst Town 1,002 0.020 49,155 9.94
g Hearst Locality Education 176 0.004 49,331 9.98
g Mattice-Val Cote Township 109 0.002 49,440 10.00 1.00 0.87 4,300
Total 49,440 1.000 10.00 10.00 49,440Human Element Loss Prevention Program 2020 District School Board Ontario North East
This Human Element Loss Prevention report is intended to assist you in reducing the possibility of injury and loss to
property insured by OSBIE. It is not intended to imply that all other hazards and conditions are under control at the
time of this review. No liability is assumed by reason of this report (or the inspection on which it is based) as it is only
advisory in nature and the final decisions must be made by you. The liability of OSBIE is limited to that set forth in its
insurance policies and the liability of its reinsurers is limited to that set forth in its reinsurance policies.

Contents
  Purpose ....................................................................................................................... 3
  Summary ...................................................................................................................... 3
  2020 Score Summary........................................................................................................ 4
  Risk Management Credit ................................................................................................... 5
  Summary of Recommendations ........................................................................................... 6
  Hot Work Permit System ................................................................................................... 6
  Fire Safety Inspections ..................................................................................................... 7
  Temporary School Shutdown & Vacant Building Inspections ........................................................ 17
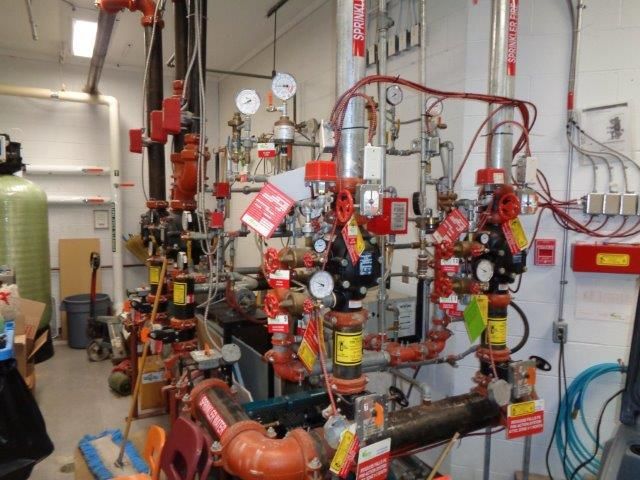
  Automatic Sprinkler System Inspections................................................................................ 18
  Playground Equipment Safety ............................................................................................ 20
  Winter Maintenance ....................................................................................................... 22
  Technological Studies Safety ............................................................................................. 23
  Physical Education Safety................................................................................................. 26
  Outdoor Premise Inspections ............................................................................................. 30
  Science Laboratory Safety Guidelines .................................................................................. 34
  NEW Conditions ............................................................................................................. 36
  Weather Preparedness .................................................................................................... 36
  Cyber Safety ................................................................................................................ 37
     New Condition Score Summary ........................................................................................ 38
     *NEW for Fall 2020 - COVID-19 Safety Protocols.................................................................... 38
     1.   Ventilation Management .......................................................................................... 38
     2.   Cleaning & Disinfection/Sanitizing .............................................................................. 39
     3.   Site Safety .......................................................................................................... 39
     4.   Education............................................................................................................ 39
     5.   Supervision .......................................................................................................... 39
     6.   COVID-19 Case Reporting ......................................................................................... 40
     7.   Policy/Procedure Review ......................................................................................... 40
  Additional Comments and Photos .................................................... Error! Bookmark not defined.
  2020 HELP Score Comparative – Board vs. Membership Average ................................................... 41

                                                                                                                    Page 2 of 42
You can also read


