Fight or flight? How 'stuck' schools are overcoming isolation
←
→
Page content transcription
If your browser does not render page correctly, please read the page content below
Fight or flight? How ‘stuck’ schools are
overcoming isolation
An evaluation project

This evaluation report investigates why some schools that have previously delivered
a low standard of education for long periods of time have managed to sustainably
improve and others have not. It examines the role of school improvement initiatives
and intervention in this process.

The report finds that we need a system of deeper inspection and better support to
improve education for children in these schools.

Published: January 2020
Reference no: 190042
Contents

Executive summary                                               3
Introduction                                                    5
  Context                                                       5
  The definition of ‘stuck’ and ‘unstuck’ schools               5
  Methodology                                                   6
  Limitations of the methodology                                7
What are stuck schools like?                                     8
 Characteristics of stuck schools                                9
 Context of stuck and unstuck schools                           11
   Poor parental motivation                                     12
   Geographical isolation                                       13
   Unstable pupil intake                                        14
 Two types of stuck schools                                     15
   Type A: Chaotic and change fatigued                          15
   Type B: Resistant and embedded culture                       16
The role of school improvement support and inspection           17
  The literature on school improvement                          20
  Timeline of school improvement initiatives                    21
  Views on school improvement initiatives                       23
    Leaders of education                                        23
    School improvement partners                                 25
    Opportunity areas                                           26
  The quality of advice                                         26
  Views on Ofsted inspection                                    27
    Impact of inspection                                        28
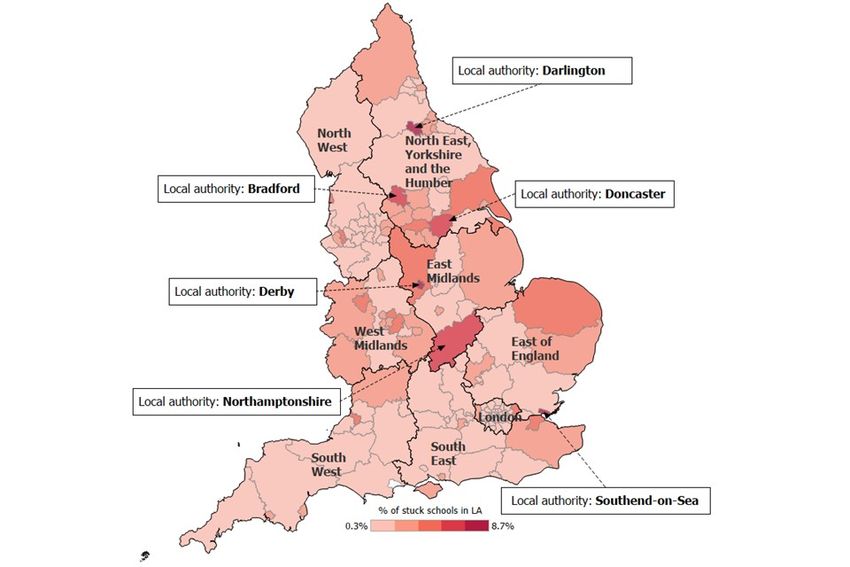
    Support following inspection                                29
    Recognising ‘green shoots’                                  30
    Monitoring visits                                           31
School leadership decisions                                     31
  Upholding high teaching standards                             31
  Getting behaviour right                                       33
  The impact of effective MATs                                  35
  Improving the parlous state of oversight                      36
Conclusions                                                     37
Appendix                                                        38
  Basic characteristics of schools visited                      38

Fight or flight? How ‘stuck’ schools are overcoming isolation
January 2020, No. 190042                                        2
Executive summary
1. Ofsted exists to independently inspect and report on standards in education
and care. Across the country, we see schools that improve, schools that decline
and schools that continue to deliver good standards of education. But hidden
behind this is a set of schools in which children have been failed for too long.
2. In some pockets of the country, two whole cohorts of children have gone
through all their primary or all their secondary school life without ever attending
a good school – that’s 13 years or more. At the end of August 2019, there were
still an estimated 210,000 pupils being educated in stuck schools. Despite the
system of support, intervention and inspection designed to improve schools,
nothing has changed for these children.
3. This is not good enough for any child, but it is particularly concerning for these
children, who are more likely to live in deprived areas than children attending
other schools. Poor education is not an inevitability of poor communities: the
majority of schools in the most deprived areas have shown that they can
provide good or outstanding education despite the challenging contexts in
which they work.
4. However, some of these good or outstanding schools have not always been so.
Some of them have had difficult journeys with many different forms of
intervention and support, and many different leadership strategies, finally
coming together to make an impact. The reasons that they have improved have
been under-investigated and are therefore far from clear cut.
5. This report explores why some consistently weak schools are able to improve
while others are not, so that the whole system can then work together to
transform education for these children. It is not intended to apportion blame or
leave the problem at schools’ doors alone. Indeed, the whole school and
accountability system – of which inspection is a part – has some responsibility
for the lack of progress in these schools. This report is a call to action for every
part of the system, including government, councils, Ofsted, multi-academy
trusts (MATs) and schools themselves, to work together better so that
education can be improved for every pupil.
6. This report draws on research visits to 20 schools, 10 of which have been
graded less than good consistently for 13 years or more and are considered as
‘stuck’. The other 10 were graded good in their last two inspections, but
previously had four full inspections that graded them less than good. These are
considered as ‘unstuck’. Across the country, there are 415 stuck and 65 recently
unstuck schools as of August 2019. Stuck schools represent 2% of all state-
funded schools in England.
7. The evidence collected was self-reported through focus groups and interviews.
We did not attempt to independently verify the views or facts that were given
Fight or flight? How ‘stuck’ schools are overcoming isolation
January 2020, No. 190042 3to us. This means that the evidence reported should be seen as schools’
interpretation of their journey, rather than Ofsted’s view.
8. We found that there are no substantial differences in the reported contexts of
the stuck and unstuck schools we visited. All can be viewed as operating in very
challenging circumstances, in which a mixture of geographical isolation,
unstable pupil populations and poor parental motivation appear to be
compounding the issues for children. The fact that some schools are delivering
good education despite these challenges shows that it can be done. This report
explores how.
9. We also found no systematic differences in the level or type of school
improvement support that stuck and unstuck schools have been given. All have
been involved in some form of government-funded support programme, most
commonly receiving advice from National Leaders of Education. The
programmes have not succeeded in getting these stuck schools to good and
they are not perceived to have been transformative in unstuck schools either.
Ofsted has also inspected these stuck schools on multiple occasions, sometimes
six or seven times for stuck schools generally, without seeing substantial
improvement.
10. Most stuck and unstuck schools stated that they had received too much school
improvement advice from too many different quarters of the school system.
Often, the advice was intended to help schools with their improvement
strategy. However, this rarely had the intended impact. Leaders perceived that
the quality of the advice itself was often lacking. School leaders also
commented on a poor match between the problems of the school and the
advice on offer. While many were concerned about the lack of support available
following inspection, schools often welcomed the fresh thinking and impetus
that independent inspection had given them. Schools did not appear to be
inhibited from discussing some of the challenges of inspection during this
project.
11. Advice and support were perceived to have a greater impact when they were
built into the school or MAT’s strategy and delivered internally. This was not
always possible, due to a lack of capacity within the school or MAT. When it
was possible, the internal support structures that facilitated this were
considered transformational. Most commonly, these support structures included
revising and implementing a consistent behaviour policy and upholding high
standards of teaching. These schools, typically in MATs, also had stronger
systems of accountability and oversight, which were a weakness among the
other schools visited.
12. Overall, the evidence suggests that there is enough capacity in the system to
support and advise these schools. However, too little attention is given to:
Fight or flight? How ‘stuck’ schools are overcoming isolation
January 2020, No. 190042 4◼ the content of the support, including whether it enables focused,
effective action that responds directly to the issues identified through
inspection
◼ whether the support is best provided internally or externally to the
school or MAT
◼ the quality of those coordinating or delivering the support.
13. This report highlights the need for a closer link between this research on stuck
schools, Ofsted’s inspection processes and those providing school improvement
support. This approach could be achieved without Ofsted directly delivering
school improvement support and with it maintaining its statutory role to
independently inspect and report on school quality. We are working with the
Department for Education (DfE) to develop proposals to help improve education
for children in stuck schools.
Introduction
Context
14. Education policy in England has long been concerned with addressing the ‘long
tail of underachievement’. This is commonly characterised as the
underachievement of children from disadvantaged backgrounds. A number of
different policies over the last two decades have sought to address the issue,
often focusing attention on improving standards in large cities.
15. However, some of the worst education is delivered in communities that have
been left out of improvements in economic prosperity. These are not leafy
suburbs where there is a comfortable and thriving local economy, but typically
in pockets of the country with a declining industry or jobs market and a lack of
broader cultural opportunities. Often, these schools are in remote areas or on
the very outskirts of major cities.
16. In some of these areas, a pupil will go through their whole primary or whole
secondary school life never having attended a good school: 13 years or more.
This is failure of the highest order. The whole school system has been letting
down these children for over a decade.
The definition of ‘stuck’ and ‘unstuck’ schools
17. Ofsted has been looking at the challenge of ‘stuck schools’. A stuck school is a
school (including its predecessor if it has converted to become an academy)
that has had consistently weak inspection outcomes throughout the last 13
years. This means that it has:
◼ been judged to be inadequate, satisfactory or to require improvement in
every inspection it has had between 1 September 2006 and 31 August
2019
Fight or flight? How ‘stuck’ schools are overcoming isolation
January 2020, No. 190042 5◼ had at least four full inspections in the period.
18. We first highlighted the issue of stuck schools in our Annual Report in 2018.1
We focused on the number and location of these schools, their performance
data and the characteristics of the pupils. We have included an update to some
of these details later in this chapter.
19. Since then, we have also developed a definition of an ‘unstuck school’. This is a
school that previously had four full inspections in which we graded it less than
good, but it has since had two inspections in which it was good. This gives us a
good comparison group to understand why some schools have remained stuck
and others have sustainably improved.
20. Being ‘stuck’ is not a new type of Ofsted category, but rather a way to analyse
a problem. Therefore, we will not be publishing a list of stuck schools. Of
course, any formerly ‘stuck’ school that we have graded most recently as good
is no longer ‘stuck’. However, until it has had two consecutive good inspection
grades, we do not define it as an ‘unstuck’ school. It is important that the
unstuck schools we are analysing have maintained their good judgements and
are not yo-yo-ing.
21. This report builds on our knowledge base of stuck schools. We were interested
in two main questions:
◼ What is the perceived impact of school improvement initiatives on stuck
schools?
◼ What strategies have unstuck schools used to improve education?
Methodology
22. As much as it was possible, we wanted to create a level playing field to
investigate this subject. It is clear that most stuck schools operate in very
challenging circumstances. However, we know that there are many schools in
similar circumstances that can and do provide a good or outstanding level of
education. Limiting the influence of context on the schools we visited would
allow us to focus on why some schools had improved while others had not.
23. To do this, we matched our list at the time of roughly 490 stuck schools to a list
of unstuck schools, pairing together schools with similar contextual data.2 For
each stuck school, this produced a match with one or more unstuck schools
most similar on contextual data. From this, we made a list of around 10 stuck
schools (five deemed primary and five secondary) from across each of Ofsted’s
1
‘The Annual Report of Her Majesty’s Chief Inspector of Education, Children’s Services and Skills
2017/18’, Ofsted, 2018; www.gov.uk/government/publications/ofsted-annual-report-201718-
education-childrens-services-and-skills.
2
This included the percentage of pupils who are eligible for free school meals, who speak English as
an additional language and who are in a minority ethnic group, the IDACI quintile of the school, the
size and phase of the school, and whether the school was in a rural or urban area.
Fight or flight? How ‘stuck’ schools are overcoming isolation
January 2020, No. 190042 6eight regions, and their pairs. The pairs were often not in the same region but
did have similar contexts.
24. We contacted the 20 schools on our list to invite them to participate in the
research. If they agreed, we arranged a day for inspectors to visit the school
and we contacted the relevant local authority and MATs to invite them to be
interviewed by telephone or during the visit. In total, we visited:
◼ eight primary schools (three stuck and five unstuck)
◼ two junior schools, deemed primary (two stuck)
◼ 10 secondary schools (five stuck and five unstuck).
Of the 10 stuck schools, we had graded nine as requires improvement at their
latest inspection and one as inadequate. All of the 10 unstuck schools were
graded good at their latest inspection. You can find more detail on the sample
in the appendix to this report.
25. Each school in the sample was visited by two Her Majesty’s Inspectors (HMI),
carrying out research rather than an inspection. In total, three HMI were
involved in the project and one HMI went on all of the 20 visits.
26. During the visit, inspectors interviewed or ran focus groups with the following
people:
◼ the headteacher
◼ the senior leadership team
◼ the governors or trustees of the MAT
◼ long-standing classroom teachers.
27. The questions for focus groups and interviews were open ended and intended
to help participants describe the journey of their school. Participants were
prompted to recall past inspections, the different types of improvement support
that they had received and their view of the effect that each of these had on
the direction of the school.
28. We analysed the notes and transcriptions from the visits using qualitative
coding software and then grouped them into the themes of this report.
Limitations of the methodology
29. For an in-depth, qualitative study of this kind, we had a healthy and good-sized
sample of 20 schools. However, the 10 stuck schools that we visited represent
just over 2% of all stuck schools and so cannot be considered representative.
This study was not intended to provide a representative view of all stuck and
unstuck schools, but rather to uncover schools’ perspectives of their journeys.
Fight or flight? How ‘stuck’ schools are overcoming isolation
January 2020, No. 190042 730. The strength of the methodology is that, compared with all schools, the pairs of
schools had similar contexts. This means that we can directly compare the
experiences of each of the schools. However, there are some limitations due to
the qualitative design of the project and the nature of the schools that we
visited.
31. The first limitation is that all the evidence was subjective and self-reported
through focus groups and interviews. We did not attempt to independently
verify the views or facts that were given to us. For example, if a school stated
that they believed their school had improved due to a new behaviour policy, we
did not seek to check this through inspection or other methods. This means
that the evidence reported should be seen as the schools’ interpretation of their
journey, rather than Ofsted’s view.
32. The second limitation is that some (though not all) of the school leaders, staff
and governors we spoke to had been running or working in stuck schools for
some time and their ability to look objectively at the root cause of issues was
therefore reduced. Our data shows that just under half (46%) of stuck schools
do not improve at their next inspection.
33. The final limitation is that most leaders of the stuck schools we spoke to
thought that their school was on the way to getting to good. This meant that
they were likely to present recent changes as positive and past changes as
negative. As described above, we did not independently verify whether the
schools were improving or, in the case of unstuck schools, whether any
particular change had improved the school.
What are stuck schools like?
34. This chapter summarises information we have about stuck schools from the
data and the evidence from the school visits. We found that the contexts of all
the stuck and unstuck schools we visited were remarkably similar. All these
schools are working in challenging areas of the country, where parents and the
wider community are perceived by the schools to be disengaged in education
and where geographical isolation and unstable pupil populations make good
education harder to deliver.
The unstuck schools, however, are able to overcome these challenges.
35. We also identify two types of stuck schools from the data we have:
◼ those that are chaotic and change fatigued
◼ those that have a resistant and embedded culture.
These categories will help those visiting stuck schools again, including Ofsted,
to understand the background and culture of the schools, and therefore the
possible support mechanisms that might help them improve.
Fight or flight? How ‘stuck’ schools are overcoming isolation
January 2020, No. 190042 8Characteristics of stuck schools
36. There are currently 415 schools that fit our working definition of a stuck school.
At the end of August 2019, there were an estimated 210,000 pupils in these
schools.
37. There are stuck schools in all phases of education. However, it is a greater
issue for secondary and junior schools than it is for primary. The figures show
that these phases are over-represented in the list of stuck schools:
◼ 46% (189) are primary schools (compared with 72% nationally)
◼ 9% (37) are junior schools (compared with 5% nationally)
◼ 44% (181) are secondary schools (compared with 15% nationally).
The remainder are pupil referral units, alternative provision or special schools.
38. The majority (86%) of stuck schools are now academies, compared with 37%
nationally. This is a reflection of the current government policy of
academisation to support struggling schools. However, 42% of all stuck schools
are new academies that have not been inspected as a new school, because the
first inspection of new schools usually takes place in the school’s third year.
While any school can request an early inspection, these new schools will not
have had a routine opportunity to receive a judgement of good.
39. In turn, almost all stuck academies (95%) are part of a MAT. However, around
half of these are part of MATs with fewer than 10 academies, which is similar to
the proportion of all academies in MATs of this size. This is notable because it
means that the scale that some larger MATs can bring to support stuck schools
is not being maximised.
40. Stuck schools are disproportionally located in towns and small cities.3 Figure 1
shows that 63% of stuck schools are in towns and small cities, compared to
51% of all schools.
3
The Office for National Statistics (ONS) assigns each area to one of 10 rural–urban classifications. In
our analysis, these 10 classifications are summarised as three groups. ‘Towns and small cities’
combines the ONS categories of: urban city and town in a non-sparse setting, urban city and town in
a sparse setting, rural town and fringe in a non-sparse setting, and rural town and fringe in a sparse
setting. For further details see:
www.ons.gov.uk/methodology/geography/geographicalproducts/ruralurbanclassifications/2011ruralurb
anclassification.
Fight or flight? How ‘stuck’ schools are overcoming isolation
January 2020, No. 190042 9Figure 1: Location of stuck schools compared to all schools
41. Location data does not fully capture the characteristics of the areas and local
economies of stuck schools compared to other schools. More recent research
has attempted to define a new index of ‘left behind’ areas, based on data on
the level of civic assets, connectedness and community engagement.4 Around
9% of stuck schools are located in wards that are identified as ‘left behind’,
compared with 4% of all schools.
42. Around 12% (51) of stuck schools fall within the government’s current
‘opportunity areas’.5 One opportunity area (West Somerset) has no stuck
schools within it. The three local authorities with the highest proportion of stuck
schools are: Derby, Southend-on-Sea and Darlington. The three with the lowest
are: Surrey, Devon and Manchester.
4
‘Left behind? Understanding communities on the edge’, Local Trust and Oxford Consultants for Social
Inclusion, 2019; https://localtrust.org.uk/insights/research/left-behind-understanding-communities-
on-the-edge/.
5
‘Social mobility and opportunity areas’, Department for Education, 2017;
www.gov.uk/government/publications/social-mobility-and-opportunity-areas.
Fight or flight? How ‘stuck’ schools are overcoming isolation
January 2020, No. 190042 10Figure 2: Local authority by proportion of stuck schools
Context of stuck and unstuck schools
43. All the stuck and unstuck schools we visited commented on the challenges that
their pupils and communities face. This was as true for stuck schools as it was
for unstuck schools: there were no obvious differences between the context in
which these two groups of schools were operating. This was not just a function
of how we matched the schools. Each pair of schools differed from every other
pair on the contextual data. Nonetheless, all stuck and unstuck schools stated
that they faced the same broad challenges. This shows that the challenges,
while difficult, are not insurmountable.
44. The contextual issues were around the location and social environment of the
school. A number of schools invoked the phrase ‘dumping ground’ to refer to
why they had the children they had. Although this is clearly a degrading way to
refer to children, it does represent a perception that these schools are expected
to take a disproportionate share of children likely to struggle at school. In
several cases, schools found themselves taking children on managed moves
from other schools in the area because they had dwindling pupil rolls and
therefore spare capacity. In one case, this amounted to 100 children in just one
year (10% of their pupil intake). It was the schools’ view that children from
more affluent families sent their children elsewhere.
45. Although many schools had concerns about funding, it was not possible to
distinguish these from the wider challenges they faced in attracting a stable
pupil population. Two stuck schools reported having private finance initiatives
Fight or flight? How ‘stuck’ schools are overcoming isolation
January 2020, No. 190042 11(PFI) as investment in their buildings. In one case, servicing this loan was
costing 12.5% of the school’s annual budget; in the other, it was £1.3 million
per annum. We did not look at school accounts, so we do not know what the
latter is as a percentage of the school’s budget.
46. There are no substantial differences between the average percentage gain that
stuck and unstuck schools will receive from the government’s new National
Funding Formula (NFF).6 The likely average percentage gain for these groups
separately is between 3 and 4 per cent. This is compared to a likely average
percentage gain of 5 per cent for all other schools. Although the NFF is yet to
be implemented, many consider it to address historic inequalities in school
funding. While not conclusive, the fact that stuck schools are not due to receive
a higher percentage gain suggests that inequalities in per-pupil funding do not
explain these schools’ situations.
47. The contextual challenges that the stuck and unstuck schools visited claimed to
operate in broadly fit into three categories:
◼ poor parental motivation
◼ geographical isolation
◼ unstable pupil populations.
Poor parental motivation
48. All the schools, both stuck and unstuck, reported issues with parents and the
wider community that affected attendance, behaviour and attitudes in school.
Many schools reported low levels of literacy and employment among parents. In
some schools, children are reportedly sent to school hungry and allowed to stay
up late on social media or to access inappropriate material on the internet. One
school said that some children try to get excluded so that they can return home
because they are concerned that their parents are victims of domestic abuse.
Drugs and alcohol abuse within the school community are reported as
commonplace.
49. The issues reported were considered to be intergenerational and deep rooted in
all the schools we visited. Two senior leaders – one from a stuck and one from
an unstuck school – commented:
‘We have generations of the community who haven’t bought into
education and what it can offer.’ (Senior leader, School 7a)
‘There are a lot of cultural gaps that need filling… They were amazed
when they visited [city name] to see the tall buildings.’ (Senior leader,
School 5b)
6
‘National funding formula for schools and high needs’, Ofsted, October 2019;
www.gov.uk/government/publications/national-funding-formula-for-schools-and-high-needs.
Fight or flight? How ‘stuck’ schools are overcoming isolation
January 2020, No. 190042 1250. Another teacher from an unstuck school commented:
‘I think we have an intake that is very low in self-worth. I think that's how
I would describe it. You know, they are very down on themselves.’
(Teacher, School 2b)
51. We did not attempt to verify the level of parental motivation for pupils at the
schools. Therefore, these findings should only be considered as perceptions of
those working in the schools.
Geographical isolation
52. Most schools we visited stated that they were challenged by the geographical
location of their school. This boiled down to the fact that their school was not
located in a desirable place to live in, or commute to, for teachers. There were
multiple aspects to this problem.
53. Some schools lay just outside a greater city region, meaning that they felt they
could not offer as attractive a salary package as schools within the city region.
They saw policies such as the London teacher weighting as exacerbating issues
they already had with teacher recruitment and retention, believing that good
teachers were even less likely to apply for posts in the school.
54. Schools also felt that their communities were not sufficiently economically
vibrant to attract good teachers, particularly due to lower pay. They believed
that the wider cultural, social and economic opportunities available within
bigger towns and cities were draining them of talent.
55. Others commented on the general undesirability of the location and its lack of
transport infrastructure with cities. One senior leader commented:
‘Geographically we are in an awkward area. This is not a fashionable area
and most people travel in. Transport links are not very good. It’s quite a
difficult school to get to.’ (Senior leader, School 8b)
56. Some of the schools we visited benefited from Teach First trainees, but they
found it difficult to retain these staff once they graduated. At least three
schools commented on their struggle to retain Teach First graduates. One staff
member commented:
‘We attract the Teach First trainees. However, once the two years of
training are over, Teach Firsters want to move to trendier areas such as
[city names] and do not want to stay in the area.’ (Headteacher, School
5a)
57. Again, all these issues were similar in both stuck and unstuck schools.
Fight or flight? How ‘stuck’ schools are overcoming isolation
January 2020, No. 190042 13Unstable pupil intake
58. All schools commented on the unusual lack of stability in their pupil numbers
and population. In most cases, schools reported that the number of pupils on
roll fell as they were put into special measures, but rose when they reached
requires improvement. This has a destabilising effect on funding, particularly for
small schools. A sharp reduction significantly reduces funding and a sharp rise
increases it – but that money is only available the following year, due to the
lagged funding system.
59. However, schools believed that the dramatic rise and fall of pupil numbers in
these schools had less to do with parental choice than local authority decision-
making. Their impression was that local authorities would not send children to
schools in special measures but would send pupils on in-year transfers to a
school once it was graded requires improvement. This is because the school
would be seen as improving as well as having spare capacity.
60. Once a stuck school is graded requires improvement, the number of in-year
transfers it is given appears to be extremely large. One school reported mid-
year moves ‘in the hundreds’, which represented at least a 10% increase in its
pupil population. Other schools reported significant numbers.
61. It is not known why these pupils were being moved. Some schools spoke of
taking a large number of pupils who had been permanently excluded. Others
spoke of having a highly mobile pupil population, such as those from traveller
communities, migrant communities or unstable accommodation arrangements.
One school commented:
‘The other problem is the high churn of pupils due to the deprived area. With much
housing benefit private rented, people move around.’ (Governor, School 6b)
62. Five of the 20 schools invoked the phrase ‘dumping ground’ to refer to the
children they had been given. Four of these schools were stuck and just one
unstuck. However, general attitudes towards pupil populations tended to be
disparaging. Two senior leaders of stuck schools commented:
‘We get all the mid-year transfers and I've yet to see one where actually
there aren’t serious concerns, issues either with safeguarding or
behaviour… So, we very much feel like we're a dumping ground. That's
soured the relationship between us and the local authority because we
were expecting a bit of respite. Like, look, we're struggling, we don't have
full teachers, we don't have capacity, we're in special measures, give us a
bit of a break. But it was every other week.’ (Senior leader, School 4a)
‘It was the dumping ground, seen as the ‘toilet of schools’, with under
capacity. That reputation is still there. [Migrant communities] are always
sent to us as we have space. Students join part way through the year.
This doesn’t lend itself to creating stability.’ (Senior leader, School 8a)
Fight or flight? How ‘stuck’ schools are overcoming isolation
January 2020, No. 190042 1463. As mentioned, this is not an appropriate way to refer to children. A cycle of
poor performance has led, over time, to parent and pupil flight, which has led
to spare capacity. In turn, this has led to these schools becoming the ‘go to’ for
incoming pupils and a less stable pupil population.
Two types of stuck schools
64. Although all of the schools we visited had similar contextual challenges, the
stuck schools were not addressing these challenges effectively. These schools
broadly fell in two categories:
◼ those that were continually changing and lacked a stable culture and
staffing
◼ those that were not and instead had a resistant and embedded culture.
However, some schools had features of both categories.
65. In all stuck schools, governance and oversight were reported to be very weak.
Most governors felt they did not have the knowledge or skills to challenge
senior leadership teams. Often, the governors were led by the school, rather
than the other way around. The final chapter of this report discusses this
further.
Type A: Chaotic and change fatigued
66. Six of the 10 stuck schools fell into this category. A school fit this category if it
had at least two of the following attributes:
◼ unstable leadership
◼ unclear direction for school oversight
◼ inexperienced teacher workforce.
Unstable leadership
67. These stuck schools have very unstable leadership, with a change of
headteacher on average every one to two years. Leadership changes are
generally more frequent than section 5 Ofsted inspections, which are every
three years on average for all schools. One school reportedly had 14 different
headteachers in the space of 10 years. Over the same period, it had four full
inspections, showing that leadership change is not always related to inspection.
68. In most cases, incoming headteachers tried to establish a new culture at the
school but had not been successful. We do not know enough about these
former headteachers to know why this was the case. However, we have
provided details of good leadership decision-making later in this report.
Fight or flight? How ‘stuck’ schools are overcoming isolation
January 2020, No. 190042 15Unclear direction for school oversight
69. Leaders and staff within these stuck schools were anxious about the direction
of their school. They often spent time worrying about academisation or a
change in academy sponsor.
70. However, none of the schools we visited had transferred to a different academy
sponsor more than once over the many years they had been stuck. Of the 15
academies that we visited, only two had transferred sponsors. Indeed, changes
in headship were much more frequent than changes in academy sponsors.
71. Nevertheless, there was much speculation about potential transfers to new
sponsors in these schools. This perception related to the speculation rather
than reality of joining a MAT but was clearly distracting and demotivating for
staff. One teacher in a stuck school commented:
‘In the last seven years, we’ve had four headteachers. We’ve looked like
we’re joining three different MATs.’ (Teacher, School 8a)
Inexperienced teacher workforce
72. These schools have a high turnover of staff, with one school reporting 60%
turnover on average every year. There is a strong reliance on agency staff, new
graduates and Teach First trainees.
Type B: Resistant and embedded culture
73. Four of the stuck schools fell into this category. A school fit this category if it
had just two of the following attributes:
◼ settled leadership team
◼ long-standing teacher workforce
◼ antagonistic union voice.
Settled leadership team
74. These schools have had the same headteacher and a similar senior leadership
team (SLT) typically for around five years or more. During this period, they had
at least two full inspections graded less than good. Often, the headteacher is
someone who also used to be a deputy headteacher in the school and therefore
has worked there for an even longer period of time.
Long-standing teacher workforce
75. Teachers have been working for the school for a long period of time, often
decades. The headteacher and SLT have struggled to retain good teachers and
many have then left. Performance management of teachers who remain at the
school was reported to be poor because the SLT relies on them for having a
sufficient number of classes of a certain size.
Fight or flight? How ‘stuck’ schools are overcoming isolation
January 2020, No. 190042 16Antagonistic union voice
76. Although there is a helpful and constructive union voice in many schools, this is
less constructive in a small number of these schools. Both teachers and leaders
in at least two schools commented on the difficulties this created. There was a
union strike in one school that we visited:
‘I met with the [specific union rep] who took a personal interest in the
school. They said that if there were any restructuring or redundancies,
they would go on strike and cripple us.’ (Headteacher, School 8a)
‘The previous MAT upset people… They precipitated the strikes. I don’t
fully go along with this as the staff are very militant and have been in
charge for years and years.’ (Teacher, School 8a)
77. Although headteachers in unstuck schools have been prepared to have difficult
discussions when needed, those in stuck schools are anxious about the time
and emotional energy needed to make changes at the school with the challenge
the union voice would give.
The role of school improvement support and inspection
78. The government has introduced a number of different school improvement
initiatives over the last two decades to help support underperforming schools,
in addition to system-wide policies such as academisation. Some of these
initiatives have been available to schools (though not always mandatorily) that
are judged as requires improvement, as well as those that are inadequate. A
summary is listed below. This list is not exhaustive and there are other forms of
school improvement support (for example, in local authorities) that also exist.
Figure 3: Summary of school improvement initiatives
Dates Name Summary
1998–2003 Education action zones An area-based programme
with several educationally
underperforming towns and
cities tasked with bringing
together schools, parents
and businesses to attract
private sponsorship.
1998–2005 Beacon schools A national status given to
high-performing schools,
requiring them to
disseminate good practice to
struggling schools.
1999–2006 Excellence in cities A place-based funding
programme for 58
underperforming local
authorities to support
Fight or flight? How ‘stuck’ schools are overcoming isolation
January 2020, No. 190042 17learning mentors, learning
support units, gifted and
talented projects and city
learning centres.
2001–2006 School facing challenging A category for schools in
circumstances which less than 25% of
pupils achieved five GCSEs
at grades A* to C,
prompting additional
government funding and
more regular inspection.
2003–2006 Leadership Incentive Grant A national fund for
struggling schools, with the
aim of enabling them to hire
experienced teachers and
leaders.
2005–present School improvement An individual from the local
partners (SIPs) authority tasked with
supporting struggling
schools with their self-
evaluation.
2006–present National leaders of A national network of
education (NLE) experienced leaders funded
to support other schools.
This was expanded in 2010.
2008–present Local leaders of education A local network of
(LLE) experienced leaders, funded
to support struggling
schools for a small number
of days a year.
2008–2011 National challenge advisors A national network of
advisors, working closely
with NLEs, to develop a
school improvement plan for
schools with fewer than
30% of pupils achieving five
or more GCSEs above grade
C.
2010–present Specialist leaders of A network of experienced
education (SLE) middle leaders with a
subject or specific area of
expertise (such as
behaviour).
2011–present Teaching schools A national network of good
or outstanding schools that
provide training for teachers
and support to schools in
their local area.
Fight or flight? How ‘stuck’ schools are overcoming isolation
January 2020, No. 190042 182012–present National leaders of A national network of
governance experienced governors
facing governance
challenges for a small
number of days a year.
2016–present Opportunity areas A place-based programme
to improve social mobility in
12 local authority districts,
bringing together local
stakeholders with central
government to create a plan
for the area.
2017–present Strategic School A national fund from which
Improvement Fund (SSIF) local authorities, MATs and
teaching schools could bid
to support eligible schools in
their area.
2017–present Teaching and Leadership Support for 10 providers of
Innovation Fund continuing professional
development to offer a
variety of programmes to
existing teachers and
leaders of schools who
principally work in Ofsted-
rated grade 3 or grade 4
schools which are within an
opportunity area or one of
category 5 and 6 LA
districts.
2018–present Tailored support programme To provide NLE-led tailored
packages of support to
schools facing severe
teacher recruitment and
retention challenges.
2018–present School improvement support Bespoke support for
underperforming schools,
comprising of help from
system leaders and
evidence-based support
programmes. In 2019/20,
eligibility is based on Ofsted
judgements.
79. Over the same period, there have also been changes to the way Ofsted
inspects and reports on schools. The most relevant changes to these schools,
as reported through the research visits, are the:
◼ introduction of non-graded monitoring visits of inadequate schools in
2001 (ceased as part of routine inspection in 2016 for maintained
Fight or flight? How ‘stuck’ schools are overcoming isolation
January 2020, No. 190042 19schools,7 as these schools would be academised by the DfE through
regional schools commissioners)
◼ introduction of improvement seminars for inadequate schools in 2002
(ceased in 2009)
◼ introduction of monitoring visits for satisfactory schools in 2009
(continues for requires improvement schools)
◼ replacement of the term ‘satisfactory’ with ‘requires improvement’ in
2012, to denote a grade 3 provider (continues)
◼ introduction of ‘getting to good’ seminars for requires improvement
schools in 2014 (ceased in 2015)
◼ introduction of the common inspection framework in 2015 (replaced in
2019 with the education inspection framework).
The literature on school improvement
80. This chapter presents an overview of the research on school improvement
initiatives and evaluates how well this is being put into practice for stuck
schools.
81. Much of the literature on school improvement warns against schools trying to
implement too many strategies at once.8 Research has instead concluded that
focusing on a small number of core goals is more effective.9 Indeed, this was a
main finding of our 2010 evaluation of the national strategies, which found
that:
‘the frequent introduction of new initiatives, materials and guidance led to
overload and diminished the potential effectiveness of each individual
initiative.’10
82. There is a significant body of literature on implementation science, particularly
in health policy. The literature tends to find positive effects of using an active
implementation framework,11 which advocates introducing initiatives that are
7
We continue these for schools in which we have safeguarding concerns.
8
See, for example: ‘Improving schools through external intervention’, Chapman, C., Continuum, 2006;
http://eprints.gla.ac.uk/75160.
9
‘Leadership in schools facing challenging circumstances’, Harris, A. and Chapman, C., 2002;
https://journals.sagepub.com/doi/abs/10.1177/08920206020160010301?journalCode=miea.
10
‘The National Strategies: a review of impact’, Ofsted, 2010, p.5;
https://webarchive.nationalarchives.gov.uk/20110704184741/https://www.ofsted.gov.uk/Ofsted-
home/Publications-and-research/Browse-all-by/Documents-by-type/Thematic-reports/The-National-
Strategies-a-review-of-impact.
11
See, for example: ‘Active implementation frameworks for successful service delivery’, Metz, A. et al.,
2014; https://journals.sagepub.com/doi/abs/10.1177/1049731514543667, and ‘The active
implementation frameworks: a roadmap for advancing implementation of comprehensive medication
management in primary care’, Blanchard, C. et al., 2017;
www.sciencedirect.com/science/article/abs/pii/S1551741117304916.
Fight or flight? How ‘stuck’ schools are overcoming isolation
January 2020, No. 190042 20flexible enough to be implemented with high fidelity. The Education Endowment
Foundation uses this literature in its ‘School’s guide to implementation’.12
83. Research has also suggested that context-specific initiatives are more effective
for schools that are struggling the most.13 This follows a wider body of
literature that supports the idea of balancing the fidelity of implementation with
flexibility.14
Timeline of school improvement initiatives
84. All the schools we visited had been involved in multiple forms of school
improvement initiatives (usually around five to six), receiving advice from
several different organisations and individuals since 2005. Because we were not
always able to speak to staff who were at the school since 2005, it is likely that
the number of improvement initiatives they have received is underestimated.
Most schools received advice from NLEs and could usually recall working with
two or three different NLEs.
85. The visits highlighted the fact that just as many stuck schools had received
support as unstuck schools: there was no apparent difference in levels of, or
access to, support (figure 4).
12
‘Putting evidence to work: a school’s guide to implementation’, Education Endowment Foundation,
2018, https://educationendowmentfoundation.org.uk/tools/guidance-reports/a-schools-guide-to-
implementation.
13
‘Challenging the challenged: developing an improvement programme for schools facing
exceptionally challenging circumstances’, Reynolds, D. et al., 2007;
www.tandfonline.com/doi/abs/10.1080/09243450600743509.
14
See, for example: ‘Improving schools in difficult and challenging contexts: strategies for
improvement’, Harris, A. and Chapman, C., 2010;
www.tandfonline.com/doi/abs/10.1080/0013188042000277296?src=recsys, ‘Improving secondary
students' academic achievement through a focus on reform reliability: 4- and 9-year findings from the
High Reliability Schools project’, Reynolds, D., 2008;
www.researchgate.net/publication/242139119_Improving_secondary_students'_academic_achieveme
nt_through_a_focus_on_reform_reliability_4-_and_9-
year_findings_from_the_High_Reliability_Schools_project,
‘Balancing fidelity with flexibility and fit: what do we really know about fidelity of implementation in
schools?’, Harn, B., et al., 2013; https://journals.sagepub.com/doi/10.1177/001440291307900204,
and ‘The importance of studying the implementation of intervention in school settings’, Lendrum, A.
and Humphrey, N., 2012; www.tandfonline.com/doi/abs/10.1080/03054985.2012.734800.
Fight or flight? How ‘stuck’ schools are overcoming isolation
January 2020, No. 190042 21Figure 4: Timelines comparing school improvement initiatives for a stuck school and an unstuck school Note: The timeline shows the years that the school took part in improvement initiatives. Note: The timeline shows the years that the school took part in improvement initiatives. Fight or flight? How ‘stuck’ schools are overcoming isolation January 2020, No. 190042 22
86. We know, however, by the fact the stuck schools are still not graded good that
    these initiatives did not have a substantial enough impact. Evidence from visits
    also suggests that unstuck schools did not find them to be transformative
    either, as discussed in the next section.

Views on school improvement initiatives
87. This section summarises the views from stuck and unstuck schools on the effect
    of those initiatives. Although some of the schools we visited were unstuck,
    there was no evidence to suggest that any of the school improvement initiatives
    were important in this transformation. Our evidence is, however, based on
    schools’ perspectives rather than a full analysis of impact. Because some of the
    school leaders, staff and governors that we spoke to were those who had been
    running or working in stuck schools for some time, their ability to fully evaluate
    their school’s position may have been weak.

88. The findings contrast with schools’ views of internally driven factors for
    improvement, such as behaviour policy change, which were often cited as
    having a transformative effect. Although there can be a link between external
    support and internal policy changes, this link was not made explicit by the
    schools we visited.

89. Overall, schools told us that they received too much advice and that this advice
    was ‘thrown’ at them without enough thought. They found that the quality of
    those providing advice and support was too variable. When it was seen to work,
    the advice was tailored to the problems within the school and the individuals
    involved spent time working with staff. When it was seen to fail, there was too
    much general, one-size-fits-all advice, with individuals spending too little time
    and giving too little thought to the priorities of the school.

Leaders of education

90. Most schools that we visited had received support from one or several of the
    following:

           ◼ national leaders of education (NLEs), who are experienced school leaders
             with a track record of at least three years working for a school that is
             graded good or better
           ◼ local leaders of education (LLEs), who are no longer managed by the
             DfE, but can be designated by teaching schools to provide leadership
             support
           ◼ specialist leaders of education (SLEs), who are experienced leaders with
             a specialism in a subject area, or specialist leadership area (such as
             behaviour).

Fight or flight? How ‘stuck’ schools are overcoming isolation
January 2020, No. 190042                                                            23
All these types of ‘system leaders’ are made available to support struggling
schools and schools would normally approach the teaching school to broker
support in the period of interest.15
91. There were a range of views about leaders of education. Some school
leadership teams had found their support helpful in the past, while others
thought their work had added confusion and given misplaced attention to some
areas of school improvement.
92. There were two circumstances in which leaders of education were perceived to
work well:
◼ when designated leaders (for example, NLEs or SLEs) had been found
from staff within the MAT rather than outside it
◼ when leaders took the time to understand the school and deliver
bespoke support.
This is exemplified in two headteachers’ comments:
‘The MAT had commissioned support involving an NLE in the academy
trust, coming to work with me doing mentoring learning walks and
performance management support. Really really effective… Very much
bespoke to us: what we needed and required.’ (Headteacher, School 9a)
‘We brought in SLEs from the MAT, who spent one or two days a week to
up-skill teachers. This was external moderation… SLEs from outside the
trust didn’t have the right skill set: we needed those who’d worked in
challenging schools.’ (Headteacher, School 7a)
93. Leaders of education were considered less effective when they did not spend
the time to get to know the challenges with the school:
‘[The] SLE was not effective – they did not team teach and support. They
spent the time monitoring without the coaching, modelling and support.
Most of the time the teachers were left to their own devices.’ (Deputy
headteacher, School 1a)
‘Local leaders of education, we didn’t see them enough… It was a
mismatch, it wasn’t appropriate to our children. When their teachers came
to work with us, their jaws dropped. They didn’t have the skills they
needed in our school.’ (Assistant headteacher, School 2a)
‘In some cases, because they didn’t take the time to get to know the
school, the NLE didn’t always offer the right things to do’ (Headteacher,
School 2a)
15
‘School improvement support for the 2019 to 2020 academic year’, Department for Education,
2019; www.gov.uk/guidance/school-improvement-support-for-the-2019-to-2020-academic-year.
Fight or flight? How ‘stuck’ schools are overcoming isolation
January 2020, No. 190042 2494. Other schools reflected their view that leaders of education (particularly LLEs)
were more interested in elevating their personal position in the local network of
schools than providing high-quality advice. Some described this as ‘a power
thing’ with senior leaders from local schools.
95. Some of the leaders we spoke to were leaders of education themselves. They
believed that there needed to be a better matching process between the leader
(usually an NLE) and the context and challenges of the school.
Teaching schools
96. The success of the match between the stuck school and a teaching school was
also considered important. As set out in the appendix, a teaching school is a
good or outstanding school that provides training for teachers and support to
schools in its local area. When teaching schools were reported as being
successful in helping a school improve, this included close working between
headteachers and mentorship.
97. For others, teaching schools have been frustrating and confusing, with some
describing the experience as ‘demoralising’ for staff. This was particularly the
case in resistant and embedded schools when there could be a conflict of vision
between the leadership of the school and the teaching school that was left
unaddressed:
‘In teaching school 1, I knew some heads who had worked with the school
and said that the school had similar expectations. This was successful.
However, teaching school 2 had a totally different outlook to me, and
different to parents and children. They wanted our staff to work their way.
This was frustrating for our teachers. It was confusing for teachers who
asked, “do I follow you or the teaching school? You are saying different
things”.’ (Headteacher, School 1a)
98. Staff in some schools (particularly classroom teachers) felt they had a lack of
autonomy over which teaching schools would be appropriate for them. As
school leadership teams are usually able to choose their teaching school
partners, this may reflect a divergence of opinion on the school’s needs. Some
teachers found that teaching schools did not have the resources required to
facilitate improvement, such as the necessary subject-specialist teachers.
School improvement partners
99. There were mixed views about the effect and quality of school improvement
partners. Some schools remembered historically quite large teams of senior
leaders being sent to the school from the local authorities. This was viewed as
supportive but in all cases the school remained stuck afterwards. Two leaders
commented:
‘If I can think back, there was a team of SIPs in 2010. They’d come in,
here and there, for a day, from the LA. It was saying the right things but
Fight or flight? How ‘stuck’ schools are overcoming isolation
January 2020, No. 190042 25then they’d go off for weeks and nothing really changes. It must’ve been a
huge investment.’ (Senior leader, School 7a)
‘When I arrived the behaviour policy was phoning 999 to access the
police. It was beyond chaotic. The SIP had no appreciation of the amount
of work needed to turn around a highly challenging school. Her reports
focused incorrectly on areas that were not of significance. I made a fuss –
changed a SIP.’ (Headteacher, School 4a)
100. Schools were more positive about their recent encounters with SIPs. These
individuals were either attached to their MATs or from an outstanding school in
the local area. Advice is welcomed when it is more practical and when the
relationship with the school is sustained:
‘Historically, we've had a couple of SIPs that we thought were okay but
not great… But now we've got our SIP, who is a local outstanding
headteacher, and has been outstanding for many years, and she's able to
come in, she does a very rigorous review, and she does a lot of peer
coaching with [headteacher] and is very practical… Previously too much
advice was given, it was too expensive and limited impact.’ (Governor,
School 4a)
Opportunity areas
101. Only two of the schools we visited reported being part of an opportunity area
and both schools were stuck. In the main, their involvement in the initiative
was too recent for the schools to evaluate its effect. However, one school
commented on the difficulty it had in accessing support with an unstable
leadership:
‘The opportunity area has been difficult to access in the right way. The
process has been tricky, so we’ve missed out on this. Without the
continuity and consistency of our leadership, we’ve not been able to
access this pot of money as we’ve had too many changes in staff. It’s a
very specific process to achieve this.’ (Senior leader, School 8a)
102. This suggests, as with other initiatives, that stuck schools need high-quality
support to prioritise and coordinate their improvement journey. The leadership
of these schools either lacks those essential skills or is busy dealing with the
day-to-day difficulties of running the school.
The quality of advice
103. As the evidence from our school visits demonstrates, there is no shortage of
support and advice available to stuck schools. Many schools commented on the
sheer volume of initiatives and advice available out there, with the feeling that
these were ‘thrown at’ the school without enough consideration:
Fight or flight? How ‘stuck’ schools are overcoming isolation
January 2020, No. 190042 26You can also read


